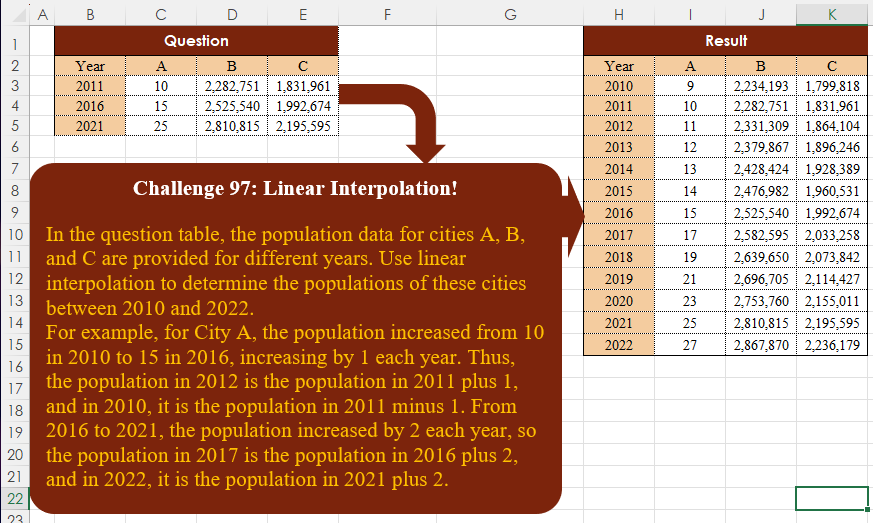
Challenge No. 102: In the historical sales table, identify and extract the dates where the sales value on that date is greater than the sales on the previous date.
Solved using:Excel (DROP, FILTER, IF), Google Sheets, Power Query (Table.AddColumn, Table.AddIndexColumn, Table.SelectColumns), Python, Python in Excel, R, and VBA.
VSTACK
Stacks arrays vertically into a single column in Excel.
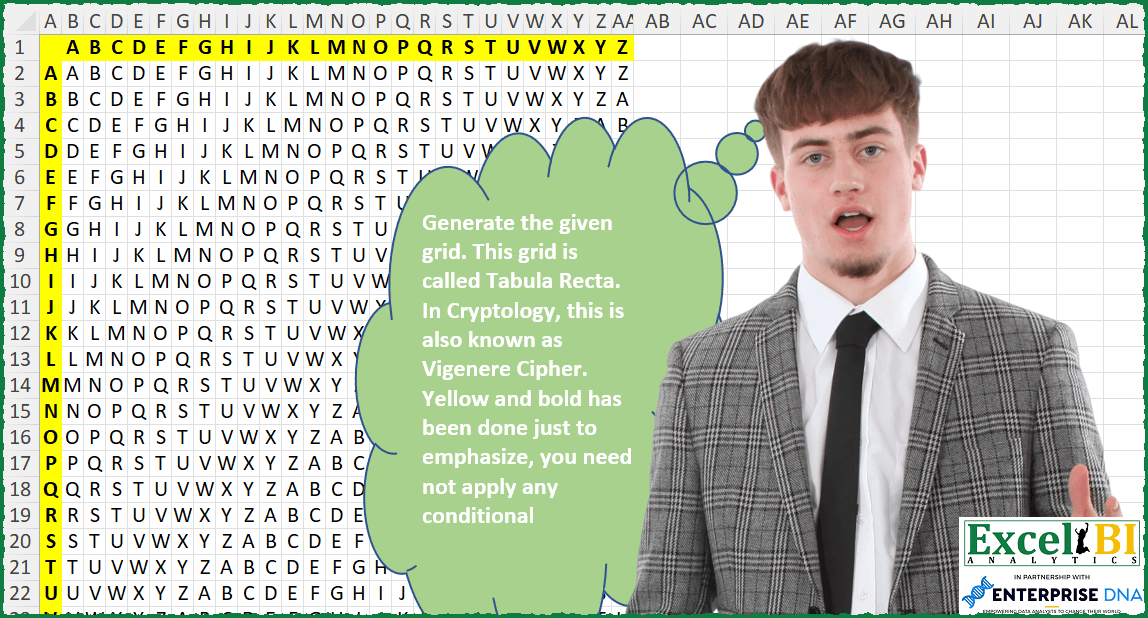
Generate Tabula Recta Grid
Challenge No. 88: Generate the given grid.
Solved using: Python.
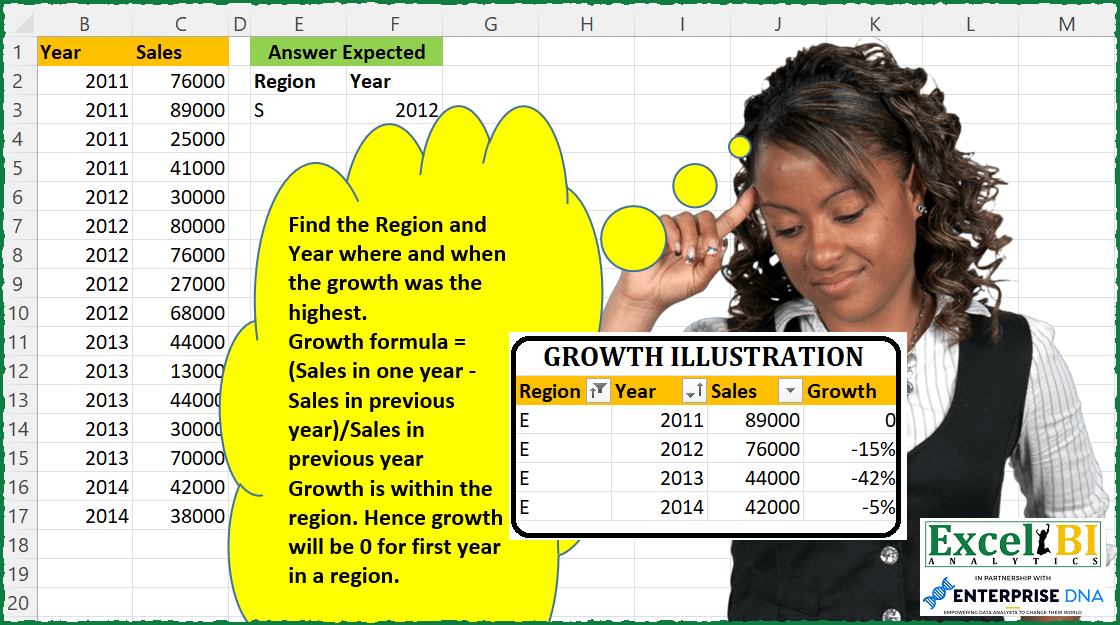
Region-Year with Max Growth
Challenge No. 87: Find the Region and Year where and when the growth was the highest.
Solved using: DAX.
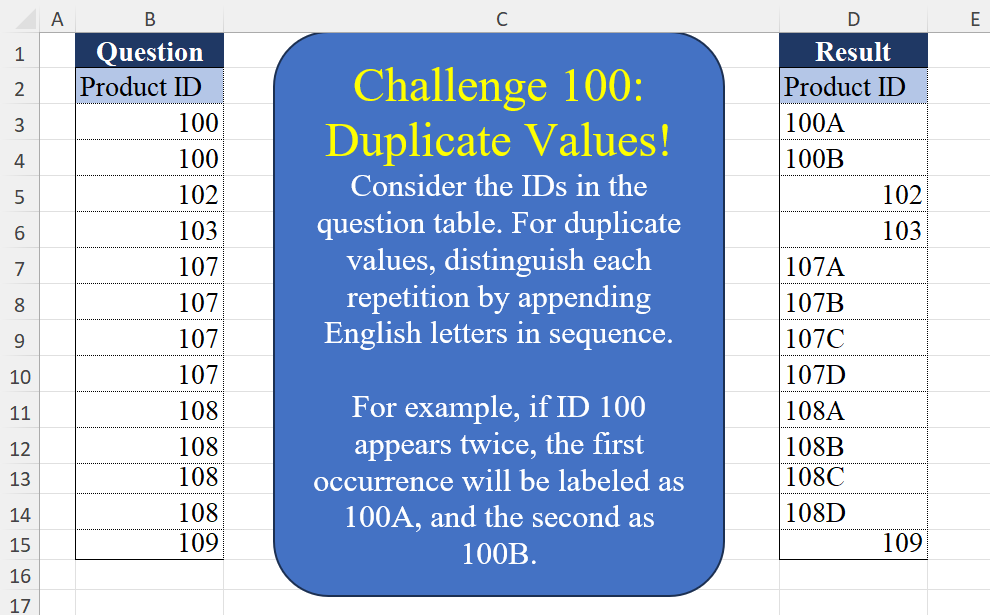
Duplicate Values! Part 1
Challenge No. 100: Consider the IDs in the question table.
Solved using:Excel (CHAR, COUNTIF, COUNTIFS), Google Sheets, Power Query (List.Transform, Table.AddColumn, Table.Group), Python, Python in Excel, and R.
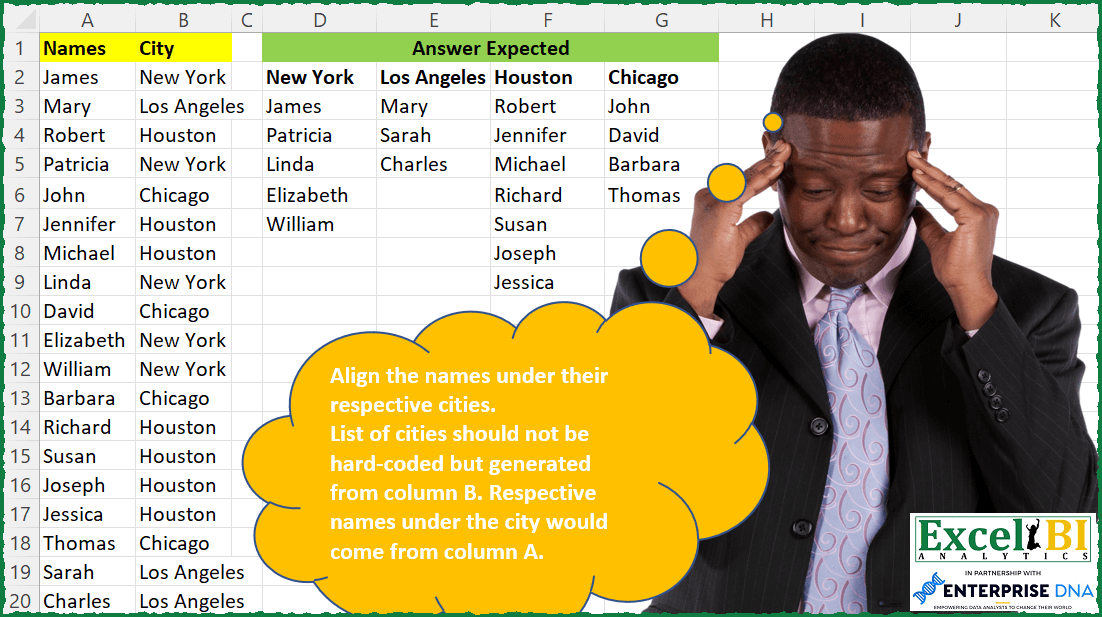
Align Names by Cities
Challenge No. 86: Align the names under their respective cities.
Solved using: Power Query.
Subjects Taught Exclusively
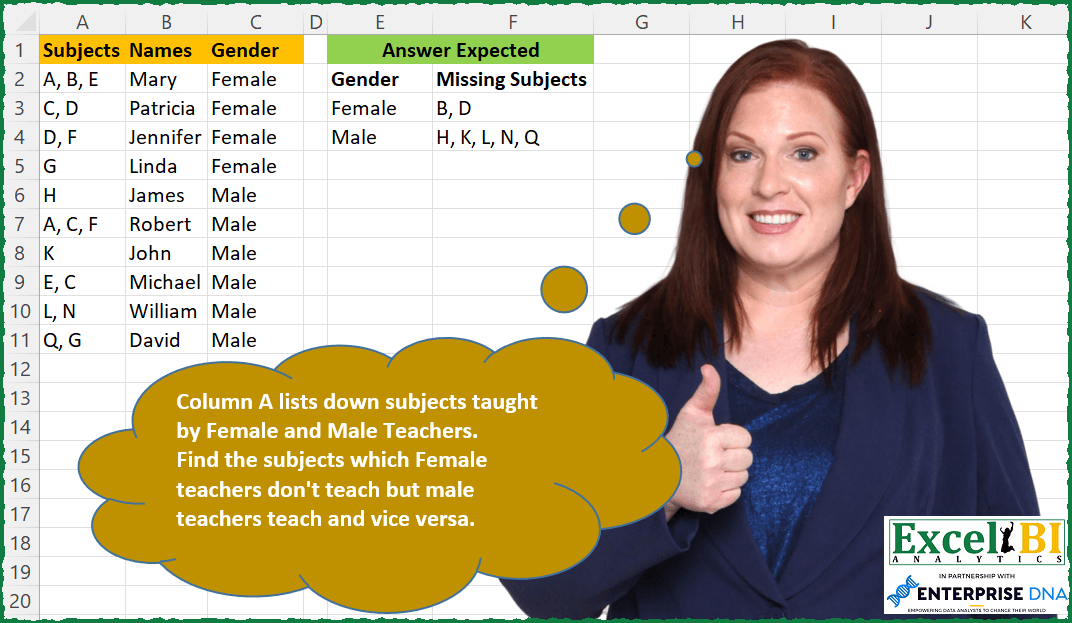
Challenge No. 85: Column A lists down subjects taught by Female and Male Teachers.
Solved using: SQL.
Random Selection! Part 2
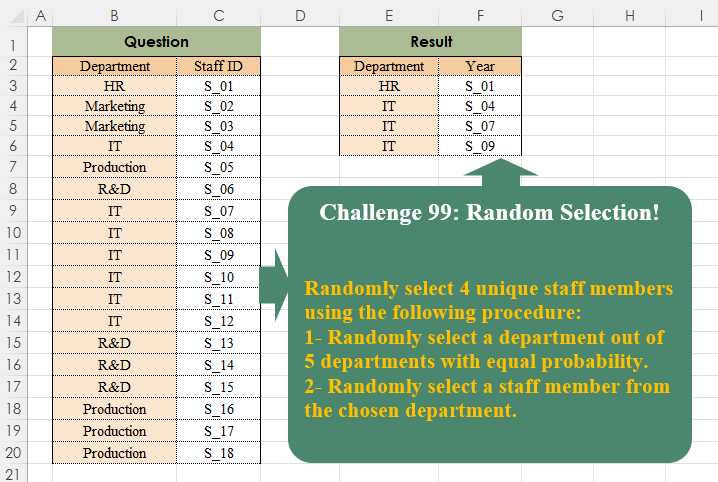
Challenge No. 99: Randomly select 4 unique staff members using the following procedure:
1- Randomly select a department out of 5 departments with equal probability.
Solved using:Excel, Power Query, and R.
Data Cleaning! Part 1
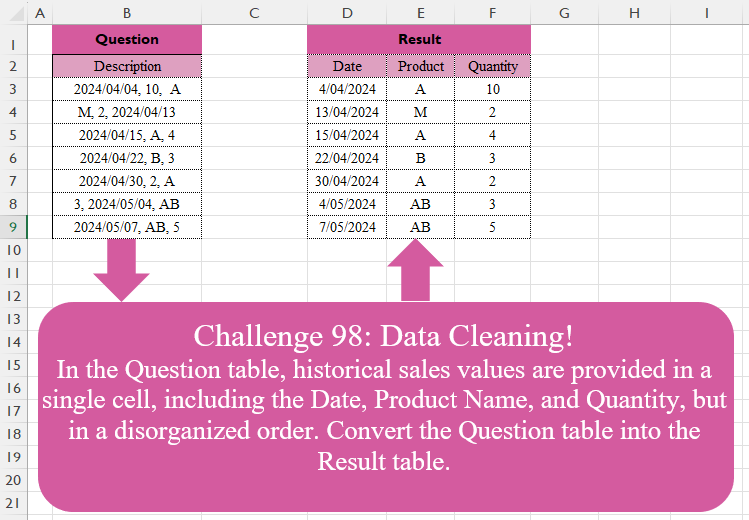
Challenge No. 98: In the Question table, historical sales values are provided in a single cell, including the Date, Product Name, and Quantity, but in a disorganized order.
Solved using:Excel (FILTER, HSTACK, IF), Google Sheets, Power Query (List.Transform, Text.Contains, Text.Split), Python, Python in Excel, and R.
Top 5 Goal Scoring Teams
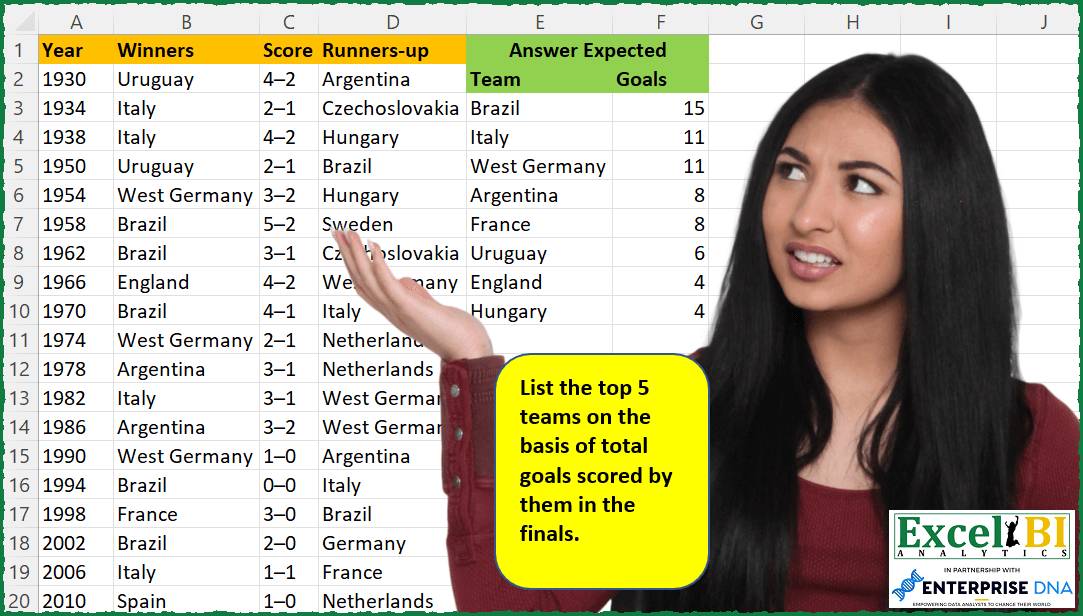
Challenge No. 75: — This week will be FIFA World Cup week.
Solved using: SQL.
Linear Interpolation!
Challenge No. 97: In the question table, the population data for cities A, B, and C are provided for different years.
Solved using:Excel, Google Sheets, Power Query, Python, Python in Excel, and R.