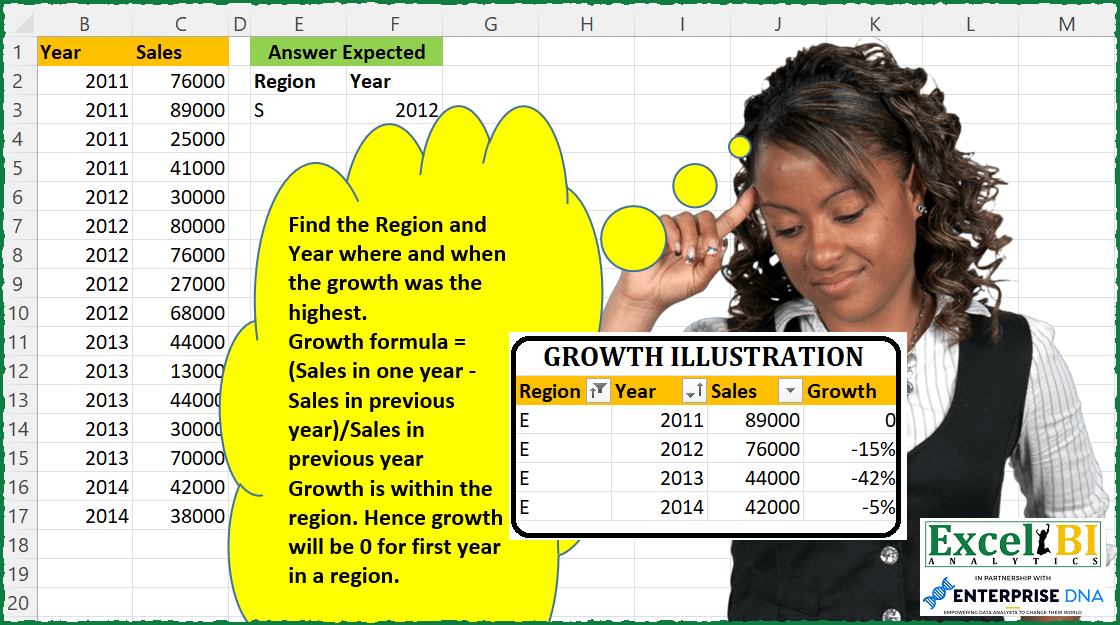
Find the Region and Year where and when the growth was the highest. Growth formula = (Sales in one year – Sales in previous year)/Sales in previous year Growth is within the region. Hence growth will be 0 for first year in a region.
📌 Challenge Details and Links
ExcelBI Excel Challenge Number: 87
Challenge Difficulty: ⭐️⭐️
📥Download Sample File
📥Link to the solutions on LinkedIn
Solving the challenge of Region-Year with Max Growth with Power Query
Power Query solution 1 for Region-Year with Max Growth, proposed by Bo Rydobon 🇹🇭:
let
  Source = Excel.CurrentWorkbook(){[Name = "Table1"]}[Content],
  Grouped = Table.Group(
    Source,
    {"Region"},
    {
      "A",
      each List.Zip(
        {
          [Region],
          [Year],
          List.Transform(
            List.Zip({[Sales], {0} & List.RemoveLastN([Sales])}),
            each if _{1} <> 0 then _{0} / _{1} else 0
          )
        }
      )
    }
  ),
  Growth = Table.FromRows(List.Combine(Grouped[A]), Table.ColumnNames(Source)),
  Max = Table.RemoveColumns(
    Table.SelectRows(Growth, each ([Sales] = List.Max(Growth[Sales]))),
    "Sales"
  )
in
  Max
Power Query solution 2 for Region-Year with Max Growth, proposed by Alejandro Simón 🇵🇦 🇪🇸:
let
  Source = Table.Sort(
    Excel.CurrentWorkbook(){[Name = "Table1"]}[Content],
    {{"Region", Order.Ascending}, {"Year", Order.Ascending}}
  ),
  Grouped = Table.Group(
    Source,
    {"Region"},
    {
      {
        "Count",
        each
          let
            a = Table.AddIndexColumn(_, "Index", 0, 1, Int64.Type),
            b = Table.AddColumn(
              a,
              "Growth",
              (X) =>
                try ([Sales]{X[Index]} - [Sales]{X[Index] - 1}) / ([Sales]{X[Index] - 1}) otherwise 0
            )
          in
            b
      }
    }
  ),
  Expanded = Table.ExpandTableColumn(
    Grouped,
    "Count",
    {"Year", "Sales", "Growth"},
    {"Year", "Sales", "Growth"}
  ),
  Custom1 = Table.SelectRows(Expanded, each [Growth] = List.Max(Expanded[Growth]))[[Region], [Year]]
in
  Custom1
Power Query solution 3 for Region-Year with Max Growth, proposed by Luan Rodrigues:
let
  Fonte = Data,
  a = Table.Group(
    Fonte,
    {"Region"},
    {
      {
        "Contagem",
        each
          let
            a = Table.AddColumn(_, "YoY", each [Year] - 1),
            b = Table.NestedJoin(
              a,
              {"Region", "YoY"},
              a,
              {"Region", "Year"},
              "a",
              JoinKind.LeftOuter
            ),
            c = Table.ExpandTableColumn(b, "a", {"Sales"}, {"Sales.1"}),
            d = Table.AddColumn(c, "Personalizar", each ([Sales] - [Sales.1]) / [Sales.1])
          in
            d
      }
    }
  ),
  b = Table.ExpandTableColumn(a, "Contagem", {"Year", "Personalizar"}, {"Year", "Personalizar"}),
  Result = Table.SelectRows(b, each ([Personalizar] = List.Max(b[Personalizar])))[[Region], [Year]]
in
  Result
Power Query solution 4 for Region-Year with Max Growth, proposed by Bhavya Gupta:
let
  Source = Excel.CurrentWorkbook(){[Name = "Table1"]}[Content],
  FnGr = (list) =>
    let
      GR = {0}
        & List.Transform(
          List.Zip({List.Skip(list), List.RemoveLastN(list, 1)}),
          each _{0} / _{1} - 1
        )
    in
      GR,
  Grouped = Table.Group(
    Source,
    {"Region"},
    {{"Year", each [[Region], [Year]]}, {"Growth Rate", each FnGr([Sales])}}
  )[[Year], [Growth Rate]],
  Tbl = Table.FromColumns(
    Table.ToColumns(Table.Combine(Grouped[Year])) & {List.Combine(Grouped[Growth Rate])},
    {"Region", "Year", "Growth Rate"}
  ),
  ExpectedOutput = Table.SelectRows(Tbl, each ([Growth Rate] = List.Max(Tbl[Growth Rate])))
in
  ExpectedOutput
Power Query solution 5 for Region-Year with Max Growth, proposed by Jaroslaw Kujawa:
let
  Source = Excel.CurrentWorkbook(){[Name = "Data"]}[Content],
  #"Sorted Rows" = Table.Sort(Source, {{"Region", Order.Ascending}, {"Year", Order.Ascending}}),
  #"Added Index" = Table.AddIndexColumn(#"Sorted Rows", "Index", 1, 1, Int64.Type),
  #"Added Custom" = Table.AddColumn(
    #"Added Index",
    "Custom",
    each try

        if [Region] = #"Added Index"[Region]{[Index] - 2} then
          [Sales] / #"Added Index"[Sales]{[Index] - 2}
        else
          0
    otherwise
      null
  ),
  #"Added Custom1" = Table.AddColumn(
    #"Added Custom",
    "Custom.1",
    each [Custom] = List.Max(Table.Column(#"Added Custom", "Custom"))
  ),
  #"Filtered Rows" = Table.SelectRows(#"Added Custom1", each ([Custom.1] = true)),
  #"Removed Other Columns" = Table.SelectColumns(#"Filtered Rows", {"Region", "Year"})
in
  #"Removed Other Columns"
Power Query solution 6 for Region-Year with Max Growth, proposed by Matthias Friedmann:
let
  Source = Excel.CurrentWorkbook(){[Name = "GrowthRegion"]}[Content],
  #"Grouped Rows" = Table.Group(
    Source,
    {"Region"},
    {
      {
        "Sales",
        each Table.Max(
          Table.AddColumn(
            Table.FromColumns(
              {[Year]} & {[Sales]} & {{null} & List.RemoveLastN([Sales], 1)},
              {"Year", "Sales", "Prev"}
            ),
            "Growth",
            each [Sales] / [Prev]
          ),
          "Growth"
        )[[Year], [Growth]]
      }
    }
  ),
  #"Expanded Sales" = Table.ExpandRecordColumn(#"Grouped Rows", "Sales", {"Year", "Growth"}),
  #"Filtered Rows" = Table.SelectRows(
    #"Expanded Sales",
    each ([Growth] = List.Max(#"Expanded Sales"[Growth]))
  )[[Region], [Year]]
in
  #"Filtered Rows"
Power Query solution 8 for Region-Year with Max Growth, proposed by Victor Wang:
let
  Source = Excel.CurrentWorkbook(){[Name = "Table1"]}[Content],
  Group = Table.Group(
    Source,
    {"Region"},
    {
      {
        "all",
        each List.Accumulate(
          Table.ToRecords(Table.Sort(_, "Year")),
          [Region = null, Year = null, Sales = 0, Growth = 0],
          (state, current) =>
            if state[Sales] = 0 then
              [Region = null, Year = null, Sales = current[Sales], Growth = 0]
            else
              let
                g = current[Sales] / state[Sales] - 1
              in
                if g > state[Growth] then
                  [
                    Region = current[Region],
                    Year   = current[Year],
                    Sales  = current[Sales],
                    Growth = g
                  ]
                else
                  state
        )
      }
    }
  ),
  Result = Table.FromRecords({List.Max(Group[all], 0, each [Growth])}, {"Region", "Year"})
in
  Result
Power Query solution 9 for Region-Year with Max Growth, proposed by Venkata Rajesh:
let
  Source = Data,
  Growth = Table.AddColumn(
    Source,
    "Growth",
    each
      let
        _prvYear   = [Year] - 1,
        _region    = [Region],
        _prvYSales = try Source{[Region = _region, Year = _prvYear]}[Sales] otherwise null
      in
        ([Sales] - _prvYSales) / _prvYSales
  ),
  Output = Table.SelectRows(Growth, each [Growth] = List.Max(Growth[Growth]))[[Region], [Year]]
in
  Output
Power Query solution 10 for Region-Year with Max Growth, proposed by Krzysztof Kominiak:
let
  Source = Excel.CurrentWorkbook(){[Name = "Table1"]}[Content],
  GroupRows = Table.Group(Source, {"Region"}, {{"Ntab", each _}}),
  FXconvert = (myTabs) =>
    let
      S = Table.ToColumns(myTabs),
      D = S
        & {
          {null}
            & List.Skip(
              List.Transform(List.Transform(List.Positions(S{2}), each _ - 1), each S{2}{_})
            )
        },
      N = Table.FromColumns(D, {"Region", "Year", "Sales", "PrevSales"}),
      M = Table.AddColumn(
        N,
        "Max",
        each (Number.From([Sales]) - Number.From([PrevSales])) / Number.From([PrevSales]),
        Percentage.Type
      )
    in
      M,
  InvokFX = Table.SelectColumns(
    Table.AddColumn(GroupRows, "fxMaxSales", each FXconvert([Ntab])),
    "fxMaxSales"
  ),
  ExpandRows = Table.ExpandTableColumn(
    InvokFX,
    "fxMaxSales",
    {"Region", "Year", "Sales", "PrevSales", "Max"},
    {"Region", "Year", "Sales", "PrevSales", "Max"}
  ),
  Result = Table.SelectColumns(
    Table.FirstN(Table.Sort(ExpandRows, {{"Max", Order.Descending}}), 1),
    {"Region", "Year"}
  )
in
  Result
Power Query solution 11 for Region-Year with Max Growth, proposed by Jan Willem Van Holst:
let
  Source = Table.FromRows(
    Json.Document(
      Binary.Decompress(
        Binary.FromText(
          "Xc4xDsAgCEDRuzA7AFq1c9O1i4OD8f7XqMQQIhPJC+QzBnwQgJFojZIREWYY8BrWW7Eb8qXYDBMpPht5jYiKn2FFF+Kj3g25uJBgri4UpZ5cSJCiC52b3dD+bIbF/5nknN25YNwvzR8=",
          BinaryEncoding.Base64
        ),
        Compression.Deflate
      )
    ),
    let
      _t = ((type nullable text) meta [Serialized.Text = true])
    in
      type table [Region = _t, Year = _t, Sales = _t]
  ),
  Base = Table.Buffer(
    Table.TransformColumnTypes(
      Source,
      {{"Region", type text}, {"Year", Int64.Type}, {"Sales", Int64.Type}}
    )
  ),
  #"Added Custom" = Table.AddColumn(
    Base,
    "Custom",
    each Table.SelectRows(
      Base,
      (inner) => ([Year] - 1 = inner[Year]) and ([Region] = inner[Region])
    )[Sales]{0}
  ),
  #"Removed Errors" = Table.RemoveRowsWithErrors(#"Added Custom", {"Custom"}),
  #"Renamed Columns" = Table.RenameColumns(#"Removed Errors", {{"Custom", "Sales LY"}}),
  #"Added Custom1" = Table.AddColumn(
    #"Renamed Columns",
    "change",
    each ([Sales] - [Sales LY]) / [Sales LY]
  ),
  #"Filtered Rows" = Table.SelectRows(
    #"Added Custom1",
    each ([change] = List.Max(#"Added Custom1"[change]))
  ),
  #"Removed Other Columns" = Table.SelectColumns(#"Filtered Rows", {"Region", "Year"})
in
  #"Removed Other Columns"
Power Query solution 12 for Region-Year with Max Growth, proposed by Thomas DUCROQUETZ:
let
  Source = YourRawData,
  ModifType = Table.TransformColumnTypes(
    Source,
    {{"Region", type text}, {"Year", Int64.Type}, {"Sales", Int64.Type}}
  ),
  AddGrowth = Table.AddColumn(
    ModifType,
    "Growth",
    each
      let
        CurrentRegion = [Region],
        CurrentSales = [Sales],
        CurrentYear = [Year],
        PrevSales = try
          Table.SelectRows(ModifType, each [Year] = CurrentYear - 1 and [Region] = CurrentRegion)[
            Sales
          ]{0}
        otherwise
          null
      in
        (CurrentSales - PrevSales) / PrevSales,
    type number
  ),
  FinalResult = Table.SelectRows(AddGrowth, each ([Growth] = List.Max(AddGrowth[Growth])))[
    [Region],
    [Year]
  ]
in
  FinalResult
Power Query solution 13 for Region-Year with Max Growth, proposed by Gráinne Duggan:
(part 2 of 2 code)
 ExpandPYSales = Table.SelectColumns(Table.ExpandTableColumn(Table.RemoveColumns(ExpandPY,{"Custom2"}), "PreviousYr", {"Sales"}, {"SalesPY"}),{"Region", "Year", "Sales", "SalesPY"}),
 AddGrowth = Table.TransformColumnTypes(Table.AddColumn(ExpandPYSales, "Growth", each ([Sales]-[SalesPY])/[SalesPY]),{{"Growth", Percentage.Type}}),
 MAX = List.Max(Table.DuplicateColumn(AddGrowth,"Growth","MaxGrowth")[MaxGrowth]),
 Output = Table.SelectColumns(Table.SelectRows( Table.AddColumn(AddGrowth, "FLAG", each if [Growth] = MAX then "MAX" else null), each([FLAG] = "MAX")),{"Region", "Year"})
in
 Output
Solving the challenge of Region-Year with Max Growth with Excel
Excel solution 1 for Region-Year with Max Growth, proposed by Bo Rydobon 🇹🇭:
=LET(a,
    A2:A17,
    c,
    C2:C17,
    d,
    IFERROR(c/MAP(a,
    LAMBDA(x,
    LOOKUP(2,
    1/(x=TAKE(
        a,
        ROWS(
            x:A2
        )-1
    )),
    c))),
    ),
    FILTER(
        A2:B17,
        d=MAX(
            d
        )
    ))

=LET(a,
    A2:A17,
    c,
    C2:C17,
    d,
    IFERROR(c/MAP(a,
    LAMBDA(x,
    LOOKUP(2,
    1/(x=TAKE(
        a,
        ROWS(
            x:A2
        )-1
    )),
    c))),
    ),
    FILTER(
        A2:B17,
        d=MAX(
            d
        )
    ))
Excel solution 2 for Region-Year with Max Growth, proposed by Bo Rydobon 🇹🇭:
=LET(z,SORT(A2:C17,{1,2}),a,TAKE(z,,1),s,DROP(z,,2),d,IF(a=DROP(VSTACK(0,a),-1),s/DROP(VSTACK(0,s),-1)),FILTER(TAKE(z,,2),d=MAX(d)))

For only 1 max
=LET(z,SORT(A2:C17,{1,2}),a,TAKE(z,,1),s,DROP(z,,2),XLOOKUP(9,s/DROP(VSTACK(0,s),-1)/(a=DROP(VSTACK(0,a),-1)),TAKE(z,,2),,-1))
Excel solution 3 for Region-Year with Max Growth, proposed by John V.:
=LET(b,SORT(A2:C17),x,DROP(b,1),y,DROP(b,-1),d,(TAKE(x,,1)=TAKE(y,,1))*(INDEX(x,,3)/INDEX(y,,3)-1),VSTACK(A1:B1,FILTER(TAKE(x,,2),d=MAX(d))))

► Short formula:
=LET(r,A2:A17,y,B2:B17,s,C2:C17,d,s/XLOOKUP(r&y-1,r&y,s,-1)-1,VSTACK(A1:B1,FILTER(A2:B17,d=MAX(d))))

► Short formula without titles:
=LET(r,A2:A17,y,B2:B17,s,C2:C17,d,s/XLOOKUP(r&y-1,r&y,s,-1)-1,FILTER(A2:B17,d=MAX(d)))
Excel solution 4 for Region-Year with Max Growth, proposed by محمد حلمي:
=LET(
a,
    SORT(
        A2:C17,
        {1,
        2}
    ),

o,
    INDEX(
        a,
        ,
        1
    ),

v,
    VSTACK(
        1,
        DROP(
            a,
            1,
            2
        )/DROP(
            a,
            -1,
            2
        )-1
    )*(o=
VSTACK(
    1,
    DROP(
        o,
        -1
    )
)),
    TAKE(
        FILTER(
            a,
            v=MAX(
                v
            )
        ),
        ,
        2
    ))
Excel solution 5 for Region-Year with Max Growth, proposed by محمد حلمي:
=LET(
v,
    SORT(
        A2:C17,
        {1,
        2}
    ),

o,
    INDEX(
        v,
        ,
        1
    ),

a,
    DROP(REDUCE(0,
    UNIQUE(
        o
    ),

LAMBDA(r,
    d,
    LET(a,
    FILTER(
        v,
        o=d
    ),

i,
    INDEX(
        a,
        ,
        3
    ),

u,
    DROP(
        i,
        -1
    ),

VSTACK(r,
    HSTACK(a,
    VSTACK(0,
    (DROP(
        i,
        1
    )-u)/u)))))),
    1),
    TAKE(
        SORT(
            a,
            4
        ),
        -1,
        2
    ))
Excel solution 6 for Region-Year with Max Growth, proposed by 🇰🇷 Taeyong Shin:
=LET(
 sorted,
     SORT(
         A2:C17,
          {1,
         2}
     ),

 reg,
     INDEX(
         sorted,
          ,
          1
     ),

 y,
     INDEX(
         sorted,
          ,
          2
     ),

 sales,
     INDEX(
         sorted,
          ,
          3
     ),

 bool,
     VSTACK(
         @INDEX(
             reg,
              1
         ),
          DROP(
              reg,
               -1
          )
     ) = reg,

 g,
     MAP(bool,
     SEQUENCE(
         ROWS(
             bool
         )
     ),
     sales,
     LAMBDA(b,
    n,
    s,

 b * (s - 1) / @INDEX(
     sales,
      n - 1
 )
 )),

 INDEX(
     sorted,
      XMATCH(
          MAX(
              g
          ),
           g
      ),
      {1,
    & 2}
 )
)
Excel solution 7 for Region-Year with Max Growth, proposed by Kris Jaganah:
=LET(a,
    SORTBY(
        A2:C17,
        A2:A17,
        1,
        B2:B17,
        1
    ),
    b,
    IF(CHOOSECOLS(
        a,
        1
    )=DROP(
        CHOOSECOLS(
        a,
        1
    ),
        1
    ),
    ((DROP(
        CHOOSECOLS(
            a,
            3
        ),
        1
    )-CHOOSECOLS(
            a,
            3
        ))/CHOOSECOLS(
            a,
            3
        )),
    0),
    c,
    IFERROR(
        HSTACK(
            DROP(
        a,
        1
    ),
            b
        ),
        0
    ),
    d,
    FILTER(
        CHOOSECOLS(
            c,
            1,
            2
        ),
        CHOOSECOLS(
            c,
            4
        )=MAX(
            CHOOSECOLS(
            c,
            4
        )
        )
    ),
    d)
Excel solution 8 for Region-Year with Max Growth, proposed by Kris Jaganah:
=LET(a,SORTBY(A2:C17,A2:A17,1,B2:B17,1),b,IF(CHOOSECOLS(a,1)=DROP(CHOOSECOLS(a,1),1),DROP(CHOOSECOLS(a,3),1)-CHOOSECOLS(a,3),0),c,IFERROR(HSTACK(DROP(a,1),b),0),d,FILTER(CHOOSECOLS(c,1,2),CHOOSECOLS(c,4)=MAX(CHOOSECOLS(c,4))),d)Excel solution 9 for Region-Year with Max Growth, proposed by Aditya Kumar Darak 🇮🇳:
=LET(
 _d, A2:C17,
 _s, SORT(_d, {1, 2}, 1),
 _e, LAMBDA(a,
 IF(
 AND(INDEX(_s, a, 1) = INDEX(_s, a - 1, 1)),
 INDEX(_s, a, 3) / INDEX(_s, a - 1, 3) - 1,
 0
 )
 ),
 _c, MAP(SEQUENCE(ROWS(_d)), _e),
 _m, MAX(_c),
 _r, XLOOKUP(_m, _c, DROP(_s, , -1)),
 _r
)
Excel solution 10 for Region-Year with Max Growth, proposed by Aditya Kumar Darak 🇮🇳:
=LET(

     _d,
     A2:C17,

     _s,
     SORT(
         _d,
          {1,
          2},
          1
     ),

     _e,
     LAMBDA(
         a,
          b,

          IF(

               AND(
                   INDEX(
                       _s,
                        b,
                        1
                   ) = INDEX(
                       _s,
                        b - 1,
                        1
                   )
               ),

               INDEX(
                   _s,
                    b,
                    3
               ) / INDEX(
                   _s,
                    b - 1,
                    3
               ) - 1,

               0

          )

     ),

     _c,
     SCAN(
         1,
          SEQUENCE(
              ROWS(
                  _d
              )
          ),
          _e
     ),

     _m,
     MAX(
         _c
     ),

     _r,
     XLOOKUP(
         _m,
          _c,
          DROP(
              _s,
               ,
               -1
          )
     ),

     _r

)
Excel solution 11 for Region-Year with Max Growth, proposed by Timothée BLIOT:
=LET(Table,
    SORT(
        A2:C17,
        1
    ),

Pivot,
    PIVOTBY(
        INDEX(
            Table,
            ,
            1
        ),
        INDEX(
            Table,
            ,
            2
        ),
        INDEX(
            Table,
            ,
            3
        ),
        SUM
    ),

Cleaned,
    TAKE(
        IF(
            Pivot="",
            "#",
            Pivot
        ),
        ROWS(
            Pivot
        )-1,
        COLUMNS(
            Pivot
        )-1
    ),

YoY,
    MAKEARRAY(ROWS(
            Pivot
        )-1,
    COLUMNS(
            Pivot
        )-1,
    LAMBDA(a,
    b,
    IF((a>1)*(b>1),
    IF(OR(
        INDEX(
            Cleaned,
            a,
            b-1
        )="#",
        INDEX(
            Cleaned,
            a,
            b
        )="#",
        b=2
    ),
    0,
    (INDEX(
            Cleaned,
            a,
            b
        )-INDEX(
            Cleaned,
            a,
            b-1
        ))/INDEX(
            Cleaned,
            a,
            b-1
        )),
    INDEX(
            Cleaned,
            a,
            b
        )))),

HSTACK(

    TOROW(
        INDEX(
            YoY,
            BYCOL(
                YoY,
                LAMBDA(
                    a,
                    MATCH(
                        MAX(
                            TAKE(
                                YoY,
                                -ROWS(
                                    YoY
                                )+1,

                            )
                        ),
                        a,
                        0
                    )
                )
            ),
            1
        ),
        3
    ),

    TOCOL(
        INDEX(
            YoY,
            1,
            BYROW(
                YoY,
                LAMBDA(
                    a,
                    MATCH(
                        MAX(
                            TAKE(
                                YoY,
                                -ROWS(
                                    YoY
                                )+1,

                            )
                        ),
                        a,
                        0
                    )
                )
            )
        ),
        3
    )
))
Excel solution 12 for Region-Year with Max Growth, proposed by Charles Roldan:
=LET(Region, D2:D17, Year, E2:E17, Sales, F2:F17,
Ratio, IFNA(Sales/XLOOKUP(Region&(Year-1), Region&Year, Sales), ),
FILTER(HSTACK(Region, Year), Ratio=MAX(Ratio)))
Excel solution 13 for Region-Year with Max Growth, proposed by Viswanathan M B:
=max(g)))Solving the challenge of Region-Year with Max Growth with DAX
DAX solution 1 for Region-Year with Max Growth, proposed by Zoran Milokanović:
EVALUATE
SELECTCOLUMNS(
 TOPN(
 1,
 ADDCOLUMNS(Input,
 "G", VAR P = SELECTCOLUMNS(OFFSET(-1, DISTINCT(ALLSELECTED(Input)), ORDERBY(Input[Year]), PARTITIONBY(Input[Region])), Input[Sales]) RETURN DIVIDE(Input[Sales] - P, P, 0)
 ),
 [G], DESC
 ),
 Input[Region], Input[Year]
)
Solving the challenge of Region-Year with Max Growth with SQL
SQL solution 1 for Region-Year with Max Growth, proposed by Zoran Milokanović:
SELECT
 F.REGION
,F.YEAR
FROM
(
 SELECT
 T.REGION
 ,T.YEAR
 ,DENSE_RANK() OVER (ORDER BY(T.SALES - T.PREVIOUS_SALES) / PREVIOUS_SALES DESC) AS HIGHEST_RANKING
 FROM
 (
 SELECT
 D.REGION
 ,D.YEAR
 ,D.SALES
 ,NVL(LAG(D.SALES) OVER (PARTITION BY D.REGION ORDER BY D.YEAR), D.SALES) AS PREVIOUS_SALES
 FROM DATA D
 ) T
) F
WHERE
 1 = 1
ANDF.HIGHEST_RANKING = 1
;