
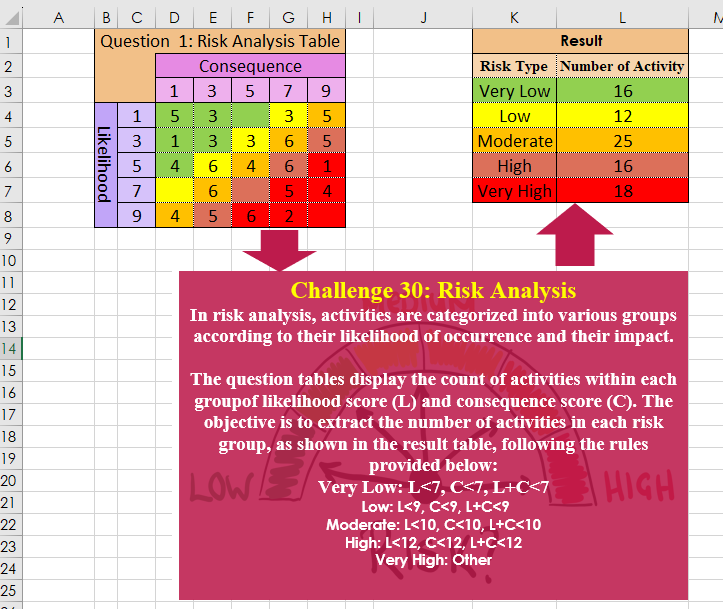
Challenge No. 30: In risk analysis, activities are categorized into various groups according to their likelihood of occurrence and their impact.
Solved using:Excel, Power Query, Python, and R.
Stacks arrays vertically into a single column in Excel.
Challenge No. 30: In risk analysis, activities are categorized into various groups according to their likelihood of occurrence and their impact.
Solved using:Excel, Power Query, Python, and R.
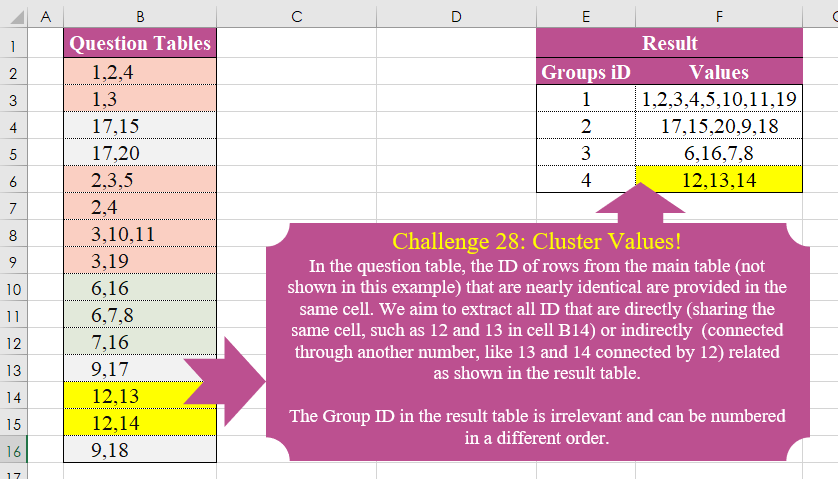
Challenge No. 28: In the question table, the ID of rows from the main table (not shown in this example) that are nearly identical are provided in the same cell.
Solved using:Excel (DROP, FILTER, HSTACK), Power Query (List.Transform), Python, and R.
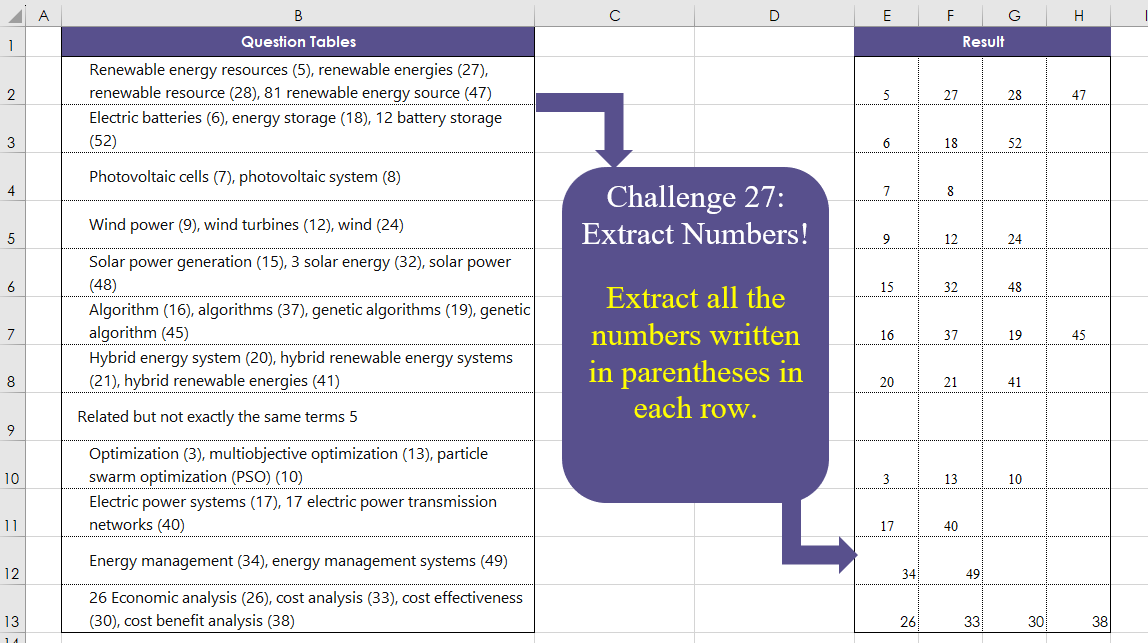
Challenge No. 27: Extract all the numbers written in parentheses in each row.
Solved using:Excel (DROP, IFERROR, IFNA), Power Query (List.Transform, Text.BetweenDelimiters, Table.AddColumn), Python, and R.

Challenge No. 26: The provided question table contains information regarding the amount of time individuals spend in meetings with each other, and we want to generate a result table that displays the percentage of time each person (G3:G7) spends with others (H2:L2), ensuring that the sum of each row equals 100%.
Solved using:Excel (HSTACK, INDEX, LAMBDA), and Power Query (Table.AddColumn).
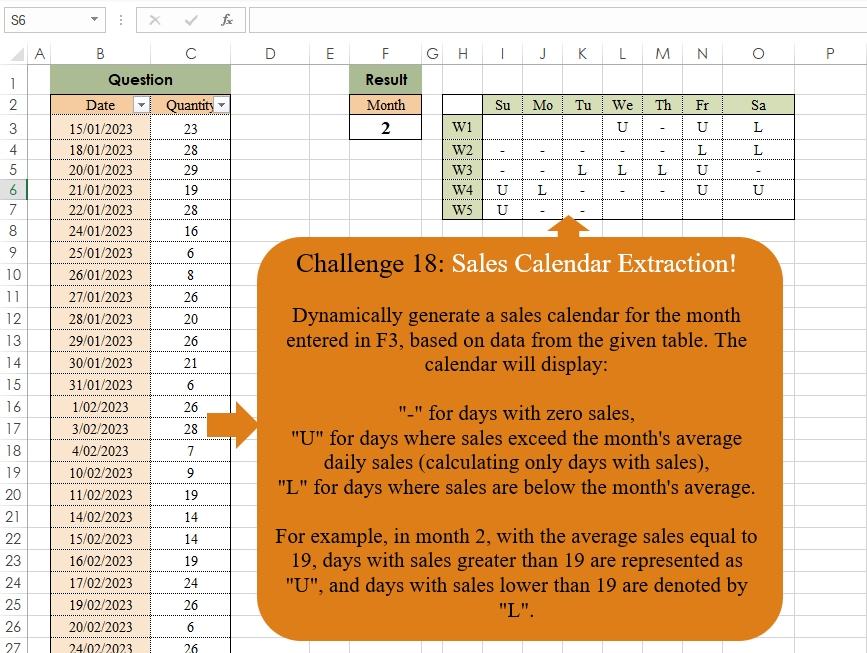
Challenge No. 18: Dynamically generate a sales calendar for the month entered in F3, based on data from the given table.
Solved using:Excel, Power Query, and R.
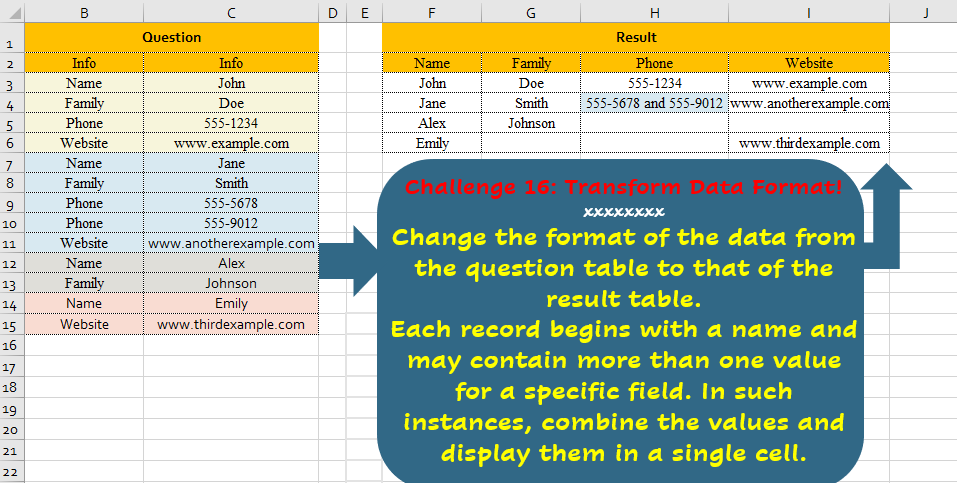
Challenge No. 16: Change the format of the data from the question table to that of the result table.
Solved using:Excel, Power Query, and R.
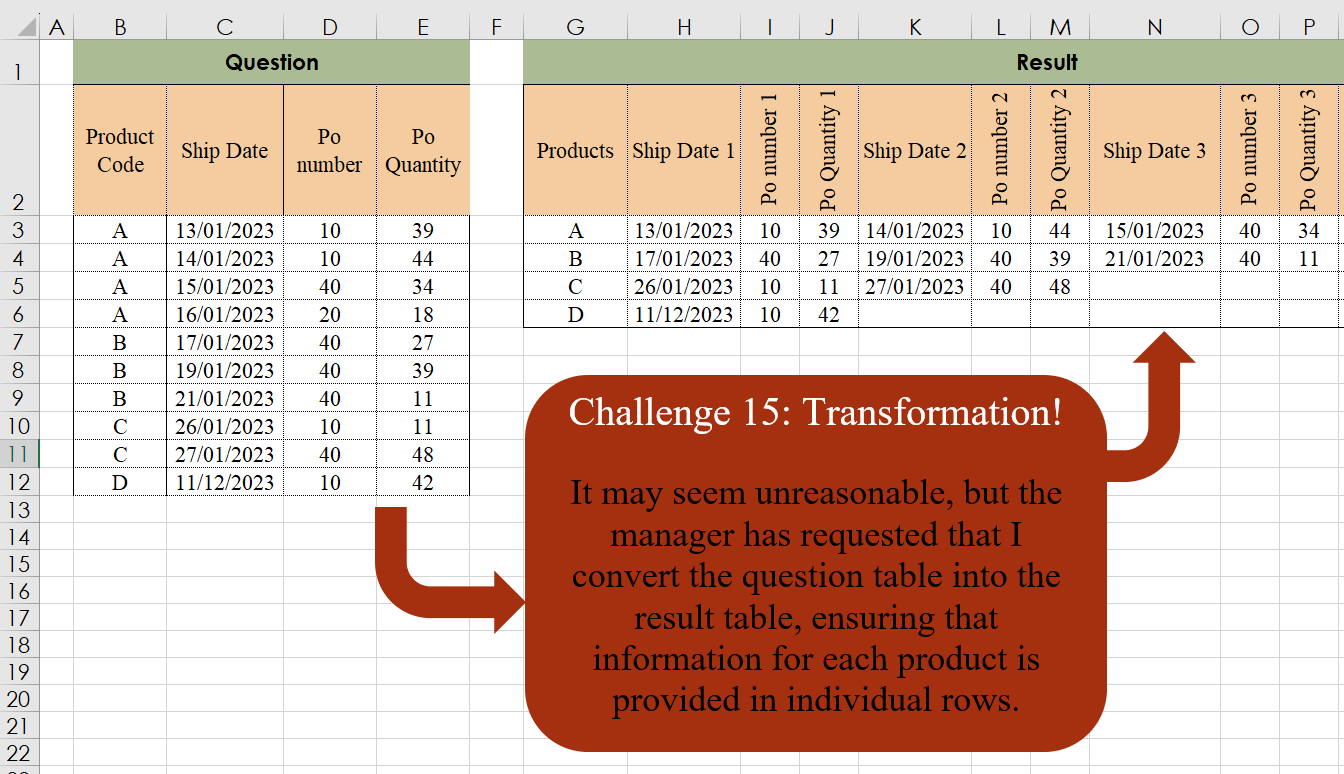
Challenge No. 15: It may seem unreasonable, but the manager has requested that I convert the question table into the result table, ensuring that information for each product is provided in individual rows.
Solved using:Excel, Power Query, and R.

Challenge No. 5: Determine how frequently products are bought together (same invoice number).
Solved using:Excel, and Power Query.
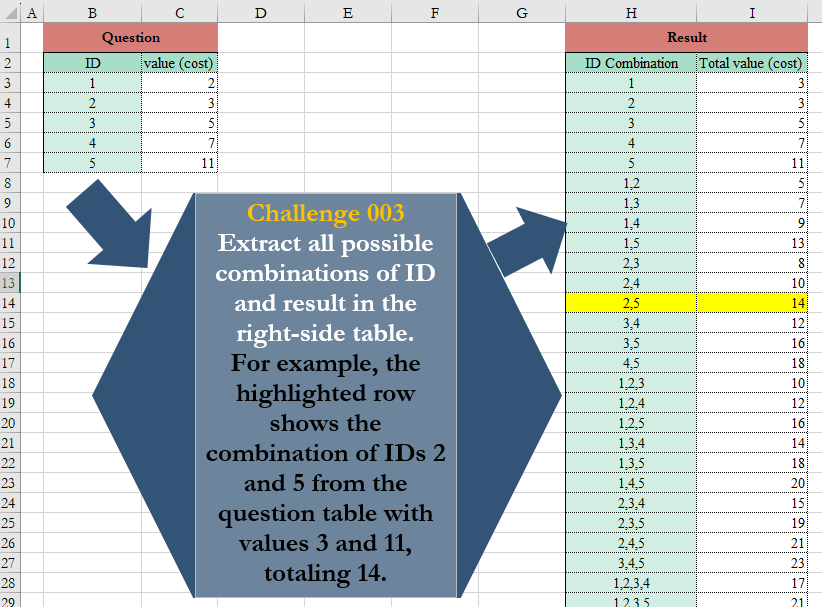
Challenge No. 3: Extract all possible combinations of ID and result in the right-side table.
Solved using:Excel (BYROW, COUNTA, DROP), Power Query (List.Transform), Python, and Python in Excel.
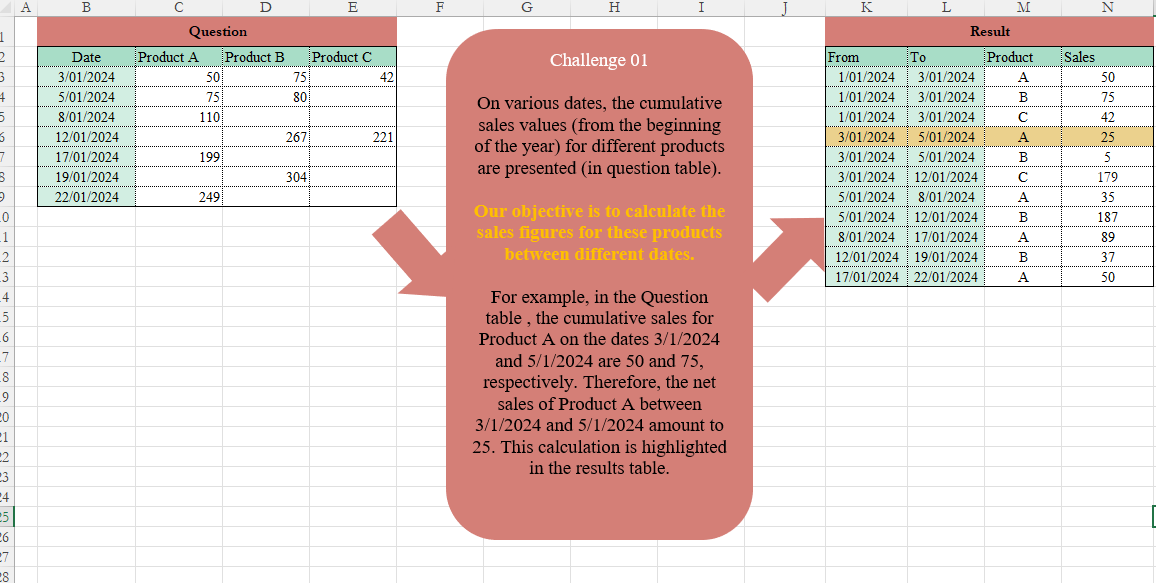
Challenge No. 1: On various dates, the cumulative sales values (from the beginning of the year) for different products are presented (in the Question table).
Solved using:Excel (DROP, FILTER, HSTACK), and Power Query (Table.AddColumn, Table.TransformColumnTypes).