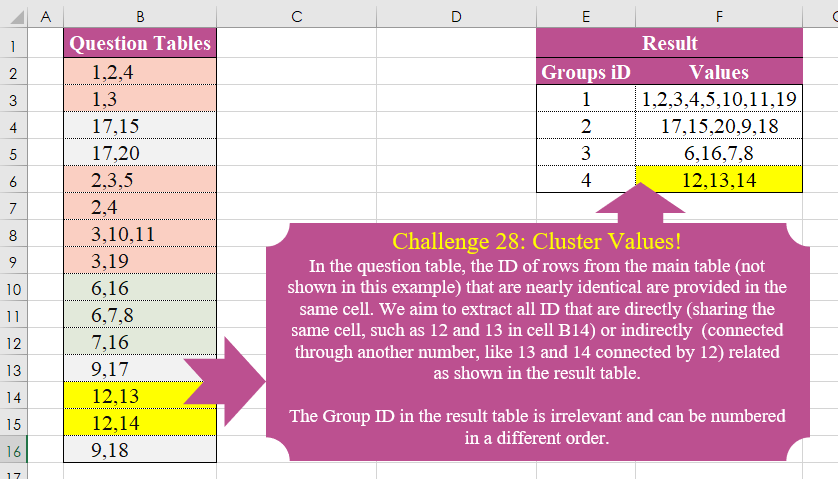
In the question table, the ID of rows from the main table (not shown in this example) that are nearly identical are provided in the same cell. We aim to extract all ID that are directly (sharing the same cell, such as 12 and 13 in cell B14) or indirectly (connected through another number, like 13 and 14 connected by 12) related as shown in the result table. The Group ID in the result table is irrelevant and can be numbered in a different order.
📌 Challenge Details and Links
Challenge Number: 28
Challenge Difficulty: ⭐⭐⭐⭐
📥Download Sample File
📥Link to the solutions on LinkedIn
Solving the challenge of Cluster Values! with Power Query
Power Query solution 1 for Cluster Values!, proposed by Omid Motamedisedeh:
let
  Source = Excel.CurrentWorkbook(){[Name = "Table1"]}[Content],
  S1 = List.Transform(Source[Question Tables], each Text.Split(_, ",")),
  FXX = (a) => if List.IsDistinct(List.Combine(a)) then a else @FXX(GX(a)),
  GX = (a) =>
    [
      x = a{0},
      y = List.Skip(a),
      z = List.Select(y, each List.ContainsAny(x, _)),
      q = List.Union({x, List.Union(z)}),
      w = List.Select(y, each not List.ContainsAny(x, _)),
      r = List.Combine({w, {List.Sort(q)}})
    ][r],
  Re = List.Transform(FXX(S1), each Text.Combine(_, ","))
in
  Re
Power Query solution 2 for Cluster Values!, proposed by Ramiro Ayala Chávez:
let
G = Table.Group,
T = Table.AddColumn,
N = List.RemoveNulls,
D = List.Distinct,
L = List.Transform,
S = Excel.CurrentWorkbook(){[Name="Table1"]}[Content],
a = Table.SplitColumn(S,"Question Tables",Splitter.SplitTextByDelimiter(","),{"Q1","Q2","Q3"}),
b = G(a,{"Q1"},{"G", each D(N([Q1]&[Q2]&[Q3]))}),
c = Table.NestedJoin(Table.ExpandListColumn(b,"G"),{"G"},a,{"Q1"},"N"),
d = Table.ExpandTableColumn(c,"N",{"Q1","Q2","Q3"},{"N1","N2","N3"}),
e = G(d,{"Q1"},{"Values", each List.Sort(L(D(N([N1]&[N2]&[N3])),Number.From))})[[Values]],
f = Table.TransformColumns(e,{"Values", each Text.Combine(L(_,Text.From),",")}),
g = T(f,"D", each Text.AfterDelimiter([Values],",",{0,RelativePosition.FromEnd})),
h = T(g,"L", each Text.Length([Values])),
i = G(h,{"D"},{"H", each Table.MaxN(_,"L",1)})[[H]],
Sol = Table.SelectColumns(Table.AddIndexColumn(Table.Combine(i[H])[[Values]],"Groups iD",1),{"Groups iD","Values"})
in
Sol
Power Query solution 3 for Cluster Values!, proposed by Glyn Willis:
let
  Source = Excel.CurrentWorkbook(){[Name = "Table2"]}[Content],
  #"Changed Type" = Table.TransformColumnTypes(Source, {{"Question Tables", type text}}),
  #"Cleaned Text" = Table.TransformColumns(
    #"Changed Type",
    {{"Question Tables", each List.Transform(Text.Split(_, ","), (x) => Int64.From(x)), type text}}
  ),
  #"Added Custom" = Table.AddColumn(
    #"Cleaned Text",
    "Custom",
    each List.Min(
      List.Union(
        List.Transform(
          List.Transform([Question Tables], (z) => Int64.From(z)),
          (x) =>
            List.Combine(List.Select(#"Cleaned Text"[Question Tables], (y) => List.Contains(y, x)))
        )
      )
    )
  ),
  #"Grouped Rows" = Table.Group(
    #"Added Custom",
    {"Custom"},
    {
      {
        "Numbers",
        each Text.Combine(List.Transform(List.Union([Question Tables]), (x) => Text.From(x)), ","),
        type text
      }
    }
  )
in
  #"Grouped Rows"
Solving the challenge of Cluster Values! with Excel
Excel solution 1 for Cluster Values!, proposed by Bo Rydobon 🇹🇭:
=LET(
    h,
    MAP(
        DROP(
            REDUCE(
                "",
                B2:B16,
                LAMBDA(
                    a,
                    v,
                    LET(
                        w,
                        TEXTSPLIT(
                            v,
                            ,
                            ","
                        ),
                        m,
                        MAP(
                            a,
                            LAMBDA(
                                b,
                                b&IF(
                                    COUNT(
                                        XMATCH(
                                            w,
                                            TEXTSPLIT(
                                                b,
                                                ,
                                                ","
                                            )
                                        )
                                    ),
                                    ","&v,
                                    ""
                                )
                            )
                        ),

                        x,
                        EXPAND(
                            m,
                            ROWS(
                                m
                            )+AND(
                                m=a
                            ),
                            ,
                            v
                        ),
                        x
                    )
                )
            ),
            1
        ),
        LAMBDA(
            x,
            TEXTJOIN(
                ",",
                ,
                UNIQUE(
                    TEXTSPLIT(
                        x,
                        ,
                        ","
                    )
                )
            )
        )
    ),
    HSTACK(
        SEQUENCE(
            ROWS(
                h
            )
        ),
        h
    )
)
Excel solution 2 for Cluster Values!, proposed by Kris Jaganah:
=LET(k,
    B2:B16,
    l,
    TEXTSPLIT(
        CONCAT(
            k&"#"
        ),
        ",",
        "#",
        1,
        ,
        ""
    ),
    m,
    COLUMNS(
        l
    ),
    n,
    INT(
        TOCOL(
            SEQUENCE(
                ROWS(
        l
    ),
                m,
                ,
                1/m
            )
        )
    ),
    o,
    TOCOL(
        --l,
        3
    ),
    p,
    FILTER(
        n,
        -ISERR(
            TOCOL(
                -l
            )
        )=0
    ),
    q,
    UNIQUE(BYROW(k,
    LAMBDA(u,
    ARRAYTOTEXT(REDUCE(--TEXTSPLIT(
        u,
        ","
    ),
    SEQUENCE(
        3
    ),
    LAMBDA(x,
    y,
    LET(a,
    UNIQUE(
        DROP(
            REDUCE(
                "",
                x,
                LAMBDA(
                    x,
                    y,
                    VSTACK(
                        x,
                        FILTER(
                            p,
                            o=y
                        )
                    )
                )
            ),
            1
        )
    ),
    SORT(UNIQUE(DROP(REDUCE("",
    a,
    LAMBDA(x,
    y,
    VSTACK(x,
    FILTER(o,
    (p=y)*(o<>""))))),
    1)))))))))),
    VSTACK(
        {"Groups Id",
        "Values"},
        HSTACK(
            XMATCH(
                q,
                q
            ),
            q
        )
    ))
Excel solution 3 for Cluster Values!, proposed by John Jairo Vergara Domínguez:
=LET(
    s,
    ",",
    r,
    B2:B16,
    b,
    MAP(
        r,
        LAMBDA(
            x,
            MIN(
                MATCH(
                    "*,"&TEXTSPLIT(
                        x,
                        s
                    )&",*",
                    s&B1:x&s,

                )
            )-1
        )
    ),
    GROUPBY(
        INDEX(
            b,
            b
        ),
        r,
        LAMBDA(
            x,
            ARRAYTOTEXT(
                UNIQUE(
                    TEXTSPLIT(
                        TEXTJOIN(
                            s,
                            ,
                            x
                        ),
                        ,
                        s
                    )
                )
            )
        ),
        ,
        0
    )
)
Excel solution 4 for Cluster Values!, proposed by Sunny Baggu:
=LET(   _tb,
   TEXTBEFORE(
     B2:B16,
      ","
   ),   _utb,
   UNIQUE(
     _tb
   ),   _cri,
   MAP(
     _utb,
      LAMBDA(
        a,
         ROWS(
           FILTER(
             _tb,
              _tb = a
           )
         )
      )
   ),   _c1,
   FILTER(
     _utb,
      _cri > 1
   ),   _tbl,
   DROP(
     REDUCE(
       "",
        B2:B16,
        LAMBDA(
          a,
           v,
           VSTACK(
             a,
              TEXTSPLIT(
                v,
                 ","
              )
           )
        )
     ),
      1
   ),   _rng,
   DROP(
     REDUCE(
       "",
        _c1,
        LAMBDA(
          a,
           v,
           VSTACK(
             a,
              SORT(
                UNIQUE(
                  TOROW(
                    FILTER(
                      _tbl,
                       BYROW(
                         IFNA(
                           _tbl = v,
                            FALSE
                         ),
                          LAMBDA(
                            b,
                             OR(
                               b
                             )
                          )
                       )
                    ),
                     3
                  ),
                   1
                ),
                 ,
                 ,
                 1
              )
           )
        )
     ),
      1
   ),   UNIQUE(      DROP(         REDUCE(

            "",

            SEQUENCE(
              ROWS(
                _rng
              )
            ),

            LAMBDA(
              e,
               f,

               VSTACK(

                  e,

                  ARRAYTOTEXT(

                     SORT(

                        UNIQUE(

                           TOCOL(
                             DROP(
                               REDUCE(
                                 "",
                                  TOROW(
                                    INDEX(
                                      _rng,
                                       f,

                                    ),
                                     3
                                  ),
                                  LAMBDA(
                                    x,
                                     y,
                                     VSTACK(
                                       x,
                                        UNIQUE(
                                          TOROW(
                                            FILTER(
                                              _tbl,
                                               BYROW(
                                                 IFNA(
                                                   _tbl = y,
                                                    FALSE
                                                 ),
                                                  LAMBDA(
                                                    a,
                                                     OR(
                                                       a
                                                     )
                                                  )
                                               )
                                            ),
                                             3
                                          ),
                                           1
                                        )
                                     )
                                  )
                               ),
                                1
                             ),
                              3
                           )

                        ) + 0

                     )

                  )

               )

            )

         ),         1      )   ))
Excel solution 5 for Cluster Values!, proposed by Alexandra Popoff:
= LAMBDA(
    z_ID,
    z_Val,
    [Opt_Sep],    LET(        z_Sep,
         if(
             ISOMITTED(
                 Opt_Sep
             ),
             ",",
             Opt_Sep
         ),        z_ID_Sort,
         SORT(
             UNIQUE(
                 z_ID
             )
         ),        HSTACK(

            z_ID_Sort,

            BYROW(
                z_ID_Sort,
                LAMBDA(
                    z_i,

                    TEXTJOIN(
                        ",",
                        TRUE,

                        SORT(
                            UNIQUE(
                                VALUE(

                                     TEXTSPLIT(

                                          TEXTJOIN(
                                              z_Sep,
                                              TRUE,
                                              FILTER(
                                                  z_val,
                                                   z_ID = z_i
                                              )
                                          ),

                                          ,
                                         z_Sep
                                     )

                                )
                            )
                        )
                    )
                )
            )

        )
    )
)
Excel solution 6 for Cluster Values!, proposed by Josh Brodrick:
=LET(
    array,
    MAP(
        A1:A16,
        LAMBDA(
            a,
            TEXTJOIN(
                ",",
                TRUE,
                MAP(
                    A1:A16,
                    LAMBDA(
                        y,
                        TEXTJOIN(
                            ",",
                            TRUE,
                            ,
                            MAP(
                                TEXTSPLIT(
                                    y,
                                    ","
                                ),
                                LAMBDA(
                                    x,
                                    IFNA(
                                        IF(
                                            MATCH(
                                                x,
                                                TEXTSPLIT(
                                                    a,
                                                    ","
                                                ),
                                                0
                                            ),
                                            INDEX(
                                                A1:A16,
                                                ROW(
                                                    y
                                                )
                                            ),
                                            ""
                                        ),
                                        ""
                                    )
                                )
                            )
                        )
                    )
                )
            )
        )
    ),
    lookup,
    TEXTBEFORE(
        array,
        ","
    ),
    table,
    DROP(
        HSTACK(
            lookup,
            array
        ),
        1
    ),
    values,
    MAP(
        UNIQUE(
            CHOOSECOLS(
                table,
                1
            )
        ),
        LAMBDA(
            h,
            SORT(
                TEXTJOIN(
                    ",",
                    ,
                    TOROW(
                        UNIQUE(
                            TEXTSPLIT(
                                TEXTJOIN(
                                    ",",
                                    TRUE,
                                    CHOOSECOLS(
                                        FILTER(
                                            table,
                                            CHOOSECOLS(
                table,
                1
            )=h
                                        ),
                                        2
                                    )
                                ),
                                ,
                                ","
                            )
                        )
                    )
                )
            )
        )
    ),
    DROP(
        VSTACK(
            {"Groups iD",
            "Values"},
            HSTACK(
                TOCOL(
                    {1,
                    2,
                    3,
                    4}
                ),
                values
            )
        ),
        -1
    )
)
Excel solution 7 for Cluster Values!, proposed by LUIS FLORENTINO COUTO CORTEGOSO:
=LET(
    s,
    REDUCE(
        ","&B2:B16&",",
        SEQUENCE(
            20
        ),
        LAMBDA(
            a,
            n,
            LET(
                qt,
                a,
                l,
                SEQUENCE(
                    ROWS(
                        qt
                    )
                ),
                fil,
                LAMBDA(
                    n,
                    TOCOL(
                        l/ISNUMBER(
                            SEARCH(
                                ","&n&",",
                                qt
                            )
                        ),
                        3
                    )
                ),
                val,
                CONCAT(
                    CHOOSEROWS(
                        qt,
                        fil(
                            n
                        )
                    )
                ),
                m,
                CHOOSEROWS(
                    qt,
                    TOCOL(
                        l/BYROW(
                            l-TOROW(
                                fil(
                            n
                        )
                            ),
                            AND
                        ),
                        3
                    )
                ),
                IF(
                    ROWS(
                        m
                    )=1,
                    qt,
                    VSTACK(
                        m,
                        val
                    )
                )
            )
        )
    ),
    Values,
    SORT(
        MAP(
            s,
            LAMBDA(
                f,
                TEXTJOIN(
                    ",",
                    ,
                    SORT(
                        UNIQUE(
                            --TEXTSPLIT(
                                f,
                                ,
                                ",",
                                1
                            )
                        )
                    )
                )
            )
        )
    ),
    VSTACK(
        HSTACK(
            "Groups ID",
            "Values"
        ),
        HSTACK(
            SEQUENCE(
                ROWS(
                    Values
                )
            ),
            Values
        )
    )
)
Solving the challenge of Cluster Values! with Python
Python solution 1 for Cluster Values!, proposed by Konrad Gryczan, PhD:
import pandas as pd
import numpy as np
import networkx as nx
import itertools
import matplotlib.pyplot as plt

input_df = pd.read_excel("files/CH-028 Cluster values.xlsx", usecols="B", skiprows=0, nrows=15)
test_df = pd.read_excel("files/CH-028 Cluster values.xlsx", usecols="E:F", skiprows=1, nrows=4)
test_df['Values'] = test_df['Values'].apply(lambda x: ','.join(map(str, sorted(map(int, x.split(','))))))
test = test_df['Values'].explode().tolist()

edges = input_df['Question Tables'].apply(lambda x: list(map(str.strip, x.split(',')))).explode().dropna()
combinations = edges.groupby(level=0).apply(lambda x: list(itertools.combinations(x, 2))).explode().tolist()
G = nx.Graph()
G.add_edges_from(combinations)
subgraphs = [sorted(map(str, sorted(map(int, x))), key=int) for x in nx.connected_components(G)]
subgraphs = [','.join(x) for x in subgraphs]

print(all(x in test for x in subgraphs)) # True
Solving the challenge of Cluster Values! with R
R solution 1 for Cluster Values!, proposed by Konrad Gryczan, PhD:
library(tidyverse)
library(readxl)
library(igraph)

input = read_excel("files/CH-028 Cluster values.xlsx", range = "B1:B16")
test = read_excel("files/CH-028 Cluster values.xlsx", range = "E2:F6") %>%
 mutate(Values = map(Values, ~strsplit(., ",") %>% unlist() %>% as.numeric() %>%
 sort() %>% paste(collapse = ","))) %>%
 select(Values) %>%
 pull()

edges <- input$`Question Tables` %>%
 strsplit(",") %>%
 map(~combn(.x, 2, simplify = TRUE) %>% t()) %>%
 do.call(rbind, .) %>%
 as.data.frame(stringsAsFactors = FALSE)

graph <- graph_from_data_frame(edges, directed = FALSE)
components <- components(graph)$membership

result <- unique(components) %>%
 map(~{
 ids <- names(components[components == .x])
 paste(sort(as.numeric(ids)), collapse = ",")
 })