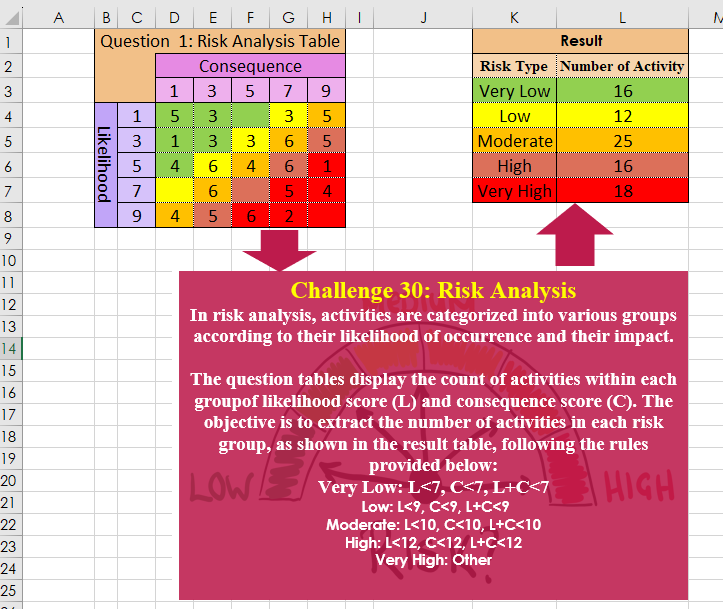
In risk analysis, activities are categorized into various groups according to their likelihood of occurrence and their impact. The question tables display the count of activities within each group of likelihood score (L) and consequence score (C). The objective is to extract the number of activities in each risk group, as shown in the result table, following the rules provided below: Very Low: L<7, C<7, L+C<7 Low: L<9, C<9, L+C<9 Moderate: L<10, C<10, L+C<10 High: L<12, C<12, L+C<12 Very High: Other
📌 Challenge Details and Links
Challenge Number: 30
Challenge Difficulty: ⭐⭐⭐
📥Download Sample File
📥Link to the solutions on LinkedIn
Solving the challenge of Risk Analysis with Power Query
Power Query solution 1 for Risk Analysis, proposed by Ramiro Ayala Chávez:
let
Source = Excel.CurrentWorkbook(){[Name="Table1"]}[Content],
L =List.Transform,
S = List.Sum,
SE = List.Select,
a = List.Combine(Table.ToRows(Source)),
b = Table.FromColumns({List.Generate(()=>[i=1,j=1], each [i]<=5, each if [j]=5 then [i=[i]+1,j=1] else [i=[i],j=[j]+1], each Text.From([i])&Text.From([j]))}),
c = Table.SplitColumn(b,"Column1", Splitter.SplitTextByRepeatedLengths(1),{"A","B"}),
d = L(List.Zip({c[A],c[B],a}), each L(_,Number.From)),
e1 = S(L(SE(d, each _{0}+_{1}<=4), each _{2})),
e2 = S(L(SE(d, each _{0}+_{1}=5), each _{2})),
e3 = S(L(SE(d, each _{0}+_{1}=6), each _{2})),
e4 = S(L(SE(d, each _{0}+_{1}=7), each _{2})),
e5 = S(L(SE(d, each _{0}+_{1}>=8), each _{2})),
f = Table.FromColumns({{"Very Low","Low","Moderate","High","Very High"},{e1}&{e2}&{e3}&{e4}&{e5}}),
Sol = Table.RenameColumns(f,{{"Column1","Risk Type"},{"Column2","Number of Activity"}})
in
Sol
Power Query solution 2 for Risk Analysis, proposed by Aditya Kumar Darak 🇮🇳:
let
 Source = Excel.CurrentWorkbook(){[ Name = "data" ]}[Content], // data = C4:H8 with headers on
 Lookup =
hashtag
#table (
 null,
 { { "Very Low", 7 }, { "Low", 9 }, { "Moderate", 10 }, { "High", 12 } }
 ),
 Unpivot = Table.UnpivotOtherColumns ( Source, { "Column1" }, "Column", "Value" ),
 Type  = Table.TransformColumnTypes ( Unpivot, { "Column", Int64.Type } ),
 Risk  = Table.AddColumn (
 Type,
 "Risk Type",
 each Table.SelectRows ( Lookup, ( f ) => f[Column2] >= [Column1] + [Column] )[Column1]{0}?
 ?? "Very High"
 ),
 Return = Table.Group ( Risk, "Risk Type", { "No of Activity", each List.Sum ( [Value] ) } )
in
 Return
Power Query solution 3 for Risk Analysis, proposed by Glyn Willis:
let
  cj = Table.AddColumn(
    Table.ExpandListColumn(
      Table.FromRows(List.Transform({1, 3, 5, 7, 9}, (x) => {x, {1, 3, 5, 7, 9}}), {"c", "r"}),
      "r"
    ),
    "c+r",
    (y) => y[c] + y[r]
  ),
  Source = Table.Buffer(
    Table.Sort(
      Excel.CurrentWorkbook(){[Name = "Table1"]}[Content]
        & #table({"Column1"}, {{2}, {4}, {6}, {8}}),
      {"Column1"}
    )
  ),
  Custom1 = Table.FromList(
    {"Very Low", "Low", "Moderate", "High", "Very High"},
    Splitter.SplitByNothing(),
    {"Risk Type"}
  ),
  Custom2 = Custom1,
  #"Added Custom" = Table.AddColumn(
    Custom2,
    "Custom",
    each
      let
        fxSlct = (GT, LT) =>
          Table.TransformColumns(
            Table.SelectRows(
              cj,
              (x) =>
                let
                  r = x[#"c+r"]
                in
                  r >= GT and r <= LT
            ),
            {{"c", Text.From}}
          )[[c], [r]],
        rt = [Risk Type],
        tbl =
          if rt = "Very Low" then
            fxSlct(0, 6)
          else if rt = "Low" then
            fxSlct(8, 8)
          else if rt = "Moderate" then
            fxSlct(10, 10)
          else if rt = "High" then
            fxSlct(12, 12)
          else if rt = "Very High" then
            fxSlct(13, 18)
          else
            null,
        values = Table.AddColumn(
          tbl,
          "Number of Activity",
          (x) => Record.Field(Source{x[r] - 1}, x[c])
        )
      in
        List.Sum(values[Number of Activity])
  )
in
  #"Added Custom"
Solving the challenge of Risk Analysis with Excel
Excel solution 1 for Risk Analysis, proposed by Bo Rydobon 🇹🇭:
=HSTACK(
    K3:K7,
    DROP(
        GROUPBY(
            TOCOL(
                MATCH(
                    D3:H3+C4:C8,
                    {0,
                    7,
                    9,
                    11,
                    13}
                )
            ),
            TOCOL(
                D4:H8
            ),
            SUM,
            0,
            0
        ),
        ,
        1
    )
)
Excel solution 2 for Risk Analysis, proposed by Oscar Mendez Roca Farell:
=LET(
    F,
     LAMBDA(
         i,
          SUM(
              IFS(
                  C4:C8+D3:H3<=i,
                   D4:H8,
                   1,
                   0
              )
          )
     ),
     m,
     MAP(
         {0;7;9;10;12;18},
          LAMBDA(
              x,
               F(
                   x
               )
          )
     ),
     HSTACK(
         VSTACK(
             "Very Low",
              "Low",
              "Moderate",
              "High",
              "Very High"
         ),
          DROP(
              m,
               1
          )-DROP(
              m,
               -1
          )
     )
)
Excel solution 3 for Risk Analysis, proposed by Julian Poeltl:
=LET(Q,
    D4:H8,
    LC,
    MAKEARRAY(5,
    5,
    LAMBDA(A,
    B,
    (A*2-1+B*2-1)-1)),
    VL,
    SUM(Q*(LC<7)),
    L,
    SUM(Q*(LC<9)*(LC>6)),
    M,
    SUM(Q*(LC<10)*(LC>8)),
    H,
    SUM(Q*(LC<12)*(LC>9)),
    VH,
    SUM(Q*(LC>11)),
    HSTACK(
        VSTACK(
            "Risk Type",
            "Very Low",
            "Low",
            "Moderate",
            "High",
            "Very High"
        ),
        VSTACK(
            "Number of Activity",
            VL,
            L,
            M,
            H,
            VH
        )
    ))
Excel solution 4 for Risk Analysis, proposed by Kris Jaganah:
=LET(a,C4:C8,b,D3:H3,c,D4:H8,d,MAP({7;9;12;14;17},LAMBDA(x,SUM(((a<x)*(b<x)*((a+b)<x))*c))),HSTACK({"Very Low";"Low";"Moderate";"High";"Very High"},d-VSTACK(0,DROP(d,-1))))Excel solution 5 for Risk Analysis, proposed by John Jairo Vergara Domínguez:
=LET(b,C4:C8+D3:H3,HSTACK(K3:K7,MAP({1;7;9;11;13},Excel solution 6 for Risk Analysis, proposed by Sunny Baggu:
=LET(
 _v,
     MAP(
 {8; 10; 11; 13; 100}, LAMBDA(a, SUM(((C4:C8 < a) * (D3:H3 < a) * ((C4:C8 + D3:H3) < a)) * D4:H8)
 )
 ), VSTACK(
     TAKE(
         _v,
          1
     ),
      DROP(
         _v,
          1
     ) - DROP(
         _v,
          -1
     )
 )
)
Excel solution 7 for Risk Analysis, proposed by Charles Roldan:
=VSTACK(K2:L2,HSTACK(K3:K7,MAP({1;
    2;
    3;
    4;
    5},LAMBDA(x,SUM(D4:H8*(MATCH(
        C4:C8+D3:H3,{2;
        8;
        10;
        12;
        14}
    )=x))))))
Excel solution 8 for Risk Analysis, proposed by Hussein SATOUR:
=LET(a,
    C4:C8&D3:H3,
    b,
    TOCOL(
        LEFT(
            a
        )+RIGHT(
            a
        )
    ),
    c,
    {"Very Low";"Low";"Moderate";"High";"Very High"},
    d,
    {7;9;10;12;20},
    HSTACK(c,
    MAP(d,
    VSTACK(
        0,
        DROP(
            d,
            -1
        )
    ),
    LAMBDA(x,
    y,
    SUM(FILTER(TOCOL(
        D4:H8
    ),
    (b<=x)*(b>y)))))))
Excel solution 9 for Risk Analysis, proposed by Nicolas Micot:
=SUM(
    IF(
        $D$10:$H$14=K3;
        $D$4:$H$8;
        0
    )
)
Excel solution 10 for Risk Analysis, proposed by Pieter de B.:
=LET(
    a,
    D4:H8,
    m,
    {1,
    2,
    3,
    4,
    5}+{1;2;3;4;5},
    z,
    LAMBDA(
        x,
        SUM(
            x*a
        )
    ),
    VSTACK(
        z(
            m<5
        ),
        z(
            m=5
        ),
        z(
            m=6
        ),
        z(
            m=7
        ),
        z(
            m>7
        )
    )
)
Excel solution 11 for Risk Analysis, proposed by Pieter de B.:
=LET(
    a,
    D4:H8,
    m,
    MAKEARRAY(
        5,
        5,
        LAMBDA(
            r,
            c,
            r+c
        )
    ),
    z,
    LAMBDA(
        x,
        SUM(
            x*a
        )
    ),
    VSTACK(
        z(
            m<5
        ),
        z(
            m=5
        ),
        z(
            m=6
        ),
        z(
            m=7
        ),
        z(
            m>7
        )
    )
)
Excel solution 12 for Risk Analysis, proposed by Rick Rothstein:
=LET(cc,C4:C8,dh,D3:H3,ac,D4:H8,s,SCAN(0,{7;9;11;13;19},LAMBDA(a,x,SUM((cc<x)*(dh<x)*(cc+dh<x)*ac))),DROP(s-VSTACK(0,s),-1))Solving the challenge of Risk Analysis with Python
Python solution 1 for Risk Analysis, proposed by Konrad Gryczan, PhD:
import pandas as pd

test = pd.read_excel("CH-30-Risk Analysis.xlsx", usecols="K:L", skiprows=1, nrows=5)

input = pd.read_excel("CH-30-Risk Analysis.xlsx", usecols="C:H", skiprows=2)
input.rename(columns={input.columns[0]: "LH"}, inplace=True)
input = input.melt(id_vars=["LH"], var_name="Cons", value_name="count").dropna()
input['count'] = input['count'].astype(int)

def classify_risk(row):
 L, C = row['LH'], row['Cons']
 if L < 7 and C < 7 and (L + C) < 7:
 return "Very Low"
 elif L < 9 and C < 9 and (L + C) < 9:
 return "Low"
 elif L < 11 and C < 11 and (L + C) < 11:
 return "Moderate"
 elif L < 13 and C < 13 and (L + C) < 13:
 return "High"
 else:
 return "Very High"

input['Risk'] = input.apply(classify_risk, axis=1)
input = input.groupby('Risk').agg({'count': 'sum'}).reset_index()
input['Risk'] = pd.Categorical(input['Risk'], categories=["Very Low", "Low", "Moderate", "High", "Very High"], ordered=True)
input.sort_values('Risk', inplace=True)
input.reset_index(drop=True, inplace=True)
input.columns = test.columns

print(input == test) # All True
Solving the challenge of Risk Analysis with R
R solution 1 for Risk Analysis, proposed by Konrad Gryczan, PhD:
library(tidyverse)
library(readxl)

input = read_excel("files/CH-30-Risk Analysis.xlsx", range = "C3:H8")
test = read_excel("files/CH-30-Risk Analysis.xlsx", range = "K2:l7")

classify_risk <- function(L, C) {
 if (L < 7 & C < 7 & (L + C) < 7) {
 "Very Low"
 } else if (L < 9 & C < 9 & (L + C) < 9) {
 "Low"
 } else if (L < 11 & C < 11 & (L + C) < 11) {
 "Moderate"
 } else if (L < 13 & C < 13 & (L + C) < 13) {
 "High"
 } else {
 "Very High"
 }
}

result = input %>%
 select(Lh = 1, everything()) %>%
 pivot_longer(-Lh, names_to = "Cons", values_to = "count") %>%
 mutate(Cons = as.numeric(Cons)) %>%
 mutate(`Risk Type` = map2_chr(Lh, Cons, classify_risk)) %>%
 na.omit() %>%
 summarise(`Number of Activity` = sum(count), .by = `Risk Type`)