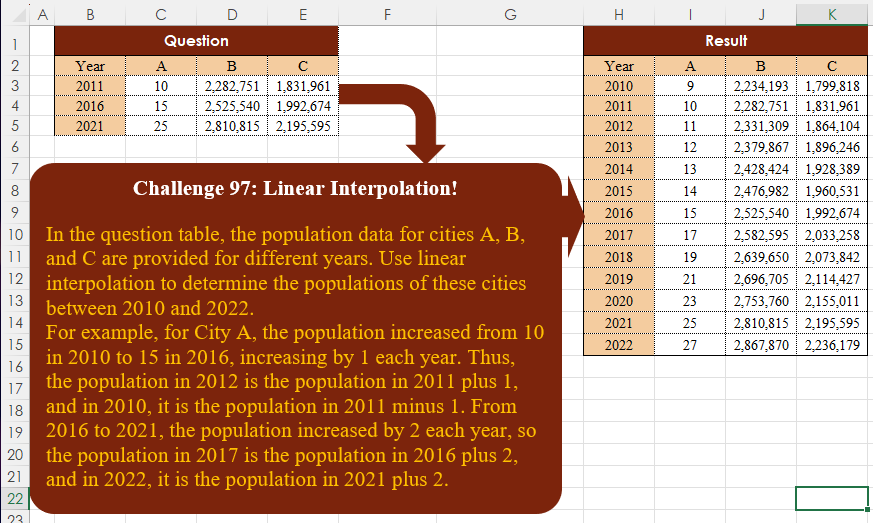
In the question table, the population data for cities A, B, and C are provided for different years. Use linear interpolation to determine the populations of these cities between 2010 and 2022. For example, for City A, the population increased from 10 in 2010 to 15 in 2016, increasing by 1 each year. Thus, the population in 2012 is the population in 2011 plus 1, and in 2010, it is the population in 2011 minus 1. From 2016 to 2021, the population increased by 2 each year, so the population in 2017 is the population in 2016 plus 2, and in 2022, it is the population in 2021 plus 2.
📌 Challenge Details and Links
Challenge Number: 97
Challenge Difficulty: ⭐⭐⭐⭐
📥Download Sample File
📥Link to the solutions on LinkedIn
Solving the challenge of Linear Interpolation! with Power Query
Power Query solution 1 for Linear Interpolation!, proposed by Zoran Milokanović:
let
  Source = Excel.CurrentWorkbook(){[Name = "Input"]}[Content],
  R = Table.ToRows(Source),
  S = Table.FromRows(
    List.TransformMany(
      R,
      each
        let
          n = (d) => List.PositionOf(R, _) + d,
          f = (l, m, d) =>
            List.Transform(
              List.Positions(l),
              (p) => l{p} + m * (R{n(d)}{p} - l{p}) / (R{n(d)}{0} - l{0})
            )
        in
          {
            {_, f(_, 1, - 1)},
            {{}, {f(_, - 1, 1)}}{Byte.From(_ = List.First(R))}
              & List.TransformMany({0 .. R{n(1)}{0} - _{0} - 1}, (i) => {_}, (i, o) => f(o, i, 1))
          }{Byte.From(_ <> List.Last(R))},
      (i, _) => _
    ),
    Table.ColumnNames(Source)
  )
in
  S
Power Query solution 2 for Linear Interpolation!, proposed by 🇮🇷 Navid Esmaeilzadeh اسماعیل زاده:
let
S=Excel.CurrentWorkbook(){[Name="Table1"]}[Content],
A=Table.FromColumns({{2010..2016}},{"Year"}),
B=Table.NestedJoin(A,{"Year"},S,{"Year"},"N"),
C=Table.ExpandTableColumn(B, "N", {"A", "B", "C"}, {"A", "B", "C"}),
D=Table.Sort(C,{{"Year", Order.Descending}}),
E=Table.AddIndexColumn(D, "I", 0, 1, Int64.Type),
F=Table.AddColumn(E, "Tbl", each Table.FromColumns( List.Zip(List.Split(let
A=List.Max(E[A])-[I]*(List.Max(E[A])-List.Min(E[A]))/(List.Count(E[A])-2),
B=List.Max(E[B])-[I]*(List.Max(E[B])-List.Min(E[B]))/(List.Count(E[B])-2),
C=List.Max(E[C])-[I]*(List.Max(E[C])-List.Min(E[C]))/(List.Count(E[C])-2),
D={A,B,C}
in D,3)),{"A","B","C"})),
G=Table.SelectColumns(F,{"Year", "Tbl"}),
Tbl1=Table.ExpandTableColumn(G, "Tbl", {"A", "B", "C"}, {"A", "B", "C"}),
a=Table.FromColumns({{2016..2022}},{"Year"}),
b=Table.NestedJoin(a,{"Year"},S,{"Year"},"N"),
c=Table.ExpandTableColumn(b, "N", {"A", "B", "C"}, {"A", "B", "C"}),
d=Table.Sort(c,{{"Year", Order.Ascending}}),
e=Table.AddIndexColumn(d, "I", 0, 1, Int64.Type),
f=Table.AddColumn(e, "Tbl", each Table.FromColumns( List.Zip(List.Split(let
Solving the challenge of Linear Interpolation! with Excel
Excel solution 1 for Linear Interpolation!, proposed by Bo Rydobon 🇹🇭:
=LET(
    y,
    B3:B5,
    s,
    SEQUENCE(
        13,
        ,
        2010
    ),
    REDUCE(
        s,
        C3:E3,
        LAMBDA(
            a,
            c,
            HSTACK(
                a,
                MAP(
                    s,
                    LAMBDA(
                        w,
                        LET(
                            n,
                            MATCH(
                                MEDIAN(
                                    w,
                                    y
                                ),
                                y
                            )+{0;1},
                            TREND(
                                INDEX(
                                    E5:c,
                                    n,
                                    1
                                ),
                                INDEX(
                                    y,
                                    n
                                ),
                                w
                            )
                        )
                    )
                )
            )
        )
    )
)
Excel solution 2 for Linear Interpolation!, proposed by 🇰🇷 Taeyong Shin:
=LET(
    y,
    B3:B5,
    s,
    SEQUENCE(
        13,
        ,
        2010
    ),
    MAP(
        s+{0,
        0,
        0,
        0},
        {0,
        1,
        2,
        3}*SIGN(
            s
        ),
        LAMBDA(
            x,
            c,
            LET(
                r,
                XMATCH(
                    MEDIAN(
                        x,
                        y
                    ),
                    y,
                    {-1;1}
                ),
                IF(
                    c,
                    TREND(
                        INDEX(
                            C3:E5,
                            r,
                            c
                        ),
                        INDEX(
                            y,
                            r
                        ),
                        x
                    ),
                    x
                )
            )
        )
    )
)
Excel solution 3 for Linear Interpolation!, proposed by محمد حلمي:
=ROUND(DROP(REDUCE(C3:E3,
    SEQUENCE(
        13
    )+2009,LAMBDA(a,
    v,
    LET(i,
    TAKE(
        a,
        -1,
        -3
    ),VSTACK(a,
    HSTACK(v,
    IFNA(XLOOKUP(
        v,
        B3:B5,
        C3:E5
    ),IF(vB5,
    (v-B5)*((C5:E5-C4:E4)/(B5-B4)),XLOOKUP(v,
    B4:B5,
    (C4:E5-C3:E4)/(B4:B5-B3:B4),
    0,
    1))))))))),
    1),
    )
Excel solution 4 for Linear Interpolation!, proposed by Oscar Mendez Roca Farell:
=LET(
    d,
     C3:E5,
     y,
     B3:B5,
     REDUCE(
         H3:H15,
          C2:E2,
          LAMBDA(
              i,
               x,
               LET(
                   F,
                    LAMBDA(
                        a,
                         b,
                         TREN(
                             INDEX(
                                 d,
                                  a,
                                  XMATCH(
                                      x,
                                       C2:E2
                                  )
                             ),
                              INDEX(
                                  y,
                                   a
                              ),
                              b
                         )
                    ),
                    HSTACK(
                        i,
                         ROUND(
                             VSTACK(
                                 F(
                                     {1; 2},
                                      H3:H9
                                 ),
                                  F(
                                      {2; 3},
                                       H10:H15
                                  )
                             ),

                         )
                    )
               )
          )
     )
)
Excel solution 5 for Linear Interpolation!, proposed by Julian Poeltl:
=LET(
    SY,
    2010,
    T,
    B2:E5,
    Y,
    DROP(
        TAKE(
            T,
            3,
            1
        ),
        1
    )+1,
    H,
    TAKE(
        T,
        1
    ),
    D,
    TAKE(
        DROP(
            DROP(
                T,
                2
            )-DROP(
        T,
        1
    ),
            -1
        ),
        -2
    ),
    A,
    TAKE(
        D,
        ,
        -3
    )/TAKE(
        D,
        ,
        1
    ),
    S,
    SEQUENCE(
        13
    )+SY-1,
    R,
    DROP(
        REDUCE(
            0,
            S,
            LAMBDA(
                B,
                C,
                VSTACK(
                    B,
                    XLOOKUP(
                        C,
                        Y,
                        A,
                        XLOOKUP(
                            C,
                            Y,
                            A,
                            ,
                            1
                        ),
                        -1
                    )
                )
            )
        ),
        1
    ),
    St,
    XLOOKUP(
        SY,
        Y,
        DROP(
            TAKE(
                T,
                -3,
                -3
            ),
            -1
        ),
        ,
        1
    )-BYCOL(
        TAKE(
            R,
            XLOOKUP(
                SY,
                Y,
                DROP(
                    TAKE(
                        T,
                        -3,
                        1
                    ),
                    -1
                ),
                ,
                1
            )-SY+1
        ),
        LAMBDA(
            A,
            SUM(
                A
            )
        )
    ),
    VSTACK(
        H,
        HSTACK(
            S,
            DROP(
                REDUCE(
                    0,
                    SEQUENCE(
                        3
                    ),
                    LAMBDA(
                        A,
                        B,
                        HSTACK(
                            A,
                            SCAN(
                                CHOOSECOLS(
                                    St,
                                    B
                                ),
                                CHOOSECOLS(
                                    R,
                                    B
                                ),
                                LAMBDA(
                                    A,
                                    B,
                                    A+B
                                )
                            )
                        )
                    )
                ),
                ,
                1
            )
        )
    )
)
Excel solution 6 for Linear Interpolation!, proposed by Kris Jaganah:
=VSTACK(B2:E2,
    REDUCE(B10:B22,
    C2:E2,
    LAMBDA(v,
    w,
    HSTACK(v,
    LET(a,
    B3:B5,
    b,
    B10:B22,
    c,
    XMATCH(
        b,
        a,
        1
    ),
    d,
    IFNA(
        c,
        MAX(
            TOCOL(
                c,
                3
            )
        )
    ),
    e,
    UNIQUE(
        d
    ),
    f,
    XLOOKUP(
        d-1,
        e,
        a,
        ,
        1
    ),
    g,
    XLOOKUP(
        f+1,
        a,
        a,
        ,
        1
    ),
    MAP(b,
    f,
    g,
    LAMBDA(x,
    y,
    z,
    LET(k,
    TOROW(FILTER(FILTER(
        C3:E5,
        C2:E2=w
    ),
    (a=y)+(a=z))),
    ROUND(
        FORECAST.LINEAR(
            x,
            k,
            HSTACK(
                y,
                z
            )
        ),
        0
    )))))))))
Excel solution 7 for Linear Interpolation!, proposed by Sunny Baggu:
=LET(     _y,
     B3:B5,     _a,
     C3:C5,     _b,
     D3:D5,     _c,
     E3:E5,     _s,
     SEQUENCE(
         2022 - 2010 + 1,
          ,
          2010
     ),     l,
     LAMBDA(
         arr,          MAP(

               _s,

               LAMBDA(
                   a,

                    TREND(

                         IF(
                             a <= B4,
                              TAKE(
                                  arr,
                                   2
                              ),
                              TAKE(
                                  arr,
                                   -2
                              )
                         ),

                         IF(
                             a <= B4,
                              TAKE(
                                  _y,
                                   2
                              ),
                              TAKE(
                                  _y,
                                   -2
                              )
                         ),

                         a

                    )

               )

          )     ),     VSTACK(
         B2:E2,
          HSTACK(
              _s,
               l(
                   _a
               ),
               l(
                   _b
               ),
               l(
                   _c
               )
          )
     ))
Excel solution 8 for Linear Interpolation!, proposed by Andy Heybruch:
=LET(_base,
    C3:E3,
    _mid,
    C4:E4,
    _end,
    C5:E5,_h1,
    (_mid-_base)/5,_h2,
    (_end-_mid)/5,_hdr,
    VSTACK(
        "Year",
        SEQUENCE(
            12,
            ,
            2010
        )
    ),HSTACK(_hdr,
    VSTACK(C2:E2,
    ROUND(_base+(_h1*SEQUENCE(
        7,
        ,
        -1
    )),
    0),
    ROUND(_mid+(_h2*SEQUENCE(
        5,
        ,
        1
    )),
    0))))
Excel solution 9 for Linear Interpolation!, proposed by Bilal Mahmoud kh.:
=HSTACK(SEQUENCE(
    13,
    ,
    2010
),
    LET(a,
    (VSTACK((B4:D4-B3:D3)/5,
    (B5:D5-B4:D4)/5)),
    b,
    REDUCE(
        B3:D3,
        SEQUENCE(
            13
        ),
        LAMBDA(
            x,
            y,
            IF(
                y=1,
                x-TAKE(
                    a,
                    1
                ),
                IF(
                    y<=7,
                    VSTACK(
                        x,
                        CHOOSEROWS(
                            x,
                            y-1
                        )+TAKE(
                    a,
                    1
                )
                    ),
                    VSTACK(
                        x,
                        CHOOSEROWS(
                            x,
                            y-1
                        )+DROP(
                    a,
                    1
                )
                    )
                )
            )
        )
    ),
    b))
Excel solution 10 for Linear Interpolation!, proposed by Eddy Wijaya:
=LET(
data,
    B3:E5,year,
    TAKE(
        data,
        ,
        1
    ),pop,
    DROP(
        data,
        ,
        1
    ),denom,
    BYROW(
        year,
        LAMBDA(
            r,
            r-OFFSET(
                r,
                -1,
                0
            )
        )
    ),nom,
    MAP(
        pop,
        LAMBDA(
            m,
            m-OFFSET(
                m,
                -1,
                0
            )
        )
    ),gradient,
    DROP(
        HSTACK(
            year-denom,
            nom/denom
        ),
        1
    ),dist,
    MEDIAN(
        year
    )-MIN(
        year
    ),listSeq,
    MAX(
        year
    )-MIN(
        year
    ),firstRow,
    TAKE(
        data,
        1
    )-HSTACK(
        1,
        DROP(
            gradient,
            -1,
            1
        )
    ),lastRow,
    TAKE(
        data,
        -1
    )+HSTACK(
        1,
        DROP(
            gradient,
            1,
            1
        )
    ),midseq,
    SEQUENCE(
        listSeq,
        ,
        MIN(
        year
    )+1
    ),multiplier,
    MOD(
        SEQUENCE(
            ROWS(
                midseq
            )
        ),
        dist
    ),midrow,
    ROUND(DROP(REDUCE(0,
    midseq,
    LAMBDA(a,
    v,
    VSTACK(a,LET(rate,
    XLOOKUP(
        v,
        TAKE(
            gradient,
            ,
            1
        ),
        DROP(
            gradient,
            ,
            1
        ),
        ,
        -1
    ),base,
    XLOOKUP(
        v,
        year,
        pop,
        ,
        -1
    ),increment,
    XLOOKUP(
        v,
        midseq,
        multiplier
    ),base+(rate*increment))))),
    1),
    0),VSTACK(
    firstRow,    TAKE(
        data,
        1
    ),    HSTACK(
        midseq,
        midrow
    ),    lastRow
))
Excel solution 11 for Linear Interpolation!, proposed by LEONARD OCHEA 🇷🇴:
=LET(
    y,
    B3:B5,
    a,
    C3:C5,
    b,
    D3:D5,
    c,
    E3:E5,
    f,
    ROWS(
        y
    ),
    s,
    SEQUENCE(
        13,
        ,
        2010
    ),
    I,
    LAMBDA(
        x,
        MMULT(
            s^SEQUENCE(
                ,
                f,
                f-1,
                -1
            ),
            TOCOL(
                LINEST(
                    x,
                     y^SEQUENCE(
                         ,
                         f-1
                     )
                )
            )
        )
    ),
    HSTACK(
        I(
            a
        ),
        I(
            b
        ),
        I(
            c
        )
    )
)
Solving the challenge of Linear Interpolation! with Python
Python solution 1 for Linear Interpolation!, proposed by Konrad Gryczan, PhD:
import pandas as pd
import numpy as np

path = 'CH-097 Linear Interpolation.xlsx'
input = pd.read_excel(path, usecols = "B:E", skiprows = 1, nrows = 3)
test  = pd.read_excel(path, usecols = "H:K", skiprows = 1, nrows = 13)
test.columns = ['Year', 'A', 'B', 'C']

years = pd.DataFrame({'Year': range(2010, 2023)})
r1 = years.merge(input, how='left', on='Year')

r1[['A', 'B', 'C']] = r1[['A', 'B', 'C']].interpolate().round().astype(int)

r1.iloc[[0, -1], 1:] = 2 * r1.iloc[[1, -2], 1:] - r1.iloc[[2, -3], 1:]
print(r1.equals(test)) # True
Solving the challenge of Linear Interpolation! with Python in Excel
Python in Excel solution 1 for Linear Interpolation!, proposed by Abdallah Ally:
df = xl("B2:E5", headers=True)

# Perform data manipulation
df2 = pd.DataFrame(data=range(2010, 2023), columns=['Year'])
df = pd.merge(df2, df, how='left', on='Year')
df = df.interpolate(method='linear')
n = len(df)

df.loc[0] = 2 * df.loc[1] - df.loc[2]
df.loc[n-1] = 2 * df.loc[n-2] - df.loc[n-3]

# Display the final results
df
Solving the challenge of Linear Interpolation! with R
R solution 1 for Linear Interpolation!, proposed by Konrad Gryczan, PhD:
library(tidyverse)
library(readxl)
library(zoo)

path = "files/CH-097 Linear Interpolation.xlsx"
input = read_excel(path, range = "B2:E5")
test = read_excel(path, range = "H2:K15")

years = tibble(Year = 2010:2022)

df = years %>%
 left_join(input, by = c("Year" = "Year")) %>%
 mutate(across(c("A", "B", "C"), ~ na.approx(.x, na.rm = FALSE))) %>%
 mutate(across(
 c("A", "B", "C"),
 ~ if_else(
 row_number() == 1,
 2 * lead(.x) - lead(lead(.x)),
 if_else(row_number() == n(), 2 * lag(.x) - lag(lag(.x)), .x)
 )
 )) %>%
 mutate(across(c("A", "B", "C"), round, 0))

identical(df, test) # TRUE
Solving the challenge of Linear Interpolation! with Google Sheets
Google Sheets solution 1 for Linear Interpolation!, proposed by Peter Krkos:
PowerQuery Solution:
https://docs.google.com/spreadsheets/d/1zR5IZLz8OT76vhaPEHfsPrw8-RDKnLyyqS49IJjdhFk/edit?usp=sharing