Challenge No. 116: Add an index column to the question table, with a separate counter for each stock.
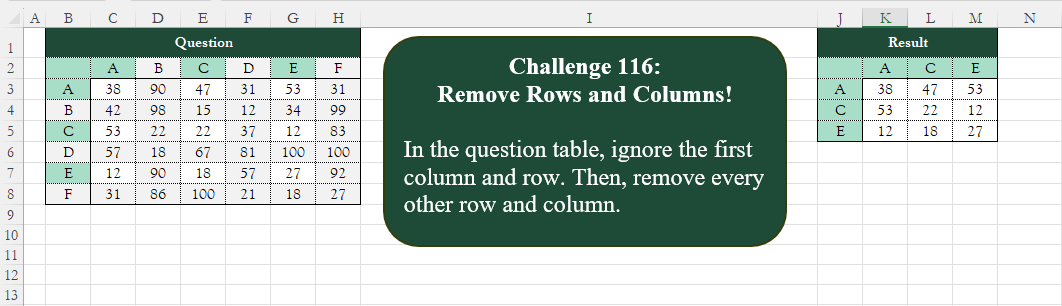
Solved using:Excel (CHOOSECOLS, CHOOSEROWS, COLUMN), Google Sheets, Power Query (List.Alternate, Table.AlternateRows, Table.Column), Python, Python in Excel, and R.
By Software
Solutions categorized by software used.
Multi Replacement!
Challenge No. 115:
Replace “q” and “000” in the Product ID and Customer ID columns with “-“.
Solved using:Excel (HSTACK, LAMBDA, LET), Google Sheets, Power Query (Text.Replace, Table.ReplaceValue, Table.TransformColumns), Python, Python in Excel, R, SQL, and VBA.
Merge! Part 1
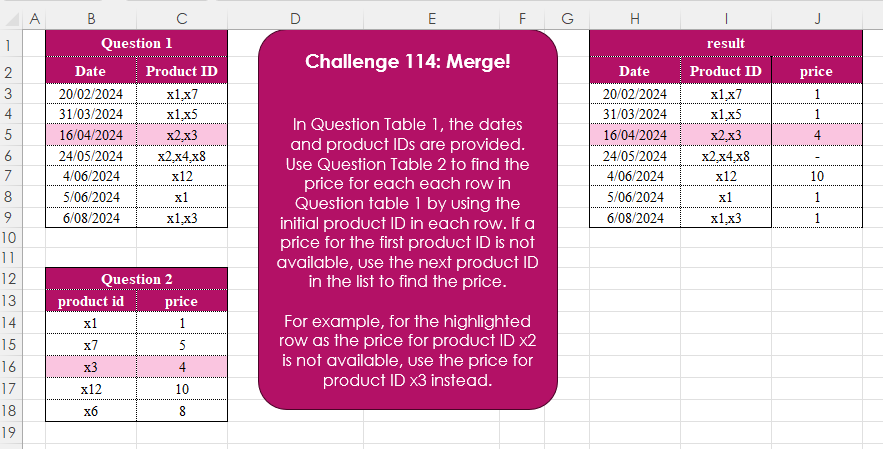
Challenge No. 114: In Question Table 1, the dates and product IDs are provided.
Solved using:Excel (FILTER, HSTACK, IFERROR), Google Sheets, Power Query (Text.Split, Table.AddColumn), Python, Python in Excel, R, and SQL.
Duplicate Values! Part 2
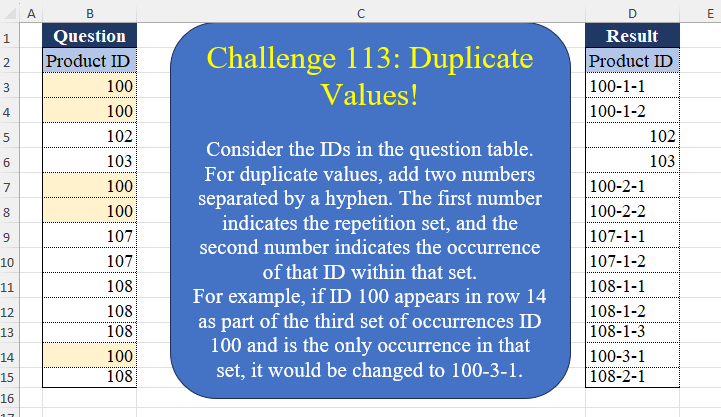
Challenge No. 113: Consider the IDs in the question table.
Solved using:Excel (DROP, IF, LAMBDA), Google Sheets, Power Query (List.Transform, Table.AddColumn, Table.AddIndexColumn), Python, Python in Excel, and R.
Custom Rank! Part 2
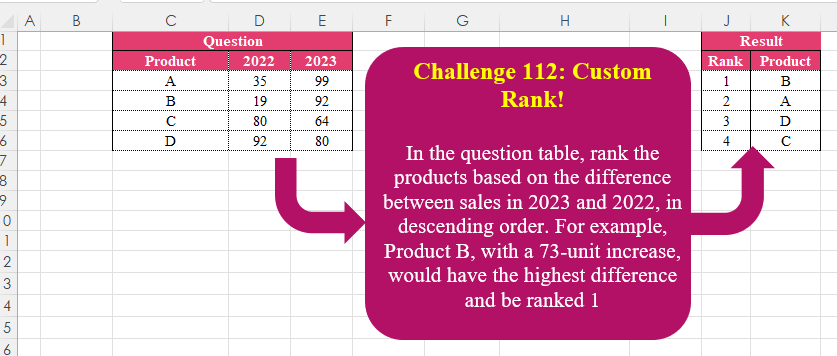
Challenge No. 112: In the question table, rank the products based on the difference between sales in 2023 and 2022, in descending order.
Solved using:Excel (HSTACK, LET, ROWS), Google Sheets, Power Query (Table.AddIndexColumn, Table.Sort), Python, Python in Excel, and R.
Compare Rows! Part 2
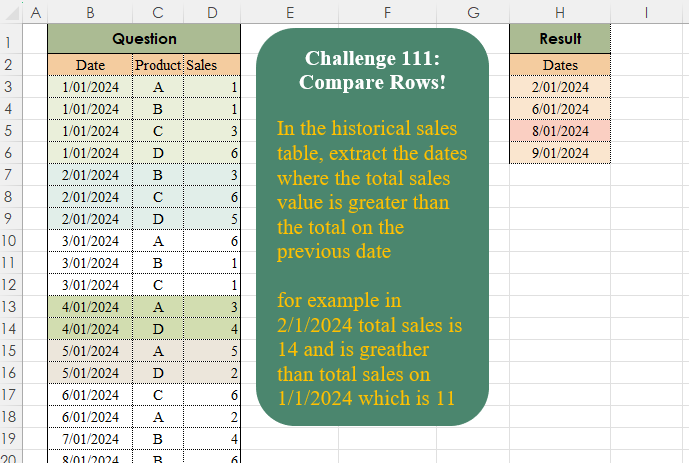
Challenge No. 111: In the historical sales table, extract the dates where the total sales value is greater than the total on the previous date
for example, in 2/1/2024 total sales were 14 and is greater than total sales on 1/1/2024 which is 11.
Solved using:Excel (DROP, FILTER, IF), Google Sheets, Power Query (Table.Group, Table.SelectRows), Python, Python in Excel, and R.
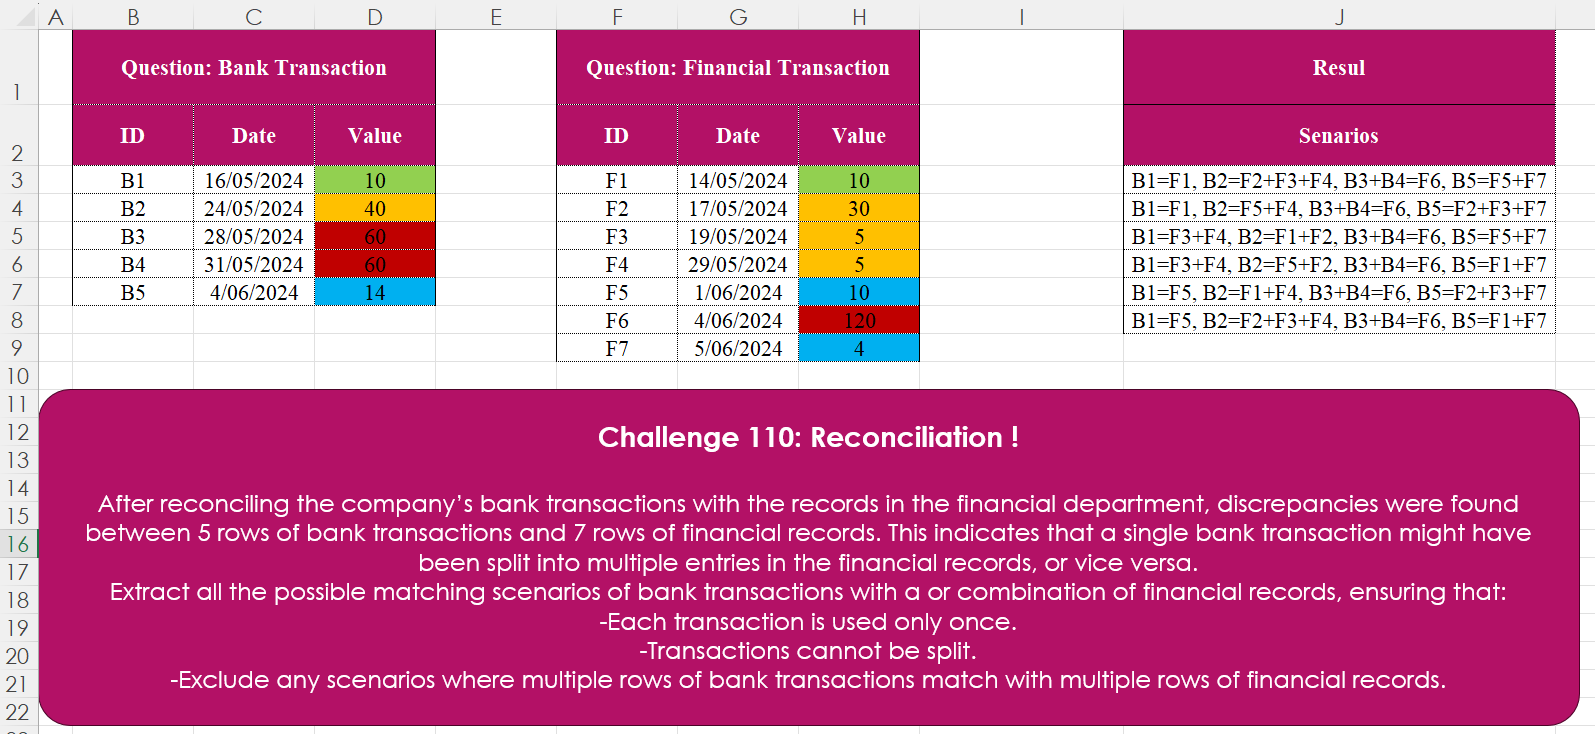
Reconciliation!
Challenge No. 110: After reconciling the company’s bank transactions with the records in the financial department, discrepancies were found between 5 rows of bank transactions and 7 rows of financial records.
Solved using: Excel.
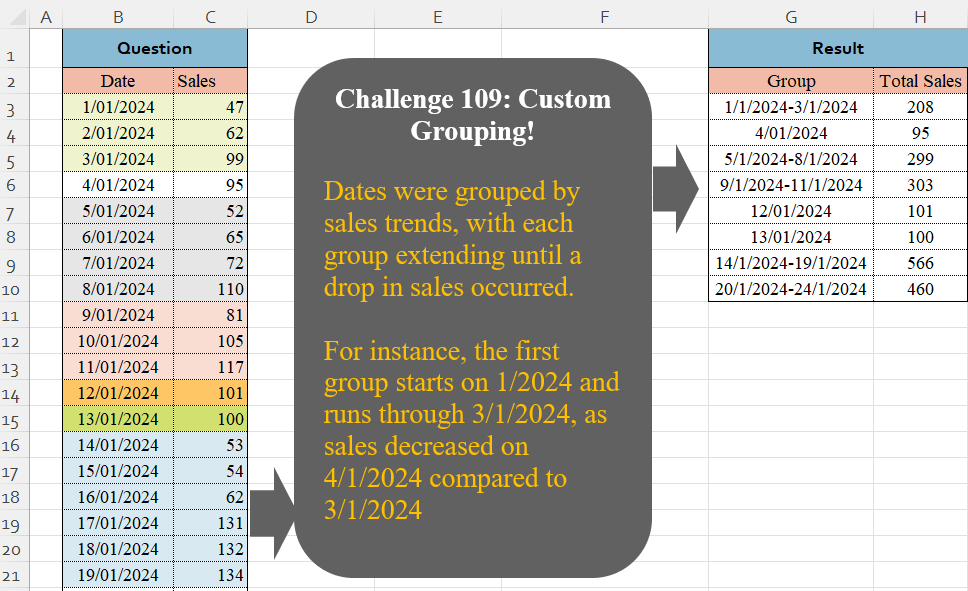
Custom Grouping! Part 3
Challenge No. 109: Dates were grouped by sales trends, with each group extending until a drop in sales occurred.
Solved using:Excel, Google Sheets, Power Query, Python, Python in Excel, and R.
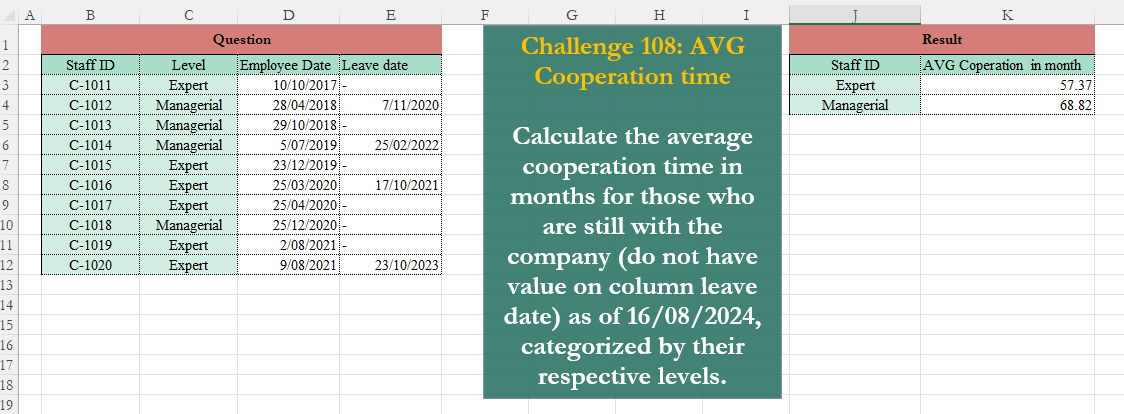
Avg Cooperation Time!
Challenge No. 108: Calculate the average cooperation time in months for those who are still with the company (do not have value on column leave date) as of 16/08/2024, categorized by their respective levels.
Solved using:Excel (AVERAGE, FILTER, HSTACK), Google Sheets, Power Query (Date.Month, Date.Year), Python, Python in Excel, and R.
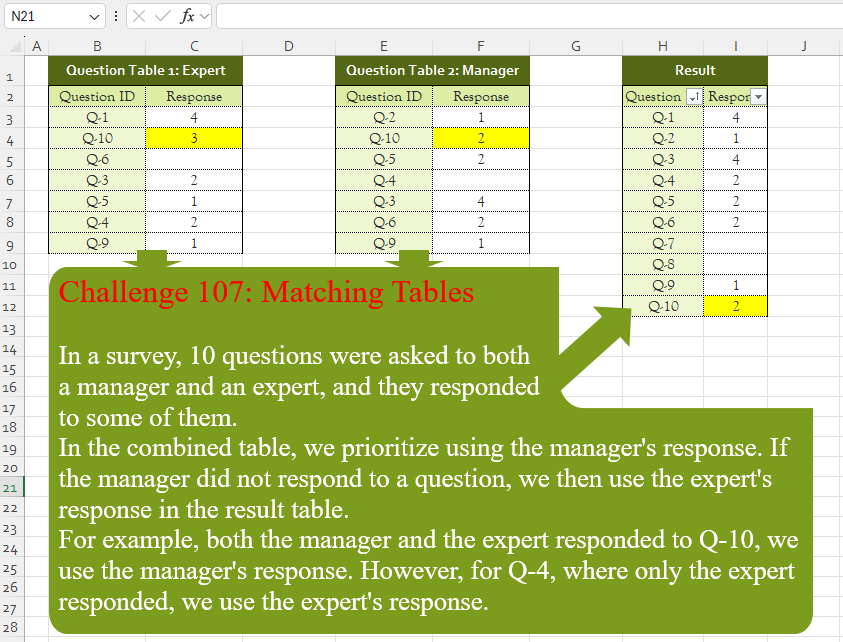
Matching Tables!
Challenge No. 107: In a survey, 10 questions were asked to both
a manager and an expert, and they responded
to some of them.
Solved using:Excel (CHOOSECOLS, FILTER, HSTACK), Google Sheets, Power Query (List.PositionOf, List.Transform, Table.AddColumn), Python, Python in Excel, and R.