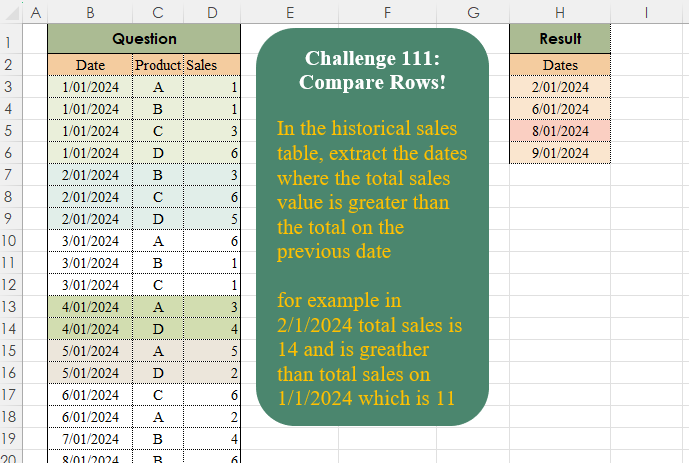
In the historical sales table, extract the dates where the total sales value is greater than the total on the previous date for example, in 2/1/2024 total sales were 14 and is greater than total sales on 1/1/2024 which is 11
📌 Challenge Details and Links
Challenge Number: 111
Challenge Difficulty: ⭐
📥Download Sample File
📥Link to the solutions on LinkedIn
Solving the challenge of Compare Rows! Part 2 with Power Query
Power Query solution 1 for Compare Rows! Part 2, proposed by Zoran Milokanović:
let
  Source = Excel.CurrentWorkbook(){[Name = "Input"]}[Content],
  F      = each List.Sum(List.Transform(List.PositionOf(Source[Date], _, 2), each Source[Sales]{_})),
  S      = List.Select(List.Skip(List.Distinct(Source[Date])), each F(_) > F(_ - Duration.From(1)))
in
  S
Power Query solution 2 for Compare Rows! Part 2, proposed by Brian Julius:
let
  Source = Table.TransformColumnTypes(
    Excel.CurrentWorkbook(){[Name = "Table1"]}[Content],
    {"Date", Date.Type}
  ),
  Group = Table.AddIndexColumn(
    Table.Group(Source, {"Date"}, {{"TotSales", each List.Sum([Sales])}}),
    "Index"
  ),
  AddGTPrev = Table.AddColumn(
    Group,
    "GTPrev",
    each try if Group[TotSales]{[Index]} > Group[TotSales]{[Index] - 1} then 1 else 0 otherwise 0
  ),
  Filter = Table.SelectColumns(Table.SelectRows(AddGTPrev, each [GTPrev] = 1), "Date")
in
  Filter
Power Query solution 3 for Compare Rows! Part 2, proposed by Aditya Kumar Darak 🇮🇳:
let
  Source   = Excel.CurrentWorkbook(){[Name = "data"]}[Content],
  Group    = Table.Group(Source, "Date", {"CS", each List.Sum([Sales])}),
  ToCols   = Table.ToColumns(Group),
  Previous = {#infinity} & List.RemoveLastN(ToCols{1}, 1),
  Table    = Table.FromColumns(ToCols & {Previous}, Table.ColumnNames(Group) & {"PS"}),
  Return   = Table.SelectRows(Table, each ([CS] > [PS]))[[Date]]
in
  Return
Power Query solution 4 for Compare Rows! Part 2, proposed by Alejandro Simón 🇵🇦 🇪🇸:
let
  Source = Excel.CurrentWorkbook(){[Name = "Table1"]}[Content],
  Group = Table.Group(Source, {"Date"}, {{"A", each List.Sum([Sales]), type number}}),
  Cases = List.PositionOf(
    {0} & List.Transform({0 .. Table.RowCount(Group) - 2}, each (Group[A]{_ + 1} - Group[A]{_}) > 0),
    true,
    2
  ),
  Sol = List.Transform(Cases, each Date.From(Group[Date]{_}))
in
  Sol
Power Query solution 5 for Compare Rows! Part 2, proposed by Kris Jaganah:
let
  S = Excel.CurrentWorkbook(){[Name = "Table1"]}[Content],
  A = Table.Group(S, {"Date"}, {"Sales", each List.Sum([Sales])}),
  B = Table.SelectRows(
    A,
    each [Sales] > List.Last(Table.SelectRows(A, (x) => x[Date] < [Date])[Sales])
  ),
  C = Table.RemoveColumns(B, {"Sales"})
in
  C
Power Query solution 6 for Compare Rows! Part 2, proposed by Kris Jaganah:
let
  S = Excel.CurrentWorkbook(){[Name = "Table1"]}[Content],
  A = Table.Group(S, {"Date"}, {"Sales", each List.Sum([Sales])}),
  B = Table.AddIndexColumn(A, "I", 1),
  C = Table.AddIndexColumn(B, "I0"),
  D = Table.NestedJoin(C, {"I0"}, C, {"I"}, "C"),
  E = Table.ExpandTableColumn(D, "C", {"Sales"}, {"Sales1"}),
  F = Table.SelectRows(E, each [Sales1] < [Sales]),
  G = Table.SelectColumns(F, {"Date"})
in
  G
Power Query solution 7 for Compare Rows! Part 2, proposed by Abdallah Ally:
let
  Source = Excel.CurrentWorkbook(){[Name = "Table1"]}[Content],
  Transform = Table.TransformColumnTypes(Source, {"Date", Date.Type}),
  Group = Table.Group(Transform, "Date", {"Sales", each List.Sum([Sales])}),
  Result = Table.SelectRows(
    Group,
    each [
      a = Table.PositionOf(Group, _),
      b = if a = 0 then false else Group[Sales]{a} > Group[Sales]{a - 1}
    ][b]
  )[[Date]]
in
  Result
Power Query solution 8 for Compare Rows! Part 2, proposed by Yaroslav Drohomyretskyi:
let
  Source = Excel.CurrentWorkbook(){[Name = "Table1"]}[Content],
  Group = Table.Group(Source, {"Date"}, {{"Sales", each List.Sum([Sales]), type number}}),
  Index = Table.AddIndexColumn(Group, "Index", 0, 1, Int64.Type),
  Filter = Table.SelectRows(Index, each try _[Sales] > Index{[Index] - 1}[Sales] otherwise null)[
    [Date]
  ]
in
  Filter
Power Query solution 9 for Compare Rows! Part 2, proposed by 🇮🇷 Navid Esmaeilzadeh اسماعیل زاده:
let
  Source = Excel.CurrentWorkbook(){[Name = "Table1"]}[Content],
  A = Table.TransformColumnTypes(Source, {{"Date", type date}}),
  B = Table.Group(A, {"Date"}, {{"Total Sales", each List.Sum([Sales]), type number}}),
  C = Table.AddIndexColumn(B, "Index", 0, 1, Int64.Type),
  D = Table.AddColumn(C, " T", each try [Total Sales] > C[Total Sales]{[Index] - 1} otherwise null),
  E = Table.SelectRows(D, each [#" T"] = true),
  F = Table.SelectColumns(E, {"Date"})
in
  F
Power Query solution 10 for Compare Rows! Part 2, proposed by Peter Krkos:
let
  Source = Table.FromRows(
    Json.Document(
      Binary.Decompress(
        Binary.FromText(
          "bZFBDoAgDAT/wtlEoAX1qPAL4v+/IdCDbu1hL5PddtO25sIa1ugju8WdXcHdC8DLgqWLNKxdecKIcdKwWM4RTxMSVsoavpUIZwpkjJOGYxFPmNCZNBzOOGG2ymeMi3PDnrJoRyjxw7rngTPZckrP4K1NX1rfL/nf9e4H",
          BinaryEncoding.Base64
        ),
        Compression.Deflate
      )
    ),
    let
      _t = ((type nullable text) meta [Serialized.Text = true])
    in
      type table [Date = _t, Product = _t, Sales = _t]
  ),
  ChangedType = Table.TransformColumnTypes(
    Source,
    {{"Sales", Int64.Type}, {"Date", type date}},
    "sk-SK"
  ),
  GroupedRows = Table.Group(
    ChangedType,
    {"Date"},
    {{"Group Sum", each List.Sum([Sales]), type number}}
  ),
  Ad_Prev = Table.FromColumns(
    Table.ToColumns(GroupedRows) & {{null} & List.RemoveLastN(GroupedRows[Group Sum], 1)},
    Value.Type(Table.FirstN(GroupedRows, 0) & #table(type table [Group Sum Prev = number], {}))
  ),
  Ad_Filter = Table.AddColumn(
    Ad_Prev,
    "Filter",
    each try if [Group Sum] > [Group Sum Prev] then 1 else 0 otherwise null,
    Int64.Type
  ),
  FilteredRows = Table.SelectRows(Ad_Filter, each ([Filter] = 1))[[Date]]
in
  FilteredRows
Solving the challenge of Compare Rows! Part 2 with Excel
Excel solution 1 for Compare Rows! Part 2, proposed by محمد حلمي:
=LET(b,
    B3:B26,
    s,
    SUMIFS(
        D3:D26,
        b,
        b
    ),TOCOL(DROP(
    b,
    1
)/(DROP(
    s,
    1
)>s),
    2))
Excel solution 2 for Compare Rows! Part 2, proposed by Oscar Mendez Roca Farell:
=LET(
    d,
     B3:B26,
     u,
     UNIQUE(
         d
     ),
     s,
     SUMIFS(
         D3:D26,
          d,
          u
     ),
     TOCOL(
         IFS(
             DROP(
                 s,
                  1
             )>s,
              DROP(
                  u,
                   1
              )
         ),
          2
     )
)
Excel solution 3 for Compare Rows! Part 2, proposed by Julian Poeltl:
=LET(
    D,
    B3:B26,
    S,
    D3:D26,
    U,
    UNIQUE(
        D
    ),
    M,
    MAP(
        U,
        LAMBDA(
            A,
            SUM(
                FILTER(
                    S,
                    D=A
                )
            )
        )
    ),
    FILTER(
        DROP(
            U,
            1
        ),
        DROP(
            DROP(
                M,
                1
            )>M,
            -1
        )
    )
)
Excel solution 4 for Compare Rows! Part 2, proposed by Kris Jaganah:
=LET(a,
    B3:B26,
    b,
    DROP(
        UNIQUE(
            a
        ),
        1
    ),
    TOCOL(b/(MMULT(
        SUMIFS(
            D3:D26,
            a,
            HSTACK(
                b,
                b-1
            )
        ),
        {1;-1}
    )>0),
    3))
Excel solution 5 for Compare Rows! Part 2, proposed by Kris Jaganah:
=LET(a,
    GROUPBY(
        B3:B26,
        D3:D26,
        SUM,
        ,
        0
    ),
    b,
    TAKE(
        a,
        ,
        1
    ),
    TOCOL(b/(IFNA(
        DROP(
        a,
        ,
        1
    )-VLOOKUP(
        b-1,
        a,
        2,
        0
    ),    )>0),
    3))
Excel solution 6 for Compare Rows! Part 2, proposed by Imam Hambali:
=LET(
a,
    GROUPBY(
        B3:B26,
        D3:D26,
        SUM,
        0,
        0
    ),FILTER(TAKE(
    a,
    ,
    1
),
     (TAKE(
         a,
         ,
         -1
     )-VSTACK(
         99,
         DROP(
             TAKE(
         a,
         ,
         -1
     ),
             -1
         )
     ))>0)
)
Excel solution 7 for Compare Rows! Part 2, proposed by Sunny Baggu:
=LET(     _ud,
     UNIQUE(
         B3:B26
     ),     _s,
     MAP(          _ud,          LAMBDA(
              a,

               SUM(
                   FILTER(
                       D3:D26,
                        B3:B26 = a
                   )
               )

          )     ),     _f,
     VSTACK(          0,          N(
              DROP(
                  _s,
                   1
              ) > DROP(
                  _s,
                   -1
              )
          )     ),     VSTACK(
         B2 & "s",
          TOCOL(
              IF(
                  _f,
                   _ud,
                   x
              ),
               3
          )
     ))
Excel solution 8 for Compare Rows! Part 2, proposed by Sunny Baggu:
=LET(     _u,
     UNIQUE(
         B3:B26
     ),     _a,
     SUMIFS(
         D3:D26,
          B3:B26,
          _u
     ),     FILTER(          _u,          VSTACK(

               0,

               N(
                   DROP(
                       _a,
                        1
                   ) > DROP(
                       _a,
                        -1
                   )
               )

          )     ))
Excel solution 9 for Compare Rows! Part 2, proposed by Bilal Mahmoud kh.:
=LET(
    a,
    DROP(
        REDUCE(
            0,
            UNIQUE(
                A3:A26
            ),
            LAMBDA(
                x,
                y,
                VSTACK(
                    x,
                    SUM(
                        FILTER(
                            C3:C26,
                            A3:A26=y
                        )
                    )
                )
            )
        ),
        1
    ),
    n,
    TEXT(
        FILTER(
            UNIQUE(
                A3:A26
            ),
            VSTACK(
                0,
                DROP(
                    a,
                    1
                )>DROP(
                    a,
                    -1
                )
            )
        ),
        "dd/mm/yyyy"
    ),
    n
)
Excel solution 10 for Compare Rows! Part 2, proposed by CA Raghunath Gundi:
=LET(
    U,
    UNIQUE(
        Date
    ),
    s,
    SUMIFS(
        Sales,
        Date,
        U
    ),
    FILTER(
        DROP(
            U,
            1
        ),
        DROP(
            s,
            1
        )>DROP(
            s,
            -1
        )
    )
)
Excel solution 11 for Compare Rows! Part 2, proposed by Eddy Wijaya:
=LET(    dat,
    B3:B26,    sales,
    D3:D26,    arr,
    HSTACK(
        UNIQUE(
            dat
        ),
        MAP(
            UNIQUE(
            dat
        ),
            LAMBDA(
                m,
                SUM(
                    FILTER(
                        sales,
                        dat=m
                    )
                )
            )
        )
    ),    diff,
    DROP(
        DROP(
            arr,
            ,
            1
        )-VSTACK(
            0,
            DROP(
            arr,
            ,
            1
        )
        ),
        -1
    ),    DROP(
        FILTER(
            HSTACK(
                arr,
                diff
            ),
            diff>0
        ),
        1,
        -2
    )
)
Excel solution 12 for Compare Rows! Part 2, proposed by El Badlis Mohd Marzudin:
=LET(d,B3:B26,u,UNIQUE(d),t,SUMIFS(D3:D26,d,u),FILTER(u,VSTACK(0,DROP(t,1)>DROP(t,-1))))Excel solution 13 for Compare Rows! Part 2, proposed by ferhat CK:
=LET(
    x,
    UNIQUE(
        B3:B26
    ),
    a,
    MAP(
        x,
        LAMBDA(
            x,
            SUMIF(
                B3:B26,
                x,
                D3:D26
            )
        )
    ),
    b,
    VSTACK(
        11,
        DROP(
            a,
            -1
        )
    ),
    FILTER(
        x,
        a>b
    )
)
Excel solution 14 for Compare Rows! Part 2, proposed by Hamidi Hamid:
=LET(
    x,
    UNIQUE(
        B3:B26
    )*1,
    y,
    DROP(
        REDUCE(
            ,
            UNIQUE(
                B2:B26
            ),
            LAMBDA(
                a,
                b,
                VSTACK(
                    a,
                    SUMIF(
                        B3:B26,
                        b,
                        D3:D26
                    )
                )
            )
        ),
        1
    ),
    zz,
    DROP(
        VSTACK(
            0,
            y
        ),
        -1
    ),
    DROP(
        FILTER(
            x,
            y-zz>0
        ),
        1
    )
)
Excel solution 15 for Compare Rows! Part 2, proposed by Hussein SATOUR:
=LET(
    a,
    GROUPBY(
        B3:B26,
        D3:D26,
        SUM,
        ,
        0
    ),
    FILTER(
        DROP(
            INDEX(
                a,
                ,
                1
            ),
            1
        ),
        DROP(
            INDEX(
                a,
                ,
                2
            ),
            1
        )>DROP(
            INDEX(
                a,
                ,
                2
            ),
            -1
        )
    )
)
Excel solution 16 for Compare Rows! Part 2, proposed by Md. Shah Alam, Microsoft Certified Trainer:
=LET(r,
    B3:B26,
    s,
    UNIQUE(
        r
    ),
    t,
    D3:D26,
    w,
    SUMIFS(
        t,
        r,
        s
    ),
    FILTER(DROP(
        s,
        1
    ),
    (DROP(
        w,
        1
    )>DROP(
        w,
        -1
    ))))
Excel solution 17 for Compare Rows! Part 2, proposed by Md. Zohurul Islam:
=LET(    A,
    B3:B26,    B,
    D3:D26,    C,
    GROUPBY(
        A,
        B,
        SUM,
        0,
        0
    ),    P,
    CHOOSECOLS(
        C,
        1
    ),    Q,
    CHOOSECOLS(
        C,
        2
    ),    R,
    DROP(
        VSTACK(
            0,
            Q
        ),
        -1
    ),    S,
    R-Q,    dates,
    DROP(
        FILTER(
            P,
            S<0
        ),
        1
    ),    dates
)
Excel solution 18 for Compare Rows! Part 2, proposed by Mey Tithveasna:
=LET(
    dt,
    B3:B26,
    u,
    UNIQUE(
        dt
    ),
    s,    SUMIF(
        dt,
        u,
        D3:D26
    ),
    FILTER(
        u,        VSTACK(
            0,
            DROP(
                s,
                1
            )>DROP(
                s,
                -1
            )
        )
    )
)
Excel solution 19 for Compare Rows! Part 2, proposed by Nicolas Micot:
=LET(
    _dates;
    UNIQUE(
        B3:B26
    );    _salesParDate;
    SOMME.SI(
        B3:B26;
        _dates;
        D3:D26
    );    _difference;
     ASSEMB.V(
         0;
         EXCLURE(
             _salesParDate;
             1
         )-EXCLURE(
             _salesParDate;
             -1
         )
     );    FILTRE(
        _dates;
        _difference>0
    )
)
Excel solution 20 for Compare Rows! Part 2, proposed by Pierluigi Stallone:
=LET(
    list_date,
     IF(
         SUMIFS(
             C3:C26,
             A3:A26,
             UNIQUE(
                 A3:A26
             )
         )FALSE
    )
)
Excel solution 21 for Compare Rows! Part 2, proposed by Pieter de B.:
=LET(d,
    B3:B26,
    s,
    D3:D26,
    u,
    UNIQUE(
        d
    ),
    TOCOL(MAP(DROP(
        u,
        -1
    ),
    DROP(
        u,
        1
    ),
    LAMBDA(x,
    y,
    y/(SUMIF(
        d,
        y,
        s
    )>SUMIF(
        d,
        x,
        s
    )))),
    2))
Excel solution 22 for Compare Rows! Part 2, proposed by Rick Rothstein:
=LET(
    d,
    B3:B26,
    u,
    UNIQUE(
        d
    ),
    s,
    SUMIF(
        d,
        u,
        D3:D26
    ),
    FILTER(
        DROP(
            u,
            1
        ),
        DROP(
            s,
            1
        )>DROP(
            s,
            -1
        )
    )
)
Excel solution 23 for Compare Rows! Part 2, proposed by Ümit Barış Köse, MSc:
= SUM(
    Table1[Sales]
)
Previous Day Sales =
 CALCULATE(      [Daily Total Sales],      DATEADD(
          Table1[Date],
           -1,
           DAY
      )  )
Sales Difference Between Today and Previous Day =
 IF(      AND(
          [Daily Total Sales] > [Previous Day Sales],
          [Previous Day Sales]>0
      ),      [Daily Total Sales]-[Previous Day Sales],      BLANK() )
Solving the challenge of Compare Rows! Part 2 with Python
Python solution 1 for Compare Rows! Part 2, proposed by Konrad Gryczan, PhD:
import pandas as pd

path = "CH-111 iNCREASED SALES.xlsx"
input = pd.read_excel(path, usecols = "B:D", skiprows = 1, nrows = 24)
test  = pd.read_excel(path, usecols = "H", skiprows = 1, nrows = 4)

result = input.groupby("Date").sum()
result = result[result["Sales"] > result["Sales"].shift(1)].reset_index()
result = result.drop(columns=["Sales", "Product"])

print(result["Date"].equals(test["Dates"])) # True
Solving the challenge of Compare Rows! Part 2 with Python in Excel
Python in Excel solution 1 for Compare Rows! Part 2, proposed by Abdallah Ally:
df = xl("B2:D26", headers=True)

# Perform data manipulation
df = df.groupby('Date')['Sales'].sum().reset_index()
df = (
 df[['Date']][df['Sales'] > df['Sales'].shift(1)]
 .reset_index(drop=True)
 .rename(columns={'Date': 'Dates'})
)

# Display trhe final results
df
Python in Excel solution 2 for Compare Rows! Part 2, proposed by Alejandro Campos:
xl("B2:D26", headers=True).assign(
 Date=lambda df: pd.to_datetime(df['Date'], format='%d/%m/%Y'))
 .groupby('Date')['Sales'].sum().diff().gt(0).reset_index()
 .query('Sales')['Date'].to_list()
Python in Excel solution 3 for Compare Rows! Part 2, proposed by Ümit Barış Köse, MSc:
df=xl("B2:D26", headers=True)
df['Date'] = pd.to_datetime(df['Date'], format='%d.%m.%Y')
daily_sales = df.pivot_table(index='Date', values='Sales', aggfunc='sum')
daily_sales['PDay_Sales'] = daily_sales['Sales'].shift(1)
greater_than_previous = daily_sales[daily_sales['Sales'] > daily_sales['PDay_Sales']]
result_dates = greater_than_previous.index
result_dates_list = result_dates.tolist()
result_dates_list
Solving the challenge of Compare Rows! Part 2 with R
R solution 1 for Compare Rows! Part 2, proposed by Konrad Gryczan, PhD:
library(tidyverse)
library(readxl)

path = "files/CH-111 iNCREASED SALES.xlsx"
input = read_excel(path, range = "B2:D25")
test = read_excel(path, range = "H2:H6")

result = input %>%
 summarise(sales = sum(Sales), .by = Date) %>%
 filter(sales > lag(sales)) %>%
 select(Dates = Date)

identical(result, test)
# [1] TRUE
Solving the challenge of Compare Rows! Part 2 with Google Sheets
Google Sheets solution 1 for Compare Rows! Part 2, proposed by Peter Krkos:
PowerQuery Solution:
https://docs.google.com/spreadsheets/d/1zR5IZLz8OT76vhaPEHfsPrw8-RDKnLyyqS49IJjdhFk/edit?usp=sharing