_x000D_
Excel solution 10 for Custom Grouping! Part 3, proposed by Asheesh Pahwa:
=LET(
d,
B3:B26,
sal,
C3:C26,
s,
SCAN(
0,
sal,
LAMBDA(
x,
y,
IF(
y""
),
xl,
XLOOKUP(
f,
sal,
d
),
m,
VSTACK(
DROP(
xl,
1
)-1,
MAX(
d
)
), h,
HSTACK(
xl,
m
),
r,
DROP(
REDUCE(
"",
SEQUENCE(
ROWS(
m
)
),
LAMBDA(
x,
y,
VSTACK(
x,
LET(
I,
INDEX(
h,
y,
),
t,
@TAKE(
I,
,
1
),
_t,
@TAKE(
I,
,
-1
),
s,
SEQUENCE(
_t-t+1,
,
t
),
HSTACK(
IF(
COUNTA(
s
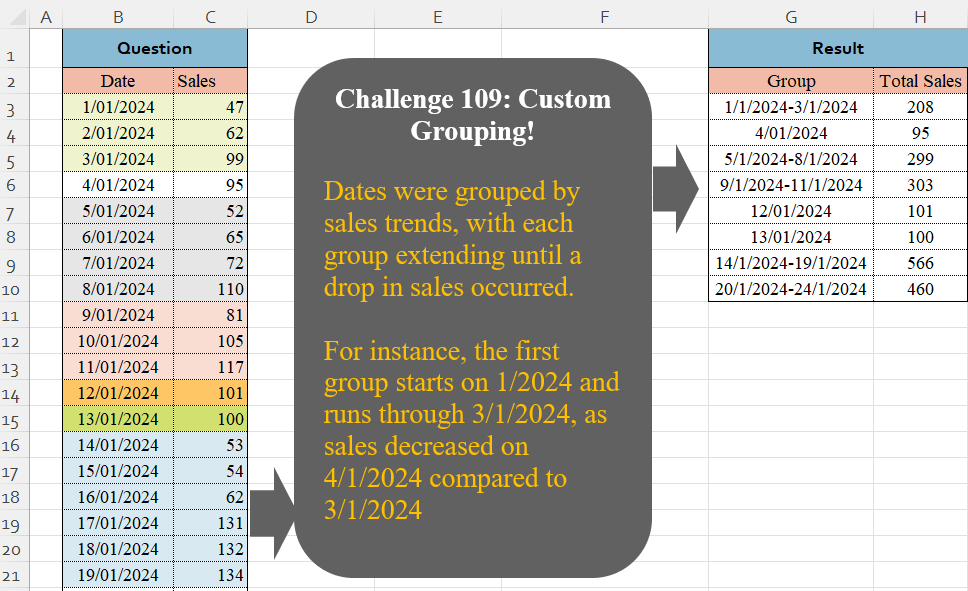
)>1, Dates were grouped by sales trends, with each group extending until a drop in sales occurred.
For instance, the first group starts on 1/2024 and runs through 3/1/2024, as sales decreased on 4/1/2024 compared to 3/1/2024
📌 Challenge Details and Links
Challenge Number: 109
Challenge Difficulty: ⭐⭐⭐⭐
📥Download Sample File
📥Link to the solutions on LinkedIn
Solving the challenge of Custom Grouping! Part 3 with Power Query
_x000D_
Power Query solution 1 for Custom Grouping! Part 3, proposed by Zoran Milokanović:
let
  Source = Excel.CurrentWorkbook(){[Name = "Input"]}[Content],
  S = Table.FromRecords(
    Table.Group(
      Source,
      {"Date", "Sales"},
      {
        "A",
        each
          let
            t = Table.ToColumns(_),
            d = each DateTime.ToText(_, "d/M/yyyy")
          in
            [
              Group       = Text.Combine(List.Distinct({d(t{0}{0}), d(List.Last(t{0}))}), "-"),
              Total Sales = List.Sum(t{1})
            ]
      },
      0,
      (b, n) =>
        let
          p = List.PositionOf(Source[Date], n[Date])
        in
          Byte.From(p = 0 or n[Sales] < Source{p - 1}[Sales])
    )[A]
  )
in
  S
_x000D_
_x000D_
Power Query solution 2 for Custom Grouping! Part 3, proposed by Brian Julius:
let
  Source = Table.AddIndexColumn(
    Table.TransformColumnTypes(
      Excel.CurrentWorkbook(){[Name = "Table1"]}[Content],
      {"Date", Date.Type}
    ),
    "Index",
    1
  ),
  AddTrend = Table.AddColumn(
    Table.AddColumn(Source, "PrevSales", each try Source[Sales]{[Index] - 2} otherwise [Sales]),
    "Trend",
    each if [PrevSales] > [Sales] then [Index] else 0
  ),
  AddCumulTrend = Table.AddColumn(
    AddTrend,
    "CumulTrend",
    each List.Sum(List.FirstN(AddTrend[Trend], [Index]))
  ),
  Group = Table.Group(
    AddCumulTrend,
    {"CumulTrend"},
    {
      {"Count", each Table.RowCount(_)},
      {"Total Sales", each List.Sum([Sales])},
      {"MinDate", each List.Min([Date])},
      {"MaxDate", each List.Max([Date])}
    }
  ),
  Clean = Table.SelectColumns(
    Table.AddColumn(
      Group,
      "Group",
      each
        if [Count] = 1 then
          Text.From([MinDate])
        else
          Text.From([MinDate]) & "-" & Text.From([MaxDate])
    ),
    {"Group", "Total Sales"}
  )
in
  Clean
_x000D_
_x000D_
Power Query solution 3 for Custom Grouping! Part 3, proposed by Eric Laforce:
let
  Source = Excel.CurrentWorkbook(){[Name = "tData"]}[Content],
  Add_Prev = Table.FromColumns(
    Table.ToColumns(Source) & {{null} & List.RemoveLastN(Source[Sales])},
    {"Date", "Sales", "PrevSales"}
  ),
  Group = Table.Group(
    Add_Prev,
    {"Sales", "PrevSales"},
    {
      "G",
      each
        let
          _Dates    = List.Distinct({List.First([Date]), List.Last([Date])}),
          _DatesStr = List.Transform(_Dates, each Date.ToText(Date.From(_)))
        in
          {Text.Combine(_DatesStr, "-"), List.Sum([Sales])}
    },
    GroupKind.Local,
    (x, y) => Byte.From(y[PrevSales] = null or y[Sales] < y[PrevSales])
  ),
  Result = Table.FromRows(Group[G], {"Group", "Total Sales"})
in
  Result
_x000D_
_x000D_
Power Query solution 4 for Custom Grouping! Part 3, proposed by Luan Rodrigues:
let
  Fonte = Tabela1,
  Ind = Table.AddIndexColumn(Fonte, "Ind", 1),
  add = Table.AddColumn(Ind, "tab", each try Ind{[Ind] - 2}[Sales] otherwise 0),
  grp = Table.Group(
    add,
    {"Sales", "tab"},
    {
      {
        "res",
        each
          let
            min  = DateTime.ToText(List.Min(_[Date]), "dd/MM/yyyy"),
            max  = DateTime.ToText(List.Max(_[Date]), "dd/MM/yyyy"),
            soma = List.Sum(_[Sales])
          in
            Table.FromRows(
              List.Zip({{Text.Combine(List.Distinct({min, max}), "-")}, {soma}}),
              {"Group", "Total Sales"}
            )
      }
    },
    0,
    (a, b) => Number.From(b[Sales] < b[tab])
  )[res],
  res = Table.Combine(grp)
in
  res
_x000D_
_x000D_
Power Query solution 5 for Custom Grouping! Part 3, proposed by Aditya Kumar Darak 🇮🇳:
let
  Source = Excel.CurrentWorkbook(){[Name = "data"]}[Content],
  ToCols = Table.ToColumns(Source),
  NewCol = {{- #infinity} & List.RemoveLastN(ToCols{1}, 1)},
  Table = Table.FromColumns(ToCols & NewCol, Table.ColumnNames(Source) & {"P"}),
  Group = Table.Group(
    Table,
    {"Sales", "P"},
    {
      {
        "Date",
        each [
          St = DateTime.ToText(List.Min([Date]), "d", "en-in"),
          Ed = DateTime.ToText(List.Max([Date]), "d", "en-in"),
          R  = if St = Ed then St else St & " - " & Ed
        ][R]
      },
      {"Total Sales", each List.Sum([Sales])}
    },
    0,
    (x, y) => Number.From(y[Sales] < y[P])
  ),
  Return = Table.RemoveColumns(Group, {"Sales", "P"})
in
  Return
_x000D_
_x000D_
Power Query solution 6 for Custom Grouping! Part 3, proposed by Alejandro Simón 🇵🇦 🇪🇸:
let
Source = Excel.CurrentWorkbook(){[Name="Table1"]}[Content],
 Col = List.Generate(()=>[x=1, y=0],
each [y]Source[Sales]{[y]} then [x] else [x]+1,
 y = [y]+1],
each [x]),
 Tbl = Table.FromColumns(Table.ToColumns(Source)&{Col}),
 Sol = Table.RemoveColumns(Table.Group(Tbl, {"Column3"}, {{"Group", each
let
a = [Column1],
b = List.Transform(a, each Text.From(Date.From(_))),
c = Text.Combine(List.Distinct({b{0}, List.Last(b)}), "-")
in c}, {"Total Sales", each List.Sum([Column2])}}), "Column3")
in
 Sol
_x000D_
_x000D_
Power Query solution 7 for Custom Grouping! Part 3, proposed by Alejandro Simón 🇵🇦 🇪🇸:
let
Source = Excel.CurrentWorkbook(){[Name="Table1"]}[Content],
Idx = Table.AddIndexColumn(Source, "Idx", 0),
Sol = Table.Combine(Table.Group(Idx, {"Idx"}, {{"All", each
 let
 a = _,
 b = List.Transform([Date], each Date.ToText(Date.From(_), "dd/MM/yyyy")),
 c = Text.Combine(List.Distinct({b{0},List.Last(b)}), "-"),
 d = Table.FromRows({{c, List.Sum([Sales])}}, {"Group", "Total Sales"})
 in d}},0, (a,b)=> Number.From(Idx[Sales]{b[Idx]}
_x000D_
_x000D_
Power Query solution 8 for Custom Grouping! Part 3, proposed by Abdallah Ally:
let
  Source = Excel.CurrentWorkbook(){[Name = "Table1"]}[Content],
  Transform = Table.TransformColumns(Source, {"Date", Date.From}),
  Sort = Table.Sort(Transform, "Date"),
  AddColumn1 = Table.AddColumn(
    Sort,
    "Cat1",
    each try [Sales] < Sort[Sales]{Table.PositionOf(Sort, _) - 1} otherwise false
  ),
  AddColumn2 = Table.AddColumn(
    AddColumn1,
    "Cat2",
    each [
      a = Table.PositionOf(AddColumn1, _) + 1,
      b = List.FirstN(AddColumn1[Cat1], a),
      c = List.Sum(List.Transform(b, Number.From))
    ][c]
  )[[Cat2], [Date], [Sales]],
  Result = Table.Group(
    AddColumn2,
    "Cat2",
    {
      {
        "Group",
        (x) =>
          [
            a = Text.From(List.Min(x[Date])),
            b = Text.From(List.Max(x[Date])),
            c = if a = b then a else a & "-" & b
          ][c]
      },
      {"Total Sales", each List.Sum([Sales])}
    }
  )[[Group], [Total Sales]]
in
  Result
_x000D_
_x000D_
Power Query solution 9 for Custom Grouping! Part 3, proposed by Kris Jaganah:
let
  S = Excel.CurrentWorkbook(){[Name = "Table1"]}[Content],
  A = Table.TransformColumnTypes(S, {{"Date", Int64.Type}}),
  B = Table.AddColumn(
    A,
    "Chng",
    each [Sales] - List.Last(Table.SelectRows(A, (x) => x[Date] = [Date] - 1)[Sales])
  ),
  C = Table.AddColumn(
    B,
    "Rng",
    each [
      a = List.PositionOf(B[Date], [Date]),
      b = List.Range(B[Chng], 1, a),
      c = List.Accumulate(b, 0, (x, y) => if y < 0 and x >= 0 then x + 1 else x)
    ][c]
  ),
  D = Table.AddColumn(
    C,
    "Group",
    each [
      p = Table.SelectRows(C, (y) => y[Rng] = [Rng])[Date],
      q = (z) => Date.ToText(Date.From(z), [Format = "dd/MM/yyyy"]),
      r = if List.Count(p) = 1 then q(p{0}) else q(List.Min(p)) & "-" & q(List.Max(p))
    ][r]
  ),
  E = Table.Group(D, {"Group"}, {"Total Sales", each List.Sum([Sales])})
in
  E
_x000D_
_x000D_
Power Query solution 10 for Custom Grouping! Part 3, proposed by Yaroslav Drohomyretskyi:
let
  Source = Excel.CurrentWorkbook(){[Name = "Table1"]}[Content],
  Index = Table.AddIndexColumn(Source, "Index", 1, 1, Int64.Type),
  Decrease = Table.AddColumn(
    Index,
    "Custom",
    each try if [Sales] > Index[Sales]{[Index]} then [Index] else null otherwise "last"
  ),
  FillUp = Table.FillUp(Decrease, {"Custom"}),
  DateType = Table.TransformColumnTypes(FillUp, {{"Date", type date}}),
  Group = Table.Group(
    DateType,
    {"Custom"},
    {
      {
        "Group",
        each Text.From(List.Min([Date]))
          & (if List.Count([Date]) > 1 then "-" & Text.From(List.Max([Date])) else "")
      },
      {"Total Sales", each List.Sum([Sales]), type number}
    }
  ),
  Remove = Table.RemoveColumns(Group, {"Custom"})
in
  Remove
_x000D_
_x000D_
Power Query solution 11 for Custom Grouping! Part 3, proposed by 🇮🇷 Navid Esmaeilzadeh اسماعیل زاده:
let
S = Excel.CurrentWorkbook(){[Name="Table1"]}[Content],
A = Table.AddIndexColumn(S, "Index", 1, 1, Int64.Type),
B = Table.AddColumn(A, "Diff", each if (try [Sales]-A[Sales]{[Index]-2} otherwise null )<0 or (try [Sales]-A[Sales]{[Index]-2} otherwise null )=null then [Index] else null),
C = Table.FillDown(B,{"Diff"}),
D = Table.Group(C, {"Diff"}, {{"Total", each List.Sum([Sales]), type number}, {"MaxDate", each List.Max([Date]), type datetime}, {"MinDate", each List.Min([Date]), type datetime}}),
E = Table.TransformColumnTypes(D,{{"MaxDate", type date}, {"MinDate", type date}}),
F = Table.AddColumn(E, "Group", each if [MaxDate]<>[MinDate] then Text.From([MinDate])&"_"&Text.From([MaxDate]) else [MaxDate]),
G = Table.SelectColumns(F,{"Group", "Total"}),
H = Table.TransformColumnTypes(G,{{"Group", type text}})
in
H
_x000D_
_x000D_
Power Query solution 12 for Custom Grouping! Part 3, proposed by Amit Rathi:
let
  Source = Excel.CurrentWorkbook(){[Name = "Table1"]}[Content],
  AddIndex = Table.AddIndexColumn(Source, "Index", 1, 1, Int64.Type),
  AddSalesDropFlag = Table.AddColumn(
    AddIndex,
    "Sales Drop",
    each if [Index] = 1 then null else [Sales] < AddIndex[Sales]{[Index] - 2},
    type logical
  ),
  AddGroupColumn = Table.AddColumn(
    AddSalesDropFlag,
    "Group",
    each if [Sales Drop] = true then [Index] else null
  ),
  FillDownGroup = Table.FillDown(AddGroupColumn, {"Group"}),
  GroupedData = Table.Group(
    FillDownGroup,
    {"Group"},
    {
      {
        "Date Range",
        each
          let
            StartDate = List.Min([Date]),
            EndDate   = List.Max([Date])
          in
            if StartDate = EndDate then
              DateTime.ToText(StartDate, "dd/MM/yyyy")
            else
              Text.Combine(
                {DateTime.ToText(StartDate, "dd/MM/yyyy"), DateTime.ToText(EndDate, "dd/MM/yyyy")},
                " - "
              ),
        type text
      },
      {"Total Sales", each List.Sum([Sales]), type number}
    }
  ),
  #"Removed Columns" = Table.RemoveColumns(GroupedData, {"Group"})
in
  #"Removed Columns"
_x000D_
_x000D_
Power Query solution 13 for Custom Grouping! Part 3, proposed by Seokho MOON:
let
  Source = Excel.CurrentWorkbook(){[Name = "Table1"]}[Content],
  AddCol = Table.AddColumn(
    Source,
    "Temp",
    each try [Sales] - Source[Sales]{List.PositionOf(Source[Date], [Date]) - 1} otherwise [Sales]
  ),
  Group = Table.Group(AddCol, "Temp", {"All", F_1}, 0, (x, y) => Number.From(y < 0))[All],
  F_1 = each Table.Group(_, {}, {{"Group", F_2}, {"Total Sales", each List.Sum([Sales])}}),
  F_2 = each [
    L = List.Distinct({List.Min([Date]), List.Max([Date])}),
    T = List.Transform(L, each DateTime.ToText(_, "d/M/yyyy")),
    R = Text.Combine(T, "-")
  ][R],
  Res = Table.Combine(Group)
in
  Res
_x000D_
_x000D_
Power Query solution 14 for Custom Grouping! Part 3, proposed by Glyn Willis:
let
  Source = Excel.CurrentWorkbook(){[Name = "Table1"]}[Content],
  #"Changed Type" = Table.TransformColumnTypes(Source, {{"Date", type date}, {"Sales", Int64.Type}}),
  #"Grouped Rows" = Table.Group(
    #"Changed Type",
    {"Date", "Sales"},
    {
      {
        "Group",
        each Date.ToText(List.First([Date])) & "-" & Date.ToText(List.Last([Date])),
        type nullable text
      },
      {"Total Sales", each (List.Sum([Sales])), type nullable number}
    },
    GroupKind.Local,
    (CurrentRow, NextRow) =>
      let
        _Date     = NextRow[Date],
        _Sales    = NextRow[Sales],
        _PrvSales = #"Changed Type"{[Date = Date.AddDays(_Date, - 1)]}[Sales]
      in
        Number.From(_Sales < _PrvSales)
  )[[Group], [Total Sales]]
in
  #"Grouped Rows"
_x000D_
Solving the challenge of Custom Grouping! Part 3 with Excel
_x000D_
Excel solution 1 for Custom Grouping! Part 3, proposed by Bo Rydobon 🇹🇭:
=LET(
    s,
    C3:C26,
    DROP(
        GROUPBY(
            SCAN(
                0,
                TOCOL(
                    s
_x000D_
_x000D_
Excel solution 2 for Custom Grouping! Part 3, proposed by محمد حلمي:
=REDUCE(
    G2:H2,
    C3:C26,
    LAMBDA(
        a,
        v,
        LET(

            j,
            TEXT(
                OFFSET(
                    v,
                    ,
                    -1
                ),
                "d/m/e"
            ),

            IF(
                v>OFFSET(
                    v,
                    -1,

                ),

                VSTACK(
                    DROP(
                        a,
                        -1
                    ),
                    HSTACK(

                        TEXTSPLIT(
                            TAKE(
                                a,
                                -1,
                                1
                            ),
                            "-"
                        )&"-"&j,
                        TAKE(
                            a,
                            -1,
                            -1
                        )+v
                    )
                ),

                VSTACK(
                    a,
                    HSTACK(
                        j,
                        v
                    )
                )
            )
        )
    )
)
_x000D_
_x000D_
Excel solution 3 for Custom Grouping! Part 3, proposed by محمد حلمي:
=REDUCE(
    G2:H2,
    C3:C26,
    LAMBDA(
        a,
        v,
        LET(

            j,
            TEXT(
                OFFSET(
                    v,
                    ,
                    -1
                ),
                "d/m/e"
            ),

            IF(
                v>OFFSET(
                    v,
                    -1,

                ),

                VSTACK(
                    DROP(
                        a,
                        -1
                    ),
                    HSTACK(

                        TEXTBEFORE(
                            TAKE(
                                a,
                                -1,
                                1
                            )&"-",
                            "-"
                        )&"-"&j,
                        TAKE(
                            a,
                            -1,
                            -1
                        )+v
                    )
                ),

                VSTACK(
                    a,
                    HSTACK(
                        j,
                        v
                    )
                )
            )
        )
    )
)
_x000D_
_x000D_
Excel solution 4 for Custom Grouping! Part 3, proposed by Oscar Mendez Roca Farell:
=LET(
    b,
     B3:B26,
     c,
     C3:C26,
     t,
     FILTER(
         DAY(
             b
         ),
         c>C4:C27
     ),
     F,
     LAMBDA(
         x,
          y,
          MAP(
              t,
               t-DROP(
                   VSTACK(
                       0,
                        t
                   ),
                   -1
               ),
               LAMBDA(
                   i,
                    j,
                    LET(
                        m,
                         TAKE(
                             TAKE(
                                 x,
                                  i
                             ),
                             -j
                         ),
                         IF(
                             y,
                              TEXTJOIN(
                                  "-",
                                   ,
                                   TEXT(
                                       UNIQUE(
                                           VSTACK(
                                               @+m,
                                                MAX(
                                                    m
                                                )
                                           )
                                       ),
                                        "d/m/e"
                                   )
                              ),
                              SUM(
                                                    m
                                                )
                         )
                    )
               )
          )
     ),
     HSTACK(
         F(
             b,
              1
         ),
          F(
              c,

          )
     )
)
_x000D_
_x000D_
Excel solution 5 for Custom Grouping! Part 3, proposed by Julian Poeltl:
=LET(Dt,
    B3:B26,
    S,
    C3:C26,
    D,
    VSTACK(0,
    DROP((DROP(
        S,
        1
    )-S)<0,
    -1)),
    R,
    SCAN(
        1,
        D,
        LAMBDA(
            A,
            B,
            A+B
        )
    ),
    REDUCE(
        HSTACK(
            "Group",
            "Total Sales"
        ),
        UNIQUE(
            R
        ),
        LAMBDA(
            A,
            B,
            VSTACK(
                A,
                LET(
                    G,
                    TEXT(
                        FILTER(
                            Dt,
                            R=B
                        ),
                        "D/M/YYYY"
                    ),
                    HSTACK(
                        IF(
                            ROWS(
                                G
                            )>1,
                            TAKE(
                                G,
                                1
                            )&"-"&TAKE(
                                G,
                                -1
                            ),
                            G
                        ),
                        SUM(
                            FILTER(
                                S,
                                R=B
                            )
                        )
                    )
                )
            )
        )
    ))
_x000D_
_x000D_
Excel solution 6 for Custom Grouping! Part 3, proposed by Kris Jaganah:
=LET(a,
    B3:B26,
    b,
    C3:C26,
    c,
    b-VSTACK(
        0,
        DROP(
            b,
            -1
        )
    ),
    d,
    SCAN(0,
    c,
    LAMBDA(x,
    y,
    IF((y<0)*(x>=0),
    x+1,
    x))),
    e,
    TEXT(
        XLOOKUP(
            d,
            d,
            a
        ),
        "dd/mm/yyyy"
    ),
    f,
    TEXT(
        XLOOKUP(
            d,
            d,
            a,
            ,
            ,
            -1
        ),
        "dd/mm/yyyy"
    ),
    g,
    IF(
        e=f,
        e,
        e&"-"&f
    ),
    GROUPBY(
        g,
        b,
        SUM,
        0,
        0
    ))
_x000D_
_x000D_
Excel solution 7 for Custom Grouping! Part 3, proposed by John Jairo Vergara Domínguez:
=DROP(
    GROUPBY(
        SCAN(
            0,
            C2:C25>C3:C26,
            SUM
        ),
        B3:C26,
        HSTACK(
            LAMBDA(
                x,
                TEXT(
                    @x,
                    "d/m/e"
                )&REPT(
                    TEXT(
                        MAX(
                            x
                        ),
                        "-d/m/e"
                    ),
                    ROWS(
                            x
                        )>1
                )
            ),
            SUM
        ),
        ,
        0
    ),
    1,
    1
)
_x000D_
_x000D_
Excel solution 8 for Custom Grouping! Part 3, proposed by Imam Hambali:
=LET(    d,
     B3:B26,    s,
     C3:C26,    ds,
     VSTACK(
         9999,
          DROP(
              s,
              -1
          )
     ),    ss,
     SCAN(
         0,
         IF(
             s-ds<0,
             1,
             0
         ),
          LAMBDA(
              x,
              y,
               x+y
          )
     ),    gb,
     GROUPBY(
         ss,
         HSTACK(
             d,
             s
         ),
         HSTACK(
             LAMBDA(
                 x,
                  IF(
                      MIN(
                          x
                      )=MAX(
                          x
                      ),
                       TEXT(
                           MIN(
                          x
                      ),
                           "dd/mm/yyyy"
                       ),
                       TEXT(
                           MIN(
                          x
                      ),
                           "dd/mm/yyyy"
                       )&"-"&TEXT(
                           MAX(
                          x
                      ),
                           "dd/mm/yyyy"
                       )
                  )
             ),
              SUM
         ),
         0,
         0
     ),    VSTACK(
        {"Group",
        "Total Sales"},
         DROP(
             gb,
             1,
             1
         )
    ))
_x000D_
_x000D_
Excel solution 9 for Custom Grouping! Part 3, proposed by Sunny Baggu:
=LET(
 d,
     B3:B26, s,
     C3:C26, _a,
     VSTACK(
         0,
          N(
              DROP(
                  s,
                   1
              ) > DROP(
                  s,
                   -1
              )
          )
     ), _b,
     FILTER(
         d,
          1 - _a
     ), _c,
     VSTACK(
         DROP(
             _b,
              1
         ) - 1,
          TAKE(
              d,
               -1
          )
     ), _d,
     MAP(_b,
     _c,
     LAMBDA(a,
     b,
     SUM((d >= a) * (d <= b) * s))), _f,
     "m/d/yyyy", HSTACK(
     IF(
         _b = _c,
          TEXT(
              _b,
               _f
          ),
          TEXT(
              _b,
               _f
          ) & "-" & TEXT(
              _c,
               _f
          )
     ),
      _d
 )
)
_x000D_
_x000D_
Excel solution 10 for Custom Grouping! Part 3, proposed by Asheesh Pahwa:
=LET(

    d,

    B3:B26,

    sal,

    C3:C26,

    s,

    SCAN(

        0,

        sal,

        LAMBDA(

            x,

            y,

            IF(

                y""

    ),

    xl,

    XLOOKUP(

        f,

        sal,

        d

    ),

    m,

    VSTACK(

        DROP(

            xl,

            1

        )-1,

        MAX(

            d

        )

    ),    h,

    HSTACK(

        xl,

        m

    ),

    r,

    DROP(

        REDUCE(

            "",

            SEQUENCE(

                ROWS(

                    m

                )

            ),

            LAMBDA(

                x,

                y,

                VSTACK(

                    x,

                    LET(

                        I,

                        INDEX(

                            h,

                            y,
                        ),

                        t,

                        @TAKE(

                            I,

                            ,

                            1

                        ),

                        _t,

                        @TAKE(

                            I,

                            ,

                            -1

                        ),

                        s,

                        SEQUENCE(

                            _t-t+1,

                            ,

                            t

                        ),

                        HSTACK(

                            IF(

                                COUNTA(

                                    s

                                )>1,