Challenge No. 33: Questionnaires are a common method for collecting data, but they are susceptible to noise from respondents who fill them out randomly.
Solved using:Excel, Power Query, Python, and R.
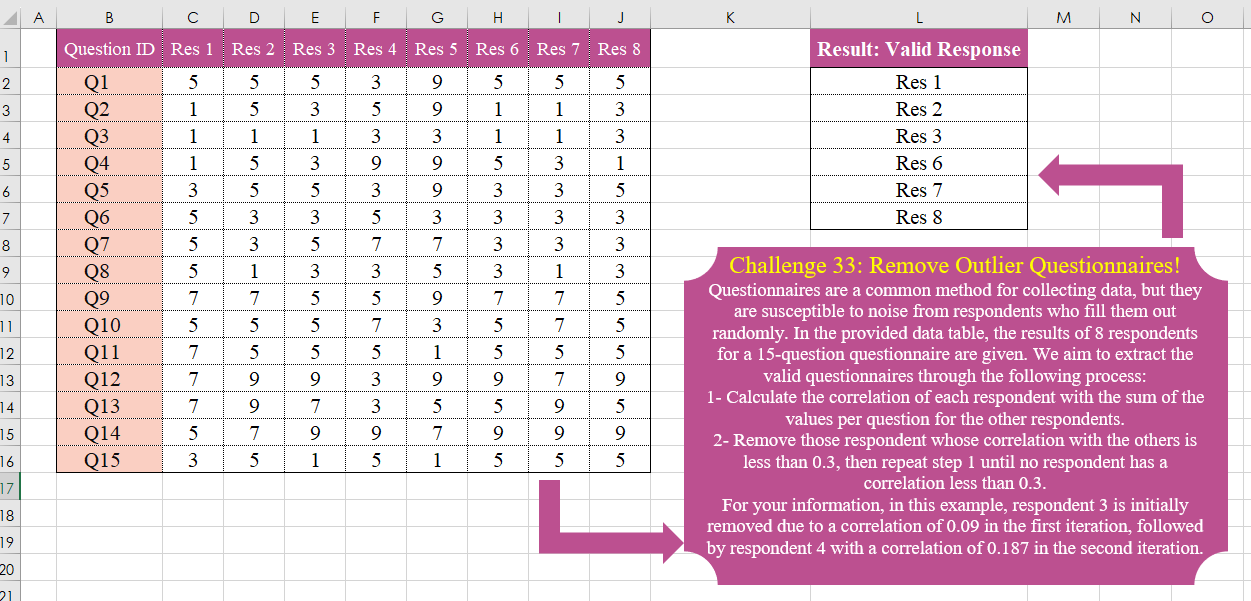
Creates custom reusable functions in Excel.
Challenge No. 33: Questionnaires are a common method for collecting data, but they are susceptible to noise from respondents who fill them out randomly.
Solved using:Excel, Power Query, Python, and R.
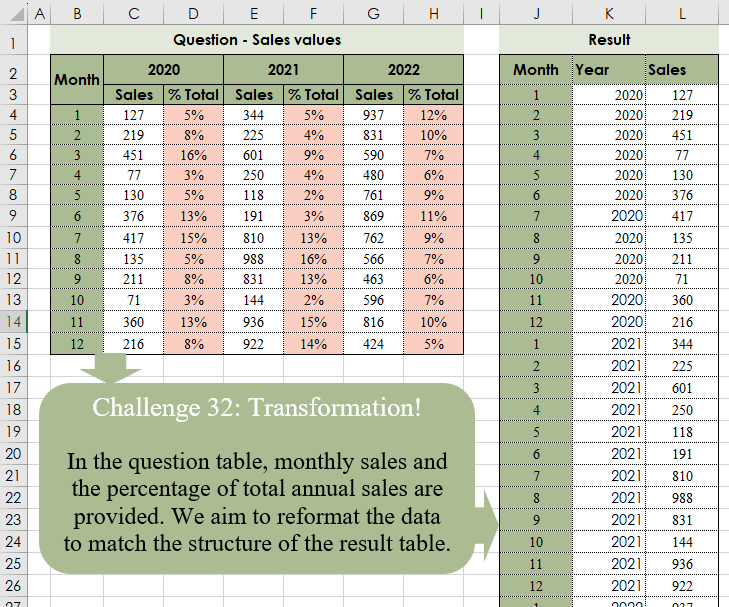
Challenge No. 32: In the question table, monthly sales and the percentage of total annual sales are provided.
Solved using:Excel (CHOOSECOLS, CHOOSEROWS, DROP), Power Query (Table.Column, Table.ColumnNames, Table.Sort), Python, and R.
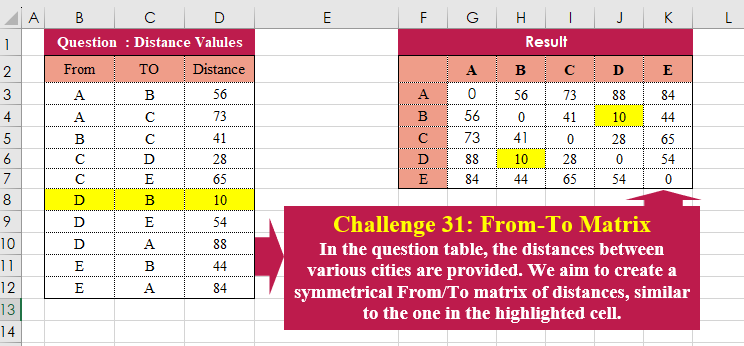
Challenge No. 31: In the question table, the distances between various cities are provided.
Solved using:Excel (HSTACK, LAMBDA, LET), Power Query (Table.Column, Table.ColumnNames), Python, and R.
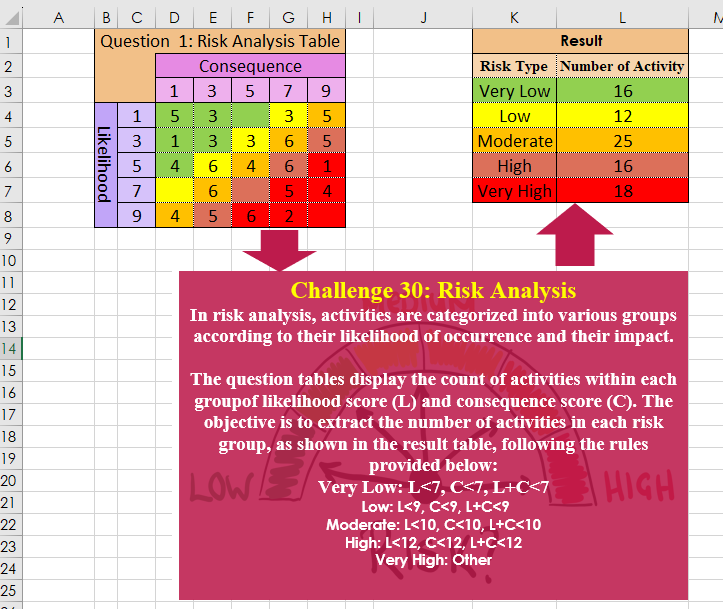
Challenge No. 30: In risk analysis, activities are categorized into various groups according to their likelihood of occurrence and their impact.
Solved using:Excel, Power Query, Python, and R.
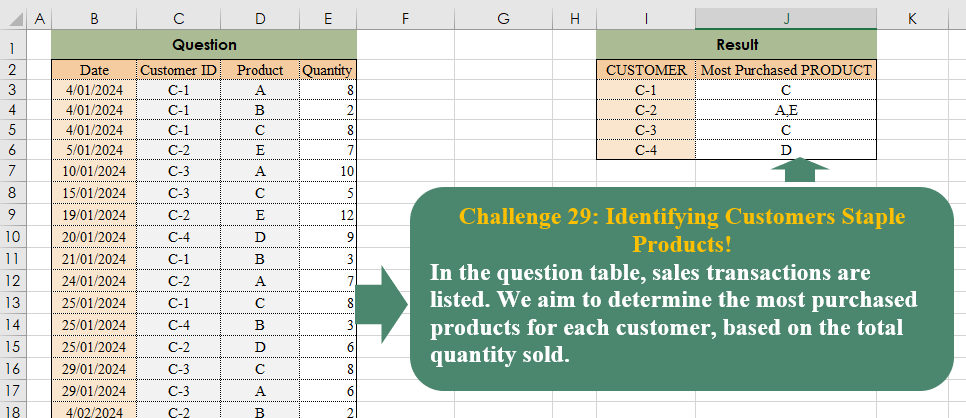
Challenge No. 29: In the question table, sales transactions are listed.
Solved using:Excel (CHOOSECOLS, FILTER, HSTACK), Power Query (Text.Combine, Table.Group), Python, and R.
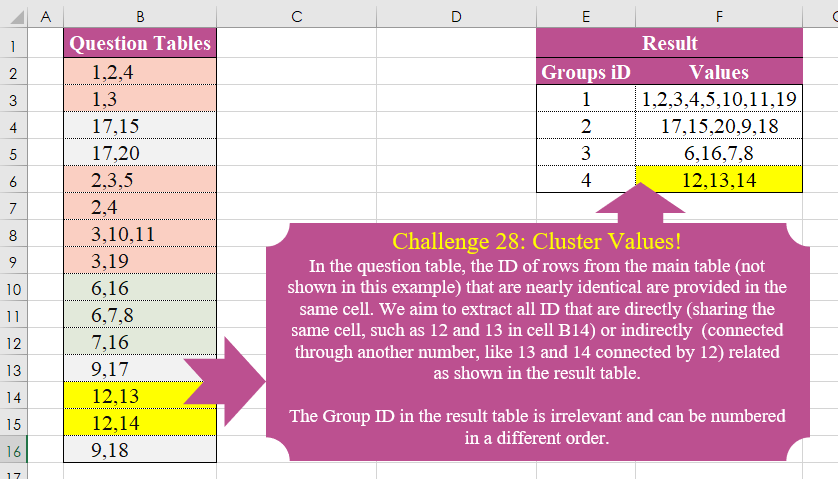
Challenge No. 28: In the question table, the ID of rows from the main table (not shown in this example) that are nearly identical are provided in the same cell.
Solved using:Excel (DROP, FILTER, HSTACK), Power Query (List.Transform), Python, and R.
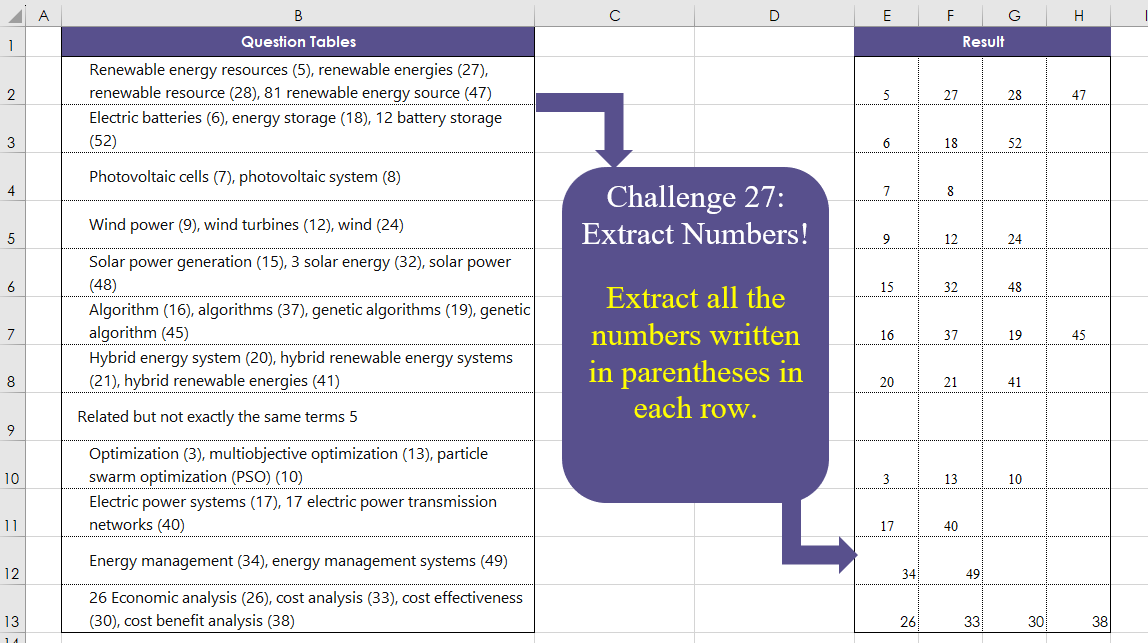
Challenge No. 27: Extract all the numbers written in parentheses in each row.
Solved using:Excel (DROP, IFERROR, IFNA), Power Query (List.Transform, Text.BetweenDelimiters, Table.AddColumn), Python, and R.

Challenge No. 26: The provided question table contains information regarding the amount of time individuals spend in meetings with each other, and we want to generate a result table that displays the percentage of time each person (G3:G7) spends with others (H2:L2), ensuring that the sum of each row equals 100%.
Solved using:Excel (HSTACK, INDEX, LAMBDA), and Power Query (Table.AddColumn).
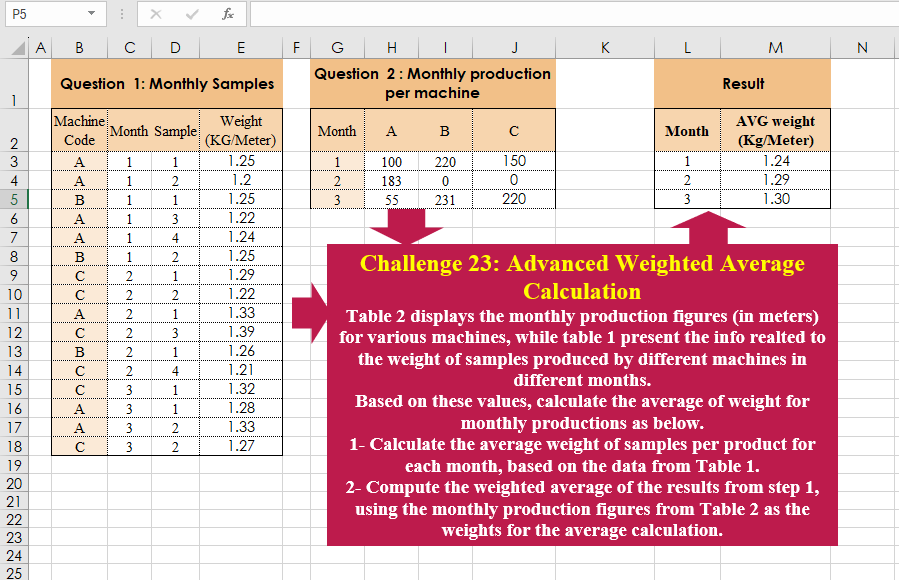
Challenge No. 23: Table 2 displays the monthly production figures (in meters) for various machines, while table 1 present the info realted to the weight of samples produced by different machines in different months.
Solved using:Excel (CHOOSECOLS, HSTACK, LAMBDA), Power Query (Table.AddColumn, Table.Group), and R.
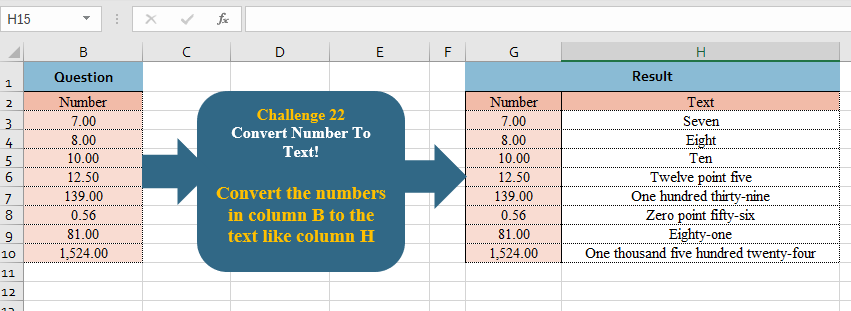
Challenge No. 22: Convert the numbers in column B to the text like column H
.
Solved using:Excel, Power Query, and R.