
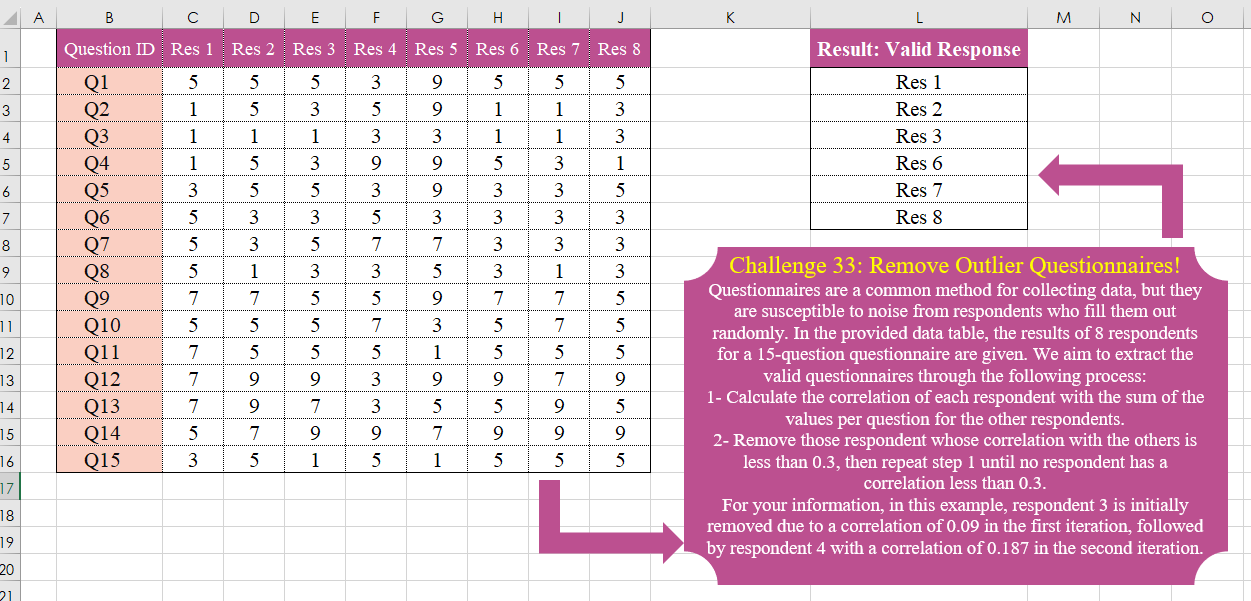
Questionnaires are a common method for collecting data, but they are susceptible to noise from respondents who fill them out randomly. In the provided data table, the results of 8 respondents for a 15-question questionnaire are given. We aim to extract the valid questionnaires through the following process: 1- Calculate the correlation of each respondent with the sum of the values per question for the other respondents. 2- Remove those respondent whose correlation with the others is less than 0.3, then repeat step 1 until no respondent has a correlation less than 0.3. For your information, in this example, respondent 3 is initially removed due to a correlation of 0.09 in the first iteration, followed by respondent 4 with a correlation of 0.187 in the second iteration.
📌 Challenge Details and Links
Challenge Number: 33
Challenge Difficulty: ⭐⭐⭐⭐
📥Download Sample File
📥Link to the solutions on LinkedIn
Solving the challenge of Remove Outlier Questionnaires! with Power Query
Power Query solution 1 for Remove Outlier Questionnaires!, proposed by Omid Motamedisedeh:
let
 Source = Excel.CurrentWorkbook(){[Name="Table1"]}[Content],
 Lists= List.Skip(Table.ToColumns(Source)),
 R=GX(Lists),
 F=List.Transform(List.PositionOfAny(Lists,R,2),each "Res " & Text.From(_+1)),

//Define Correlation Function
COR= (a,b)=>List.Covariance(a,b)/(List.StandardDeviation(a)*List.StandardDeviation(b)),

// Define recursive cycle
GX=(a)=>
 let
 b=List.Transform(List.Positions(a), each COR(a{_},List.Transform(List.Zip(List.RemoveRange(a,_)), List.Sum))),
 c=if List.MatchesAll(b,each _>0.3) then a else @GX(List.RemoveRange(a,List.PositionOf(b,List.Min(b))))
 in
 c

 in
 F
Solving the challenge of Remove Outlier Questionnaires! with Excel
Excel solution 1 for Remove Outlier Questionnaires!, proposed by Bo Rydobon 🇹🇭:
=LET(
    z,
    C2:J16,
    TOCOL(
        IFS(
            BYCOL(
                z,
                LAMBDA(
                    r,
                    CORREL(
                        r,
                        BYROW(
                            z,
                            SUM
                        )-r
                    )
                )
            )>0.3,
            C1:J1
        ),
        3
    )
)


B: Remove min correl until no correl <0.3

=TOCOL(
    REDUCE(
        C1:J1,
        C1:J1,
        LAMBDA(
            r,
            i,
            LET(
                z,
                CHOOSECOLS(
                    C2:J16,
                    --RIGHT(
                        r
                    )
                ),
                c,
                BYCOL(
                z,
                LAMBDA(
                    r,
                    CORREL(
                        r,
                        BYROW(
                            z,
                            SUM
                        )-r
                    )
                )
            ),
                IF(
                    OR(
                        c<0.3
                    ),
                    FILTER(
                        r,
                        c>MIN(
                            c
                        )
                    ),
                    r
                )
            )
        )
    )
)
Excel solution 2 for Remove Outlier Questionnaires!, proposed by 🇰🇷 Taeyong Shin:
=LET(
    d,
    C2:J16,
    s,
    SEQUENCE(
        8
    ),
    FILTER(
        "Res"&s,
        MAP(
            s,
            LAMBDA(
                n,
                LET(
                    c,
                    INDEX(
                        d,
                        ,
                        n
                    ),
                    CORREL(
                        c,
                        BYROW(
                            FILTER(
                                d,
                                XLOOKUP(
                                    TOROW(
                                        s
                                    ),
                                    n,
                                    0,
                                    1
                                )
                            ),
                            SUM
                        )
                    )>0.3
                )
            )
        )
    )
)
Excel solution 3 for Remove Outlier Questionnaires!, proposed by Oscar Mendez Roca Farell:
=LET(
    d,
     C2:J16,
     TOCOL(
         IFS(
             BYCOL(
                 d,
                  LAMBDA(
                      c,
                       CORREL(
                           c,
                            BYROW(
                                d,
                                 LAMBDA(
                                     r,
                                      SUM(
                                          r
                                      )
                                 )
                            )-c
                       )
                  )
             )>0.3,
              C1:J1
         ),
          2
     )
)
Excel solution 4 for Remove Outlier Questionnaires!, proposed by Julian Poeltl:
=LET(
    T,
    B1:J16,
    TT,
    DROP(
        T,
        1,
        1
    ),
    QS,
    BYROW(
        TT,
        LAMBDA(
            A,
            SUM(
                A
            )
        )
    ),
    C,
    MAP(
        SEQUENCE(
            ,
            8
        ),
        LAMBDA(
            A,
            CORREL(
                QS-CHOOSECOLS(
                    TT,
                    A
                ),
                CHOOSECOLS(
                    TT,
                    A
                )
            )
        )
    ),
    TRANSPOSE(
        FILTER(
            TAKE(
                T,
                1,
                -8
            ),
            C>0.3
        )
    )
)
Excel solution 5 for Remove Outlier Questionnaires!, proposed by Kris Jaganah:
=LET(
    a,
    C1:J1,
    b,
    C2:J16,
    TOCOL(
        FILTER(
            a,
            BYCOL(
                VSTACK(
                    b,
                    BYROW(
                        b,
                        SUM
                    )-b
                ),
                LAMBDA(
                    x,
                    CORREL(
                        TAKE(
                            x,
                            15
                        ),
                        TAKE(
                            x,
                            -15
                        )
                    )
                )
            )>0.3
        )
    )
)
Excel solution 6 for Remove Outlier Questionnaires!, proposed by John Jairo Vergara Domínguez:
=TOCOL(
    IFS(
        BYCOL(
            C2:J16,
            LAMBDA(
                y,
                CORREL(
                    y,
                    BYROW(
                        C2:J16,
                        SUM
                    )-y
                )
            )
        )>=0.3,
        C1:J1
    ),
    2
)
Excel solution 7 for Remove Outlier Questionnaires!, proposed by Sunny Baggu:
=LET(     _r,
     TOCOL(
         C1:J1
     ),     _c,
     MAP(          _r,          LAMBDA(
              t,

               CORREL(

                    TOCOL(
                        IF(
                            C1:J1 = t,
                             C2:J16,
                             x
                        ),
                         3
                    ),

                    BYROW(
                        IF(
                            C1:J1 <> t,
                             C2:J16,

                        ),
                         LAMBDA(
                             a,
                              SUM(
                                  a
                              )
                         )
                    )

               )

          )     ),     FILTER(
         _r,
          _c > 0.3
     ))
Excel solution 8 for Remove Outlier Questionnaires!, proposed by Gabriel Raigosa:
=TOCOL(FILTER(C1:J1,IFERROR(BYCOL(C2:J16,LAMBDA(x,CORREL(x,BYROW(C2:J16,LAMBDA(x,SUM(x)))-x))),0)>0.3))

 🔹ES:
=ENCOL(FILTRAR(C1:J1,SI.ERROR(BYCOL(C2:J16,LAMBDA(x,COEF.DE.CORREL(x,BYROW(C2:J16,LAMBDA(x,SUMA(x)))-x))),0)>0.3))
Excel solution 9 for Remove Outlier Questionnaires!, proposed by LUIS FLORENTINO COUTO CORTEGOSO:
=LET(
    fr,
    LAMBDA(
        n,
        LET(
            m,
            DROP(
                n,
                1
            ),
            r,
            SEQUENCE(
                COLUMNS(
                    m
                )
            ),
            s,
            BYROW(
                m,
                SUM
            ),
            f,
            TOCOL(
                MAP(
                    r,
                    LAMBDA(
                        x,
                        LET(
                            y,
                            CHOOSECOLS(
                                m,
                                x
                            ),
                            CORREL(
                                y,
                                s-y
                            )
                        )
                    )
                )>0.3
            ),
            CHOOSECOLS(
                n,
                TOROW(
                    r*f/f,
                    3
                )
            )
        )
    ),
    TOCOL(
        TAKE(
            REDUCE(
                C1:J16,
                SEQUENCE(
                    4
                ),
                LAMBDA(
                    a,
                    x,
                    fr(
                        a
                    )
                )
            ),
            1
        )
    )
)
Solving the challenge of Remove Outlier Questionnaires! with Python
Python solution 1 for Remove Outlier Questionnaires!, proposed by Konrad Gryczan, PhD:
import pandas as pd

input = pd.read_excel("CH-033 Noise Removing.xlsx", sheet_name="Sheet1",  usecols="B:J", nrows = 16)
test = pd.read_excel("CH-033 Noise Removing.xlsx", sheet_name="Sheet1",  usecols="L:L", nrows = 6)
test.columns = ["respondent"]

r1 = input.drop(columns=['Question ID']).apply(lambda x: x.corr(input.iloc[:, 1:].sum(axis=1) - x)).to_frame().reset_index()
r1.columns = ["respondent", "correlation"]
r1 = r1[r1["correlation"] > 0.3][["respondent"]].reset_index(drop=True)

print(r1.equals(test)) # True
Solving the challenge of Remove Outlier Questionnaires! with R
R solution 1 for Remove Outlier Questionnaires!, proposed by Konrad Gryczan, PhD:
library(tidyverse)
library(readxl)

input = read_excel("files/CH-033 Noise Removing.xlsx", range = "B1:J16")
test = read_excel("files/CH-033 Noise Removing.xlsx", range = "L1:L7")
colnames(test) = "respondent"

r1 = input %>%
 summarize(across(-c(1), ~cor(.x, rowSums(input[,-1]) - .x))) %>%
 pivot_longer(cols = everything(), names_to = "respondent", values_to = "correlation") %>%
 filter(correlation > 0.3) %>%
 select(respondent)