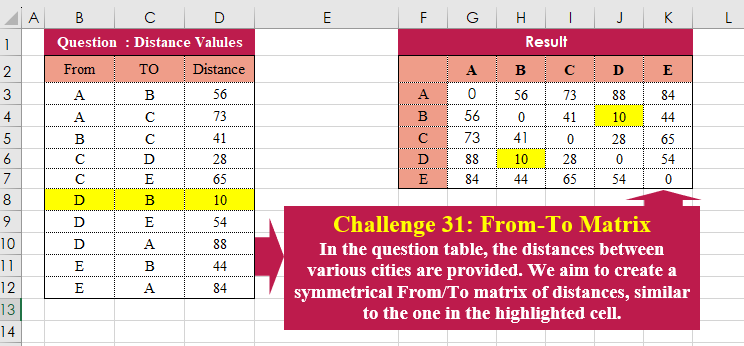
Challenge No. 31: In the question table, the distances between various cities are provided.
Solved using:Excel (HSTACK, LAMBDA, LET), Power Query (Table.Column, Table.ColumnNames), Python, and R.
Solutions categorized by software used.
Challenge No. 31: In the question table, the distances between various cities are provided.
Solved using:Excel (HSTACK, LAMBDA, LET), Power Query (Table.Column, Table.ColumnNames), Python, and R.
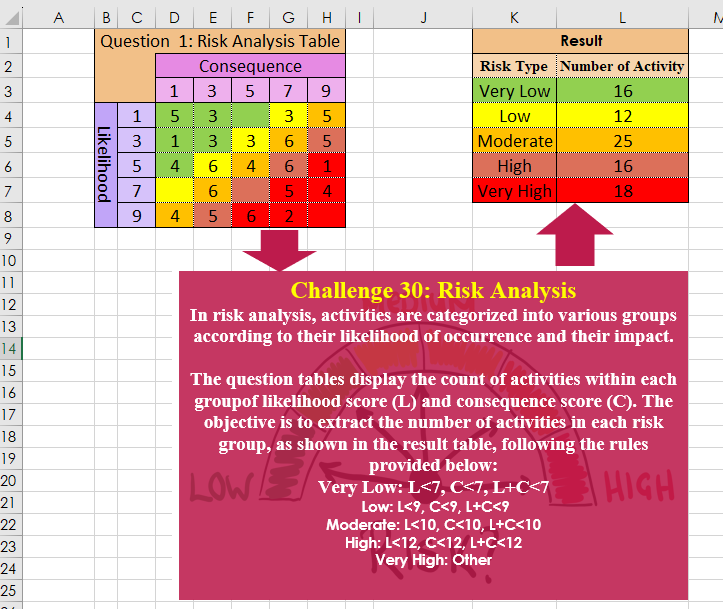
Challenge No. 30: In risk analysis, activities are categorized into various groups according to their likelihood of occurrence and their impact.
Solved using:Excel, Power Query, Python, and R.
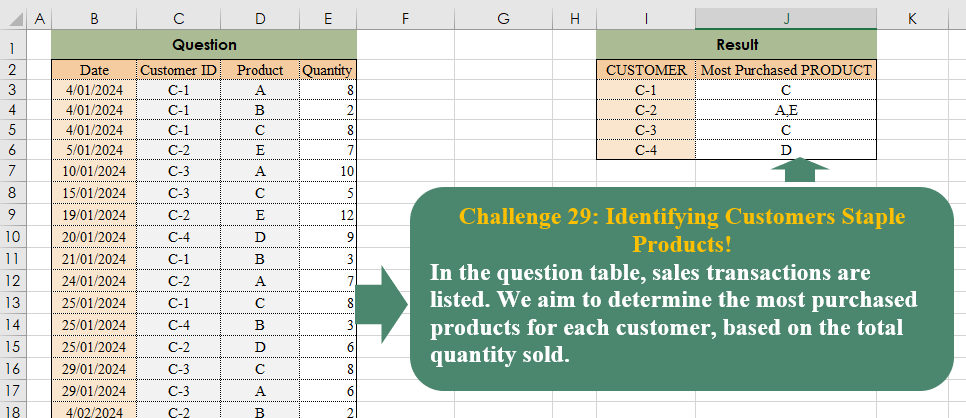
Challenge No. 29: In the question table, sales transactions are listed.
Solved using:Excel (CHOOSECOLS, FILTER, HSTACK), Power Query (Text.Combine, Table.Group), Python, and R.
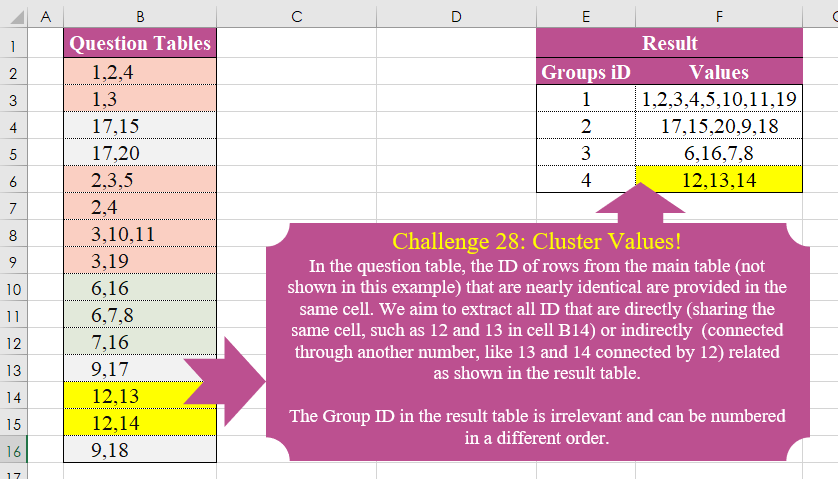
Challenge No. 28: In the question table, the ID of rows from the main table (not shown in this example) that are nearly identical are provided in the same cell.
Solved using:Excel (DROP, FILTER, HSTACK), Power Query (List.Transform), Python, and R.
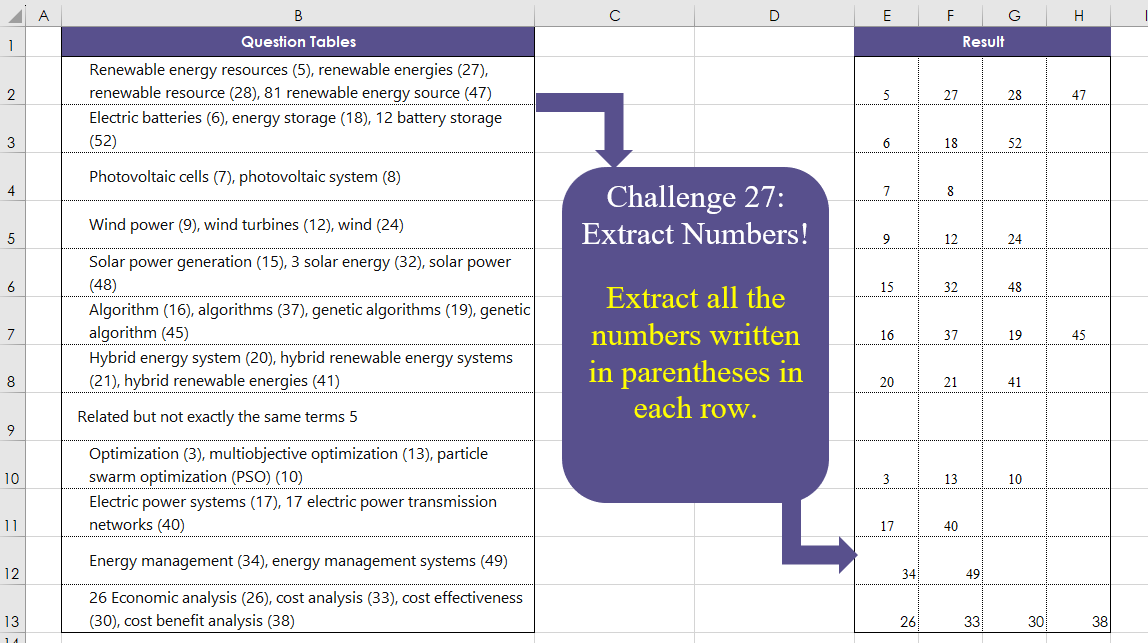
Challenge No. 27: Extract all the numbers written in parentheses in each row.
Solved using:Excel (DROP, IFERROR, IFNA), Power Query (List.Transform, Text.BetweenDelimiters, Table.AddColumn), Python, and R.

Challenge No. 26: The provided question table contains information regarding the amount of time individuals spend in meetings with each other, and we want to generate a result table that displays the percentage of time each person (G3:G7) spends with others (H2:L2), ensuring that the sum of each row equals 100%.
Solved using:Excel (HSTACK, INDEX, LAMBDA), and Power Query (Table.AddColumn).
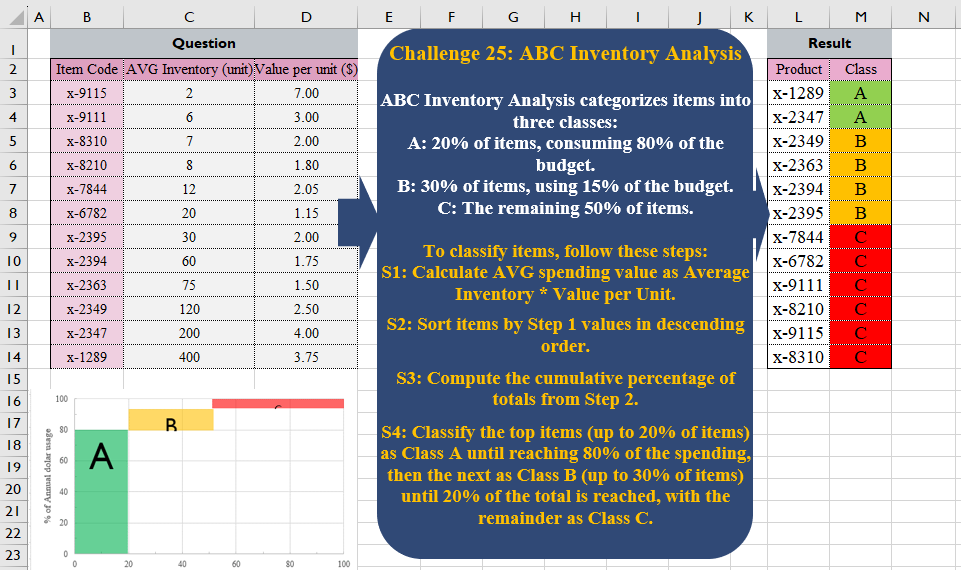
Challenge No. 25: ABC Inventory Analysis categorizes items into three classes:
A: 20% of items, consuming 80% of the budget.
Solved using:Excel (CHOOSECOLS, HSTACK, LET), Power Query (Table.AddColumn), Python, and R.
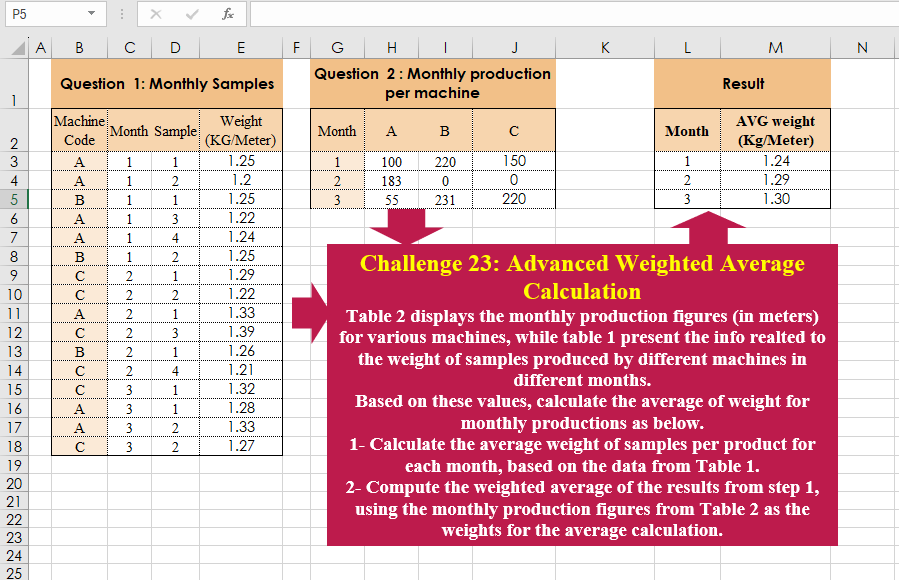
Challenge No. 23: Table 2 displays the monthly production figures (in meters) for various machines, while table 1 present the info realted to the weight of samples produced by different machines in different months.
Solved using:Excel (CHOOSECOLS, HSTACK, LAMBDA), Power Query (Table.AddColumn, Table.Group), and R.
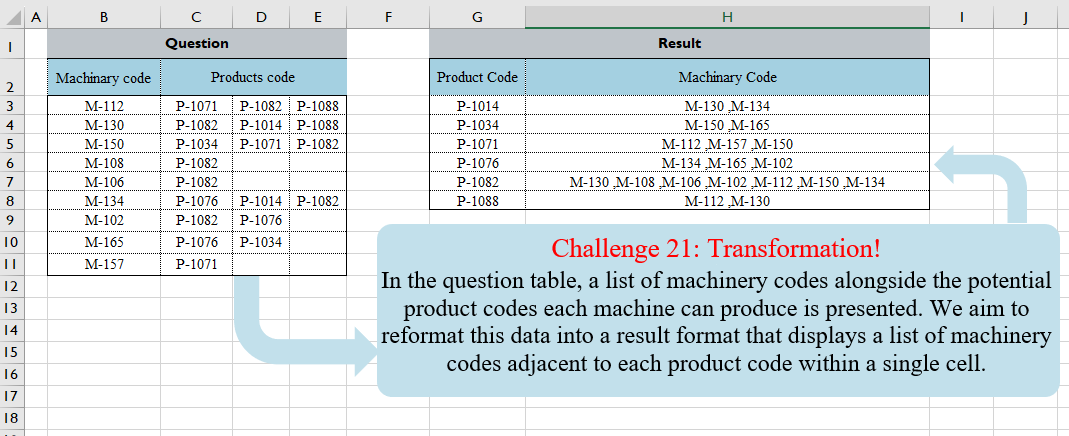
Challenge No. 21: In the question table, a list of machinery codes alongside the potential product codes each machine can produce is presented.
Solved using:Excel (FILTER, HSTACK, LAMBDA), Power Query (Text.Combine, Table.Group, Table.Sort), and R.
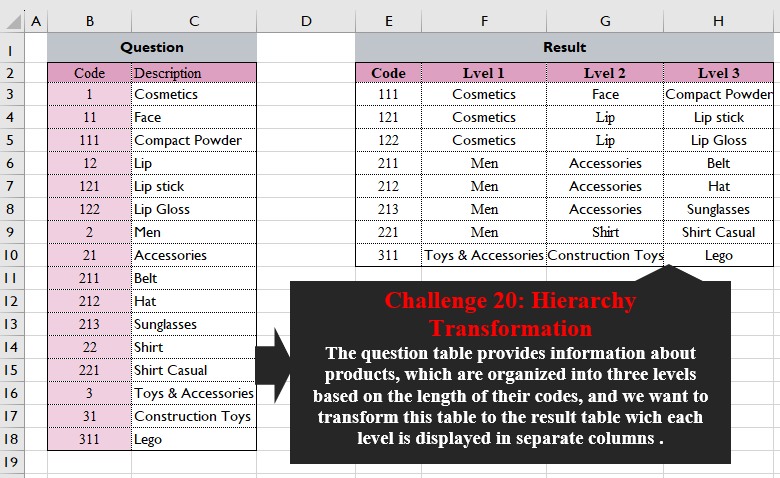
Challenge No. 20: The question table provides information about products, which are organized into three levels based on the length of their codes, and we want to transform this table into the result table wich each level is displayed in separate columns.
Solved using:Excel (FILTER, HSTACK, LEFT), Power Query (List.Transform), Python, and R.