
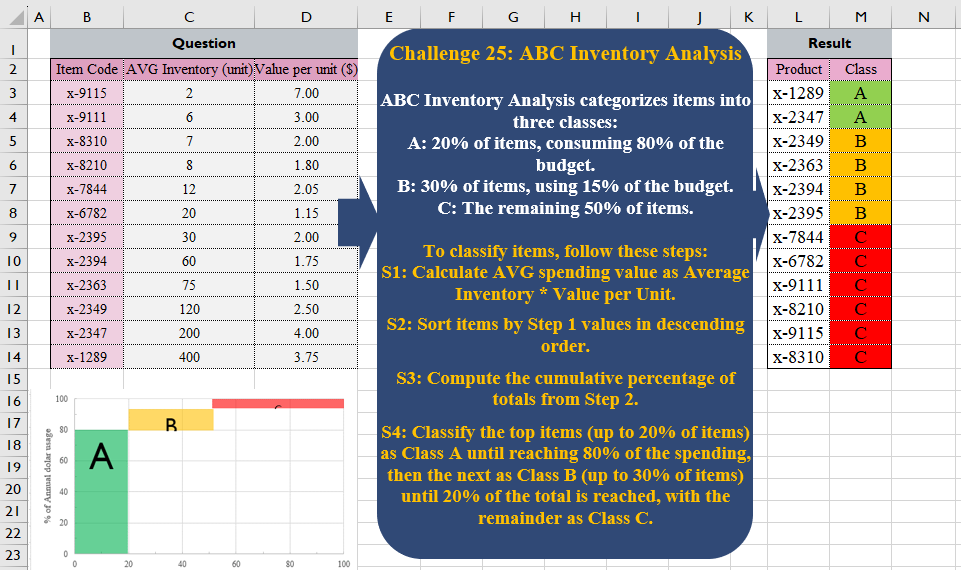
ABC Inventory Analysis categorizes items into three classes: A: 20% of items, consuming 80% of the budget. B: 30% of items, using 15% of the budget. C: The remaining 50% of items. To classify items, follow these steps: S1: Calculate AVG spending value as Average Inventory * Value per Unit. S2: Sort items by Step 1 values in descending order. S3: Compute the cumulative percentage of totals from Step 2. S4: Classify the top items (up to 20% of items) as Class A until reaching 80% of the spending, then the next as Class B (up to 30% of items) until 20% of the total is reached, with the remainder as Class C.
📌 Challenge Details and Links
Challenge Number: 25
Challenge Difficulty: ⭐⭐
📥Download Sample File
📥Link to the solutions on LinkedIn
Solving the challenge of Abc Inventory Analysis with Power Query
Power Query solution 1 for Abc Inventory Analysis, proposed by Eric Laforce:
let
  Source = Excel.CurrentWorkbook(){[Name = "Table1"]}[Content],
  Add_Value = Table.AddColumn(
    Source,
    "Value",
    each [#"AVG Inventory (unit)"] * [#"Value per unit ($)"],
    type number
  ),
  Sort = Table.Sort(Add_Value, {"Value", Order.Descending}),
  Classify =
    let
      V = Sort[Value],
      Total = List.Sum(V),
      NbItem = List.Count(V),
      Class = List.Generate(
        () => [i = 0, CPT = 0, PI = 0, C = "A"],
        each [i] <= NbItem,
        each
          let
            _CPT = [CPT] + V{[i]} / Total,
            _PI = ([i] + 1) / NbItem,
            _Class =
              if (_CPT <= .8 and _PI <= .2) then
                "A"
              else if (_CPT <= .95 and _PI <= .5) then
                "B"
              else
                "C"
          in
            [i = [i] + 1, CPT = _CPT, PI = _PI, C = _Class],
        each [C]
      )
    in
      Table.FromColumns({Sort[Item Code], List.Skip(Class)}, {"Product", "Class"})
in
  Classify
Power Query solution 2 for Abc Inventory Analysis, proposed by Ramiro Ayala Chávez:
let
S = Excel.CurrentWorkbook(){[Name="Table1"]}[Content],
a = Table.Sort(Table.AddColumn(S,"P", each [#"AVG Inventory (unit)"]*[#"Value per unit ($)"]),{{"P",1}}),
b = Table.AddColumn(a,"Q", each [P]/List.Sum(a[P])),
c = Table.AddIndexColumn(b,"I",1),
d = Table.AddColumn(c,"R", each List.Sum(List.Range(c[Q],0,[I]))),
e = Table.AddColumn(d,"S", each ([I])/Table.RowCount(d)),
f = Table.AddColumn(e, "Class", each if [S]<=0.2 or [R]<=0.8 then "A" else if [S]<=0.5 or [R]<=0.95 then "B" else "C")[[Item Code],[Class]],
Sol = Table.RenameColumns(f,{"Item Code","Product"})
in
Sol
Solving the challenge of Abc Inventory Analysis with Excel
Excel solution 1 for Abc Inventory Analysis, proposed by 🇰🇷 Taeyong Shin:
=LET(
    s,
    BYROW(
        C3:D14,
        PRODUCT
    ),
    n,
    SCAN(
        ,
        -SORT(
            -s
        ),
        SUM
    )/SUM(
        s
    ),
    HSTACK(
        SORTBY(
            B3:B14,
            -s
        ),
        SWITCH(
            TRUE,
            n<=0.8,
            "A",
            n<=MEDIAN(
                n
            ),
            "B",
            "C"
        )
    )
)
Excel solution 2 for Abc Inventory Analysis, proposed by Julian Poeltl:
=LET(R,
    BYROW(LET(T,
    B3:D14,
    I,
    TAKE(
        T,
        ,
        1
    ),
    U,
    CHOOSECOLS(
        T,
        2
    ),
    V,
    DROP(
        T,
        ,
        2
    ),
    VP,
    V*U,
    ISo,
    SORTBY(
        I,
        VP,
        -1
    ),
    VPSo,
    SORT(
        VP,
        ,
        -1
    ),
    CumP,
    SCAN(0,
    VPSo,
    LAMBDA(A,
    B,
    (A+B)))/SUM(
        VPSo
    ),
    C,
    COUNTA(
        U
    ),
    SS,
    SEQUENCE(
        C
    )/C,
    HSTACK(
        ISo,
        CumP,
        SS
    )),
    LAMBDA(
        A,
        CHOOSECOLS(
            A,
            1
        )&IFS(
            OR(
                CHOOSECOLS(
                    A,
                    2
                )<=80%,
                CHOOSECOLS(
                    A,
                    3
                )<=20%
            ),
            "A",
            OR(
                CHOOSECOLS(
                    A,
                    2
                )<=95%,
                CHOOSECOLS(
                    A,
                    3
                )<=50%
            ),
            "B",
            1,
            "C"
        )
    )),
    HSTACK(
        LEFT(
            R,
            6
        ),
        RIGHT(
            R,
            1
        )
    ))
Excel solution 3 for Abc Inventory Analysis, proposed by Kris Jaganah:
=LET(
    a,
    SORT(
        HSTACK(
            B3:B14,
            C3:C14*D3:D14
        ),
        2,
        -1
    ),
    b,
    TAKE(
        a,
        ,
        -1
    ),
    c,
    SCAN(
        ,
        b/SUM(
            b
        ),
        SUM
    ),
    HSTACK(
        TAKE(
            a,
            ,
            1
        ),
        XLOOKUP(
            c,
            VSTACK(
                0.8,
                MEDIAN(
                    c
                )
            ),
            {"A";"B"},
            "C",
            1
        )
    )
)
Excel solution 4 for Abc Inventory Analysis, proposed by Hussein SATOUR:
=LET(
    a,
    C3:C14*D3:D14,
    b,
    SORT(
        a,
        ,
        -1
    ),
    HSTACK(
        SORTBY(
            B3:B14,
            a,
            -1
        ),
        IFS(
            b>PERCENTILE.EXC(
                a,
                .8
            ),
            "A",
            b>MEDIAN(
                a
            ),
            "B",
            1,
            "C"
        )
    )
)
Excel solution 5 for Abc Inventory Analysis, proposed by Hussein SATOUR:
=LET(
    I,
    B3:B14,
     a,
    C3:C14*D3:D14,
     c,
    SCAN(
        ,
        SORT(
            a,
            ,
            -1
        ),
        SUM
    )/SUM(
        a
    ),
     HSTACK(
         SORTBY(
             I,
             a,
             -1
         ),
         IFS(
             c<0.8,
             "A",
             LEN(
                 SCAN(
                     ,
                     I,
                     CONCAT
                 )
             )/6<=ROUNDUP(
                 COUNT(
                     c
                 )*0.3,
                 0
             )+ COUNT(
                 FILTER(
                     c,
                     c<0.8
                 )
             ),
             "B",
             1,
             "C"
         )
     )
)
Solving the challenge of Abc Inventory Analysis with Python
Python solution 1 for Abc Inventory Analysis, proposed by Konrad Gryczan, PhD:
import pandas as pd

xlsx_file = 'CH-025 ABC Analysis.xlsx'

input = pd.read_excel(xlsx_file, sheet_name='Sheet1', skiprows=1, nrows=12, usecols = "B:D")
test = pd.read_excel(xlsx_file, sheet_name='Sheet1', skiprows=1, nrows=12, usecols = "L:M")

input['avg_spend_value'] = input['AVG Inventory (unit)'] * input['Value per unit ($)']
input = input.sort_values(by='avg_spend_value', ascending=False)
input['total_spend'] = input['avg_spend_value'].sum()
input['cumulative_spend'] = input['avg_spend_value'].cumsum()
input['cumulative_perc'] = (input['cumulative_spend'] / input['total_spend']) * 100
input.reset_index(drop=True, inplace=True)
input['cumulative_product_perc'] = (input.index + 1) / len(input) * 100

def assign_class(row):
 if row['cumulative_perc'] <= 80 and row['cumulative_product_perc'] < 20:
 return 'A'
 elif row['cumulative_perc'] <= 95 and row['cumulative_product_perc'] < 50:
 return 'B'
 else:
 return 'C'

input['class'] = input.apply(assign_class, axis=1)
input = input.iloc[:, [0, -1]]

# Again like in R Script one row has different value
Solving the challenge of Abc Inventory Analysis with R
R solution 1 for Abc Inventory Analysis, proposed by Konrad Gryczan, PhD:
library(tidyverse)
library(readxl)

input = read_excel("files/CH-025 ABC analysis.xlsx", range = "B2:D14")
test = read_excel("files/CH-025 ABC analysis.xlsx", range = "L2:M14")

result = input %>%
 mutate(avg_spend_value = `AVG Inventory (unit)` * `Value per unit ($)`) %>%
 arrange(desc(avg_spend_value)) %>%
 mutate(total_spend = sum(avg_spend_value),
 cum_spend = cumsum(avg_spend_value),
 cum_percent = cum_spend / total_spend * 100,
 Class = case_when(
 cum_percent <= 80 & row_number() <= n() * 0.2 ~ "A",
 cum_percent <= 95 & row_number() <= n() * 0.5 ~ "B",
 TRUE ~ "C"
 )) %>%
 select(Product = `Item Code`, Class)

# Omid Motamedisedeh one row (6th) didn't qualified to C but to B, because its cum_percent is higher than 95. Don't know if it is my mistake or solution provided is not correct. Either way, I am pointing it out.