
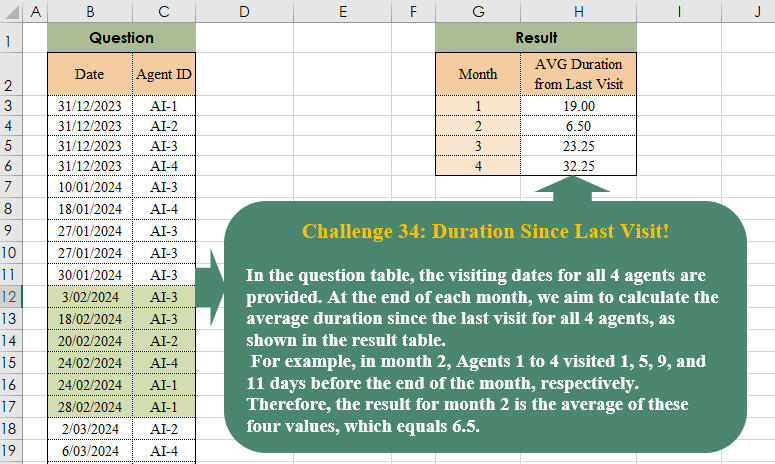
Challenge No. 38: In the question table, the visiting dates for all 4 agents are provided.
Solved using:Excel (AVERAGE, DROP, EOMONTH), Power Query (List.Transform, Table.AddColumn, Table.Group), Python, and R.
Adds a new column to a table with computed values in Power Query.
Challenge No. 38: In the question table, the visiting dates for all 4 agents are provided.
Solved using:Excel (AVERAGE, DROP, EOMONTH), Power Query (List.Transform, Table.AddColumn, Table.Group), Python, and R.

Challenge No. 35: In our company, we utilize a grading system to evaluate the technical performance of our agents, assigning grades of C, B, A, and A+.
Solved using:Excel (DROP, FILTER, HSTACK), Power Query (Table.AddColumn, Table.Group), and R.
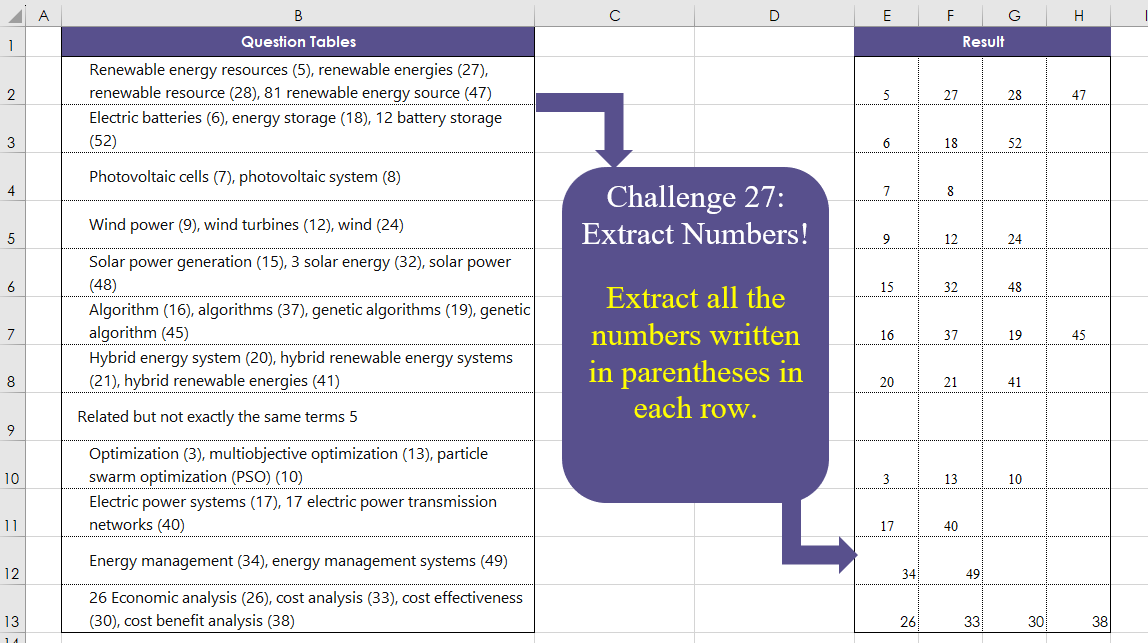
Challenge No. 27: Extract all the numbers written in parentheses in each row.
Solved using:Excel (DROP, IFERROR, IFNA), Power Query (List.Transform, Text.BetweenDelimiters, Table.AddColumn), Python, and R.

Challenge No. 26: The provided question table contains information regarding the amount of time individuals spend in meetings with each other, and we want to generate a result table that displays the percentage of time each person (G3:G7) spends with others (H2:L2), ensuring that the sum of each row equals 100%.
Solved using:Excel (HSTACK, INDEX, LAMBDA), and Power Query (Table.AddColumn).
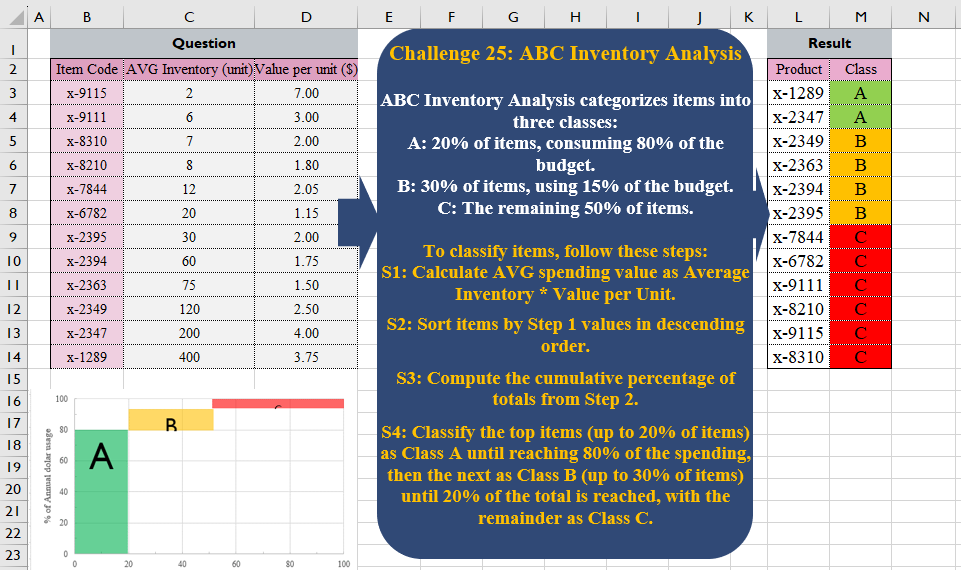
Challenge No. 25: ABC Inventory Analysis categorizes items into three classes:
A: 20% of items, consuming 80% of the budget.
Solved using:Excel (CHOOSECOLS, HSTACK, LET), Power Query (Table.AddColumn), Python, and R.
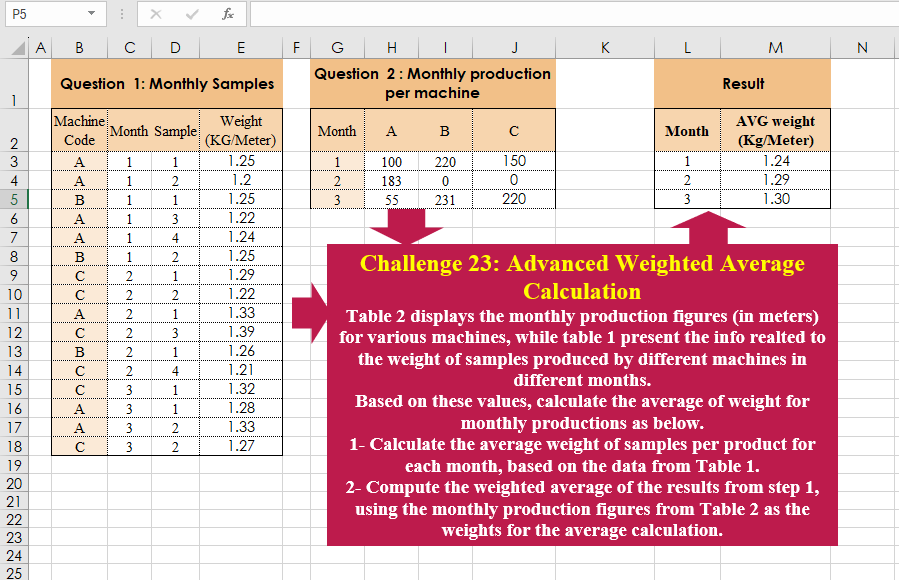
Challenge No. 23: Table 2 displays the monthly production figures (in meters) for various machines, while table 1 present the info realted to the weight of samples produced by different machines in different months.
Solved using:Excel (CHOOSECOLS, HSTACK, LAMBDA), Power Query (Table.AddColumn, Table.Group), and R.
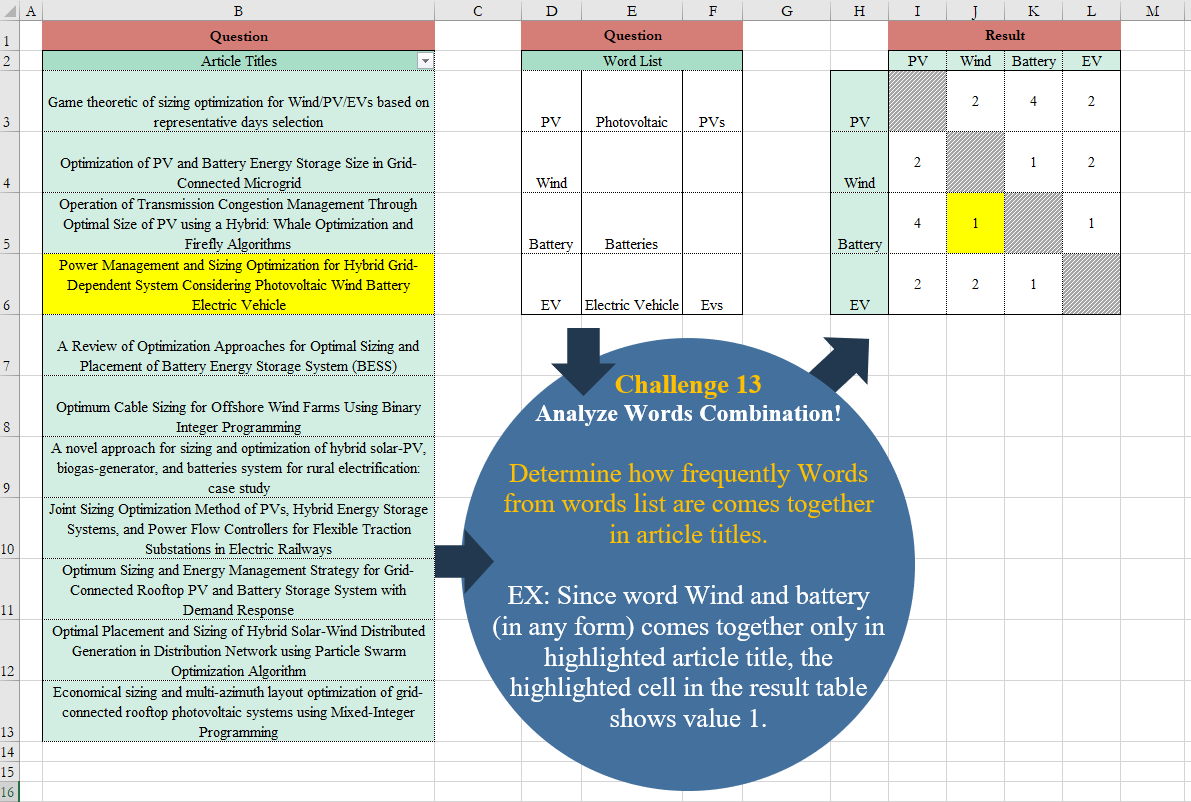
Challenge No. 13: Determine how frequently Words from words list are comes together in article titles.
Solved using:Excel (CHOOSEROWS, IF, LAMBDA), Power Query (Table.AddColumn), and R.
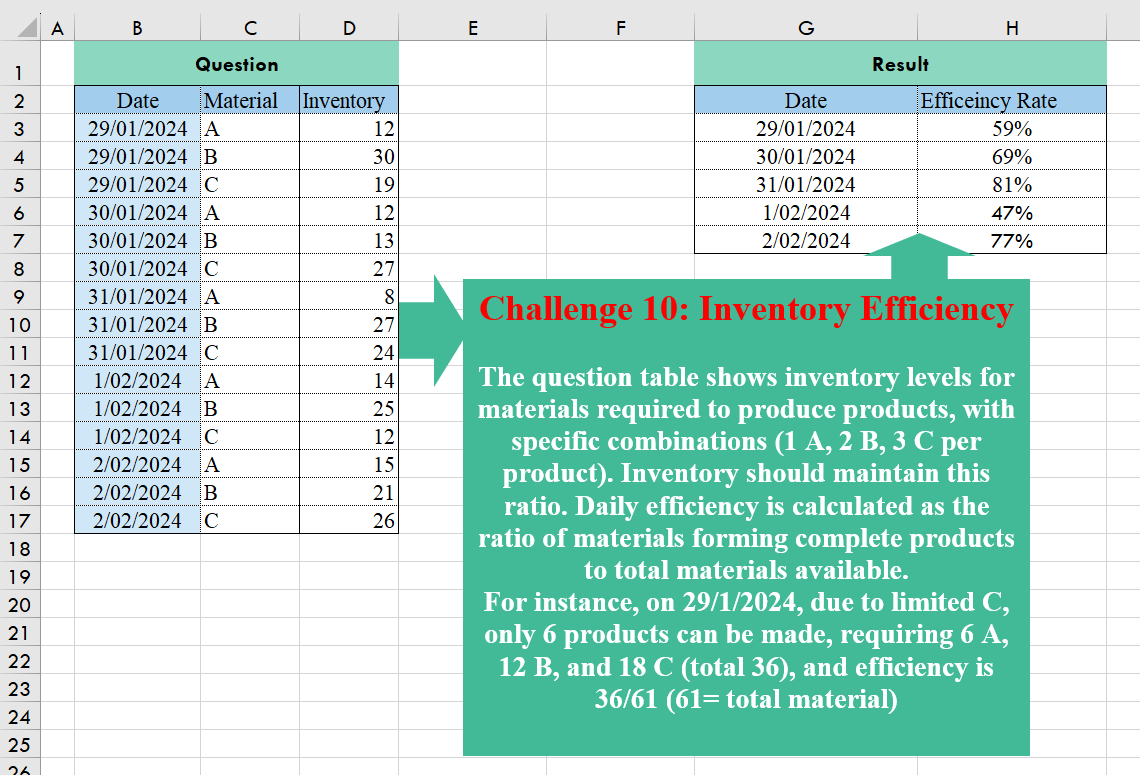
Challenge No. 10: The question table shows inventory levels for materials required to produce products, with specific combinations (1 A, 2 B, 3 C per product).
Solved using:Excel (HSTACK, LAMBDA, LET), Power Query (Table.AddColumn, Table.Group), and R.
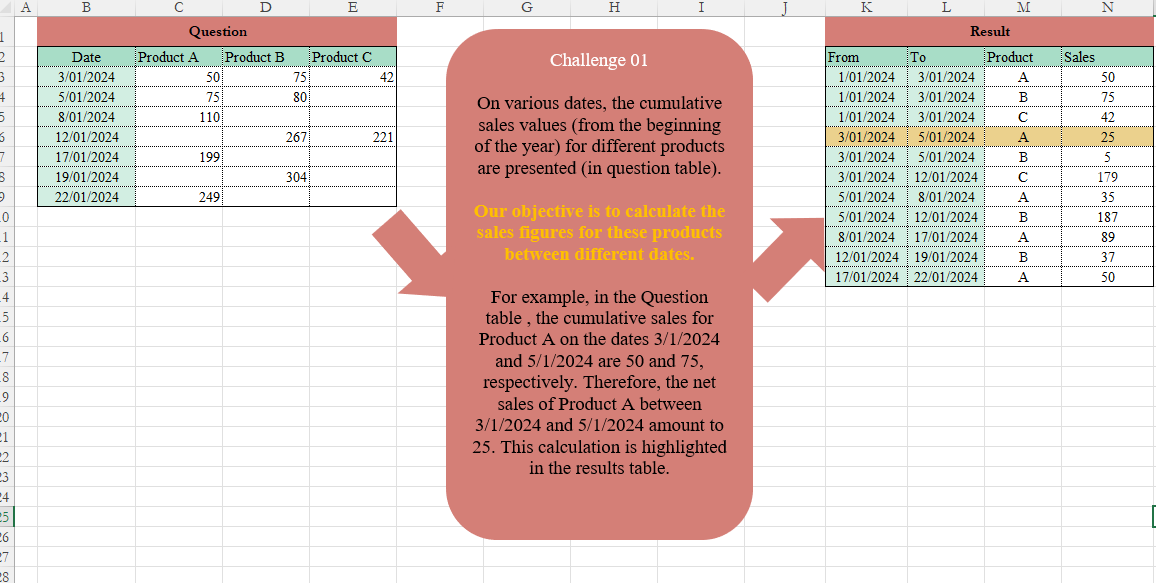
Challenge No. 1: On various dates, the cumulative sales values (from the beginning of the year) for different products are presented (in the Question table).
Solved using:Excel (DROP, FILTER, HSTACK), and Power Query (Table.AddColumn, Table.TransformColumnTypes).