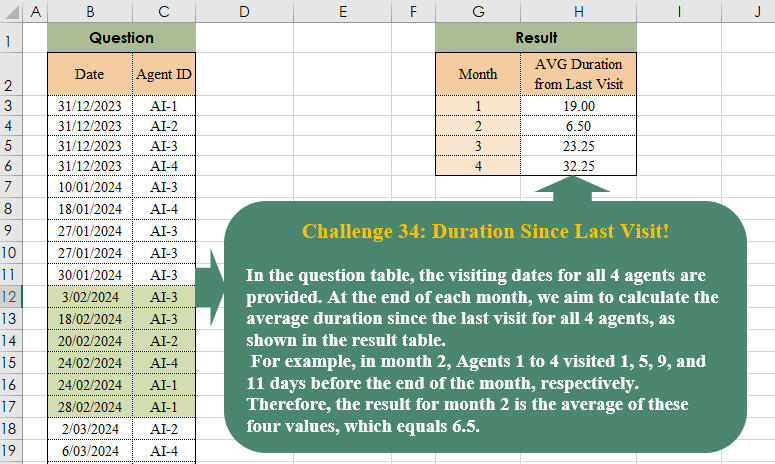
In the question table, the visiting dates for all 4 agents are provided. At the end of each month, we aim to calculate the average duration since the last visit for all 4 agents, as shown in the result table. For example, in month 2, Agents 1 to 4 visited 1, 5, 9, and 11 days before the end of the month, respectively. Therefore, the result for month 2 is the average of these four values, which equals 6.5.
📌 Challenge Details and Links
Challenge Number: 38
Challenge Difficulty: ⭐⭐⭐
📥Download Sample File
📥Link to the solutions on LinkedIn
Solving the challenge of Duration Since Last Visit! with Power Query
Power Query solution 1 for Duration Since Last Visit!, proposed by Omid Motamedisedeh:
let
  S = Table.TransformColumnTypes(
    Excel.CurrentWorkbook(){[Name = "Table1"]}[Content],
    {"Date", Date.Type}
  ),
  FX = (a) =>
    Number.From(
      List.Average(
        List.Transform(
          List.Distinct(S[Agent ID]),
          (x) => a - List.Last(Table.SelectRows(S, each [Date] <= a and [Agent ID] = x)[Date])
        )
      )
    ),
  re = Table.AddColumn(
    Table.FromColumns({{1, 2, 3, 4}}, {"Month"}),
    "AVG Deuration",
    each FX(Date.EndOfMonth(#date(2024, [Month], 1)))
  )
in
  re
Power Query solution 2 for Duration Since Last Visit!, proposed by Brian Julius:
let
  S = Table.TransformColumnTypes(
    Excel.CurrentWorkbook(){[Name = "Table1"]}[Content],
    {"Date", Date.Type}
  ),
  Z = Table.AddColumn(S, "YearMonth", each Date.Year([Date]) * 100 + Date.Month([Date])),
  CJ = Table.PrefixColumns(
    Table.ExpandListColumn(
      Table.AddColumn(
        Table.Distinct(Table.SelectColumns(Z, "Agent ID")),
        "YearMo",
        each List.Distinct(Z[YearMonth])
      ),
      "YearMo"
    ),
    "CJ"
  ),
  J = Table.Join(CJ, {"CJ.Agent ID", "CJ.YearMo"}, Z, {"Agent ID", "YearMonth"}, JoinKind.LeftOuter),
  Gp = Table.Group(
    J,
    {"CJ.Agent ID", "CJ.YearMo"},
    {{"Date", each List.Max([Date]), type nullable date}}
  ),
  End = Table.AddColumn(
    Gp,
    "EndDate",
    each Date.EndOfMonth(Date.FromText(Text.From([CJ.YearMo] * 100 + 1)))
  ),
  St = Table.SelectRows(
    Table.FillDown(
      Table.Sort(End, {{"CJ.Agent ID", Order.Ascending}, {"CJ.YearMo", Order.Ascending}}),
      {"Date"}
    ),
    each [CJ.YearMo] <> List.First(End[CJ.YearMo])
  ),
  E = Table.AddColumn(St, "Elapsed", each Number.From([EndDate]) - Number.From([Date])),
  MN = Table.TransformColumns(
    E,
    {{"CJ.YearMo", each Number.From(Text.End(Text.From(_), 2)), type number}}
  ),
  G2 = Table.RenameColumns(
    Table.Group(MN, {"CJ.YearMo"}, {{"AvgDurBtw", each List.Average([Elapsed]), type number}}),
    {"CJ.YearMo", "Month"}
  )
in
  G2
Power Query solution 3 for Duration Since Last Visit!, proposed by Aditya Kumar Darak 🇮🇳:
let
  Source = Excel.CurrentWorkbook(){[Name = "data"]}[Content],
  Agent = List.Distinct(Source[Agent ID]),
  Date = List.Skip(List.Distinct(List.Transform(Source[Date], Date.EndOfMonth))),
  Generate = List.TransformMany(
    Date,
    (x) => Agent,
    (x, y) =>
      [
        M = List.Last(Table.SelectRows(Source, each [Date] <= x and [Agent ID] = y)[Date]),
        D = Number.Round(Number.From(x - M) - 1),
        R = {Date.Month(x)} & {D}
      ][R]
  ),
  Table = Table.FromRows(Generate, {"Month", "D"}),
  Group = Table.Group(Table, "Month", {"Avg Duration", each List.Average([D])})
in
  Group
Power Query solution 4 for Duration Since Last Visit!, proposed by Alejandro Simón 🇵🇦 🇪🇸:
let
 Source = Excel.CurrentWorkbook(){[Name="Table1"]}[Content],
 A = Table.AddColumn(Source, "Month", each Date.Month([Date])),
 B = Table.AddColumn(A, "DayEoM", each Date.Day(Date.EndOfMonth([Date]))),
 C = Table.AddColumn(Table.AddColumn(B, "Days2EoM", each [DayEoM] - Date.Day([Date])), "Year", each Date.From([Date])),
 D = Table.Group(C, {"Agent ID", "Month", "DayEoM", "Year"}, {{"A", each List.Last([Days2EoM])}}),
 Sol = Table.Skip(Table.Group(D, {"Month"}, {{"Avg Duration From Last Visit", (z)=>
let
a = List.Difference(List.Distinct(A[Agent ID]), z[Agent ID]),
b = List.Transform(a, (x)=> Table.SelectRows(Source, each [Agent ID]=x)[Date]),
c = List.Transform(b, each List.Last(List.Select(_, (x)=> Date.From(x) < Date.EndOfMonth(
hashtag
#date(2024, z[Month]{0}, 1))))),
d = List.Transform(c, each Number.From(Date.From(Date.EndOfMonth(
hashtag
#date(2024, z[Month]{0}, 1)))- Date.From(_))),
e = List.Count(z[Agent ID])+a,
f = List.Average(Table.Group(z, {"Agent ID"}, {"C", each List.Last([A])})[C]&d)
in f}}),1)
in
 Sol
Solving the challenge of Duration Since Last Visit! with Excel
Excel solution 1 for Duration Since Last Visit!, proposed by Bo Rydobon 🇹🇭:
=LET(
    d,
    B3:B26,
    a,
    C3:C26,
    m,
    DROP(
        UNIQUE(
            EOMONTH(
                +d,
                0
            )
        ),
        1
    ),
    HSTACK(
        MONTH(
            m
        ),
        MAP(
            m,
            LAMBDA(
                v,
                AVERAGE(
                    v-XLOOKUP(
                        UNIQUE(
                            a
                        )&v,
                        a&d,
                        d,
                        ,
                        -1,
                        -1
                    )
                )
            )
        )
    )
)


=LET(
    d,
    B3:B26,
    a,
    C3:C26,
    m,
    DROP(
        UNIQUE(
            EOMONTH(
                +d,
                0
            )
        ),
        1
    ),
    HSTACK(
        MONTH(
            m
        ),
        BYROW(
            m-MAXIFS(
                d,
                d,
                "<"&m,
                a,
                TOROW(
                    UNIQUE(
                            a
                        )
                )
            ),
            AVERAGE
        )
    )
)
Excel solution 2 for Duration Since Last Visit!, proposed by 🇰🇷 Taeyong Shin:
=LET(
    d,
    B3:B26,
    a,
    C3:C26,
    e,
    DROP(
        UNIQUE(
            EOMONTH(
                +d,
                0
            )
        ),
        1
    ),
    HSTACK(
        MONTH(
            e
        ),
        BYROW(
            e-XLOOKUP(
                TOROW(
                    UNIQUE(
                        a
                    )
                )&e,
                a&d,
                d,
                ,
                -1
            ),
            AVERAGE
        )
    )
)
Excel solution 3 for Duration Since Last Visit!, proposed by محمد حلمي:
=LET(
    b,
    B3:B26,
    c,
    C3:C26,
    m,
    MONTH(
        b
    ),
    v,
    UNIQUE(
        m
    ),    DROP(
        HSTACK(
            v,
            MAP(
                XMATCH(
                    v,
                    m,
                    ,
                    -1
                ),
                LAMBDA(
                    a,
                    LET(
                        i,
                        TAKE(
                            b,
                            a
                        ),

                        AVERAGE(
                            EOMONTH(
                                MAX(
                                    i
                                ),
                                0
                            )-XLOOKUP(
                                UNIQUE(
                                    c
                                ),
                                TAKE(
                                    c,
                                    a
                                ),
                                i,
                                ,
                                ,
                                -1
                            )
                        )
                    )
                )
            )
        ),
        1
    )
)
Excel solution 4 for Duration Since Last Visit!, proposed by محمد حلمي:
=LET(
    m,
    MONTH(
        B3:B26
    ),
    v,
    UNIQUE(
        m
    ),
    i,
    MAP(
        v,
        LAMBDA(
            a,
            LET(

                i,
                TAKE(
                    B3:C26,
                    XMATCH(
                        a,
                        m,
                        ,
                        -1
                    )
                ),
                AVERAGE(
                    EOMONTH(
                        TAKE(
                            i,
                            -1,
                            1
                        ),
                        0
                    )-XLOOKUP(
                        UNIQUE(
                            C3:C26
                        ),
                        DROP(
                            i,
                            ,
                            1
                        ),
                        TAKE(
                            i,
                            ,
                            1
                        ),
                        ,
                        ,
                        -1
                    )
                )
            )
        )
    ),
    FILTER(
        HSTACK(
            v,
            i
        ),
        i
    )
)
Excel solution 5 for Duration Since Last Visit!, proposed by Oscar Mendez Roca Farell:
=HSTACK(
    ROW(
        1:4
    ),
     MAP(
         ROW(
        1:4
    ),
          LAMBDA(
              r,
               LET(
                   C,
                    C3:C26,
                    D,
                    B3:B26,
                    E,
                    EOMONTH(
                        r&"/24",
                         0
                    ),
                    N,
                    XMATCH(
                        E,
                         D,
                         -1
                    ),
                    AVERAGE(
                        E-MAXIFS(
                            TAKE(
                                D,
                                 N
                            ),
                             TAKE(
                                 C,
                                  N
                             ),
                             UNIQUE(
                                 C
                             )
                        )
                    )
               )
          )
     )
)
Excel solution 6 for Duration Since Last Visit!, proposed by Julian Poeltl:
=LET(
    T,
    B2:C26,
    TT,
    DROP(
        T,
        1
    ),
    D,
    TAKE(
        TT,
        ,
        1
    ),
    AI,
    TAKE(
        TT,
        ,
        -1
    ),
    S,
    SEQUENCE(
        4
    ),
    VSTACK(
        {"Month",
        "AVG Duration from Last Visit"},
        HSTACK(
            S,
            MAP(
                S,
                LAMBDA(
                    A,
                    AVERAGE(
                        MAP(
                            S,
                            LAMBDA(
                                B,
                                LET(
                                    EO,
                                    EOMONTH(
                                        DATE(
                                            2024,
                                            A,
                                            1
                                        ),
                                        0
                                    ),
                                    F,
                                    FILTER(
                                        D,
                                        AI="AI-"&B
                                    ),
                                    EO-XLOOKUP(
                                        EO,
                                        F,
                                        F,
                                        0,
                                        -1,
                                        -1
                                    )
                                )
                            )
                        )
                    )
                )
            )
        )
    )
)
Excel solution 7 for Duration Since Last Visit!, proposed by Julian Poeltl:
=LET(
    S,
    SEQUENCE(
        4
    ),
    MAP(
        S,
        LAMBDA(
            A,
            AVERAGE(
                MAP(
                    S,
                    LAMBDA(
                        B,
                        LET(
                            EO,
                            EOMONTH(
                                DATE(
                                    2024,
                                    A,
                                    1
                                ),
                                0
                            ),
                            F,
                            FILTER(
                                B3:B26,
                                C3:C26="AI-"&B
                            ),
                            EO-XLOOKUP(
                                EO,
                                F,
                                F,
                                0,
                                -1,
                                -1
                            )
                        )
                    )
                )
            )
        )
    )
)

(same as my previous solution - but every wrapping erased)
Excel solution 8 for Duration Since Last Visit!, proposed by Kris Jaganah:
=LET(
    a,
    B3:B26,
    b,
    C3:C26,
    c,
    DROP(
        UNIQUE(
            EOMONTH(
                --a,
                0
            )
        ),
        1
    ),
    HSTACK(
        MONTH(
            c
        ),
        BYROW(
            c-XLOOKUP(
                TOROW(
                    UNIQUE(
                        b
                    )
                )&c,
                b&a,
                a,
                ,
                -1
            ),
            AVERAGE
        )
    )
)
Excel solution 9 for Duration Since Last Visit!, proposed by John Jairo Vergara Domínguez:
=LET(
    d,
    B3:B26,
    m,
    EOMONTH(
        +d,
        0
    ),
    HSTACK(
        ROW(
            1:4
        ),
        DROP(
            UNIQUE(
                BYROW(
                    m-MAXIFS(
                        d,
                        d,
                        "<"&m,
                        C3:C26,
                        TOROW(
                            C3:C6
                        )
                    ),
                    AVERAGE
                )
            ),
            1
        )
    )
)
Excel solution 10 for Duration Since Last Visit!, proposed by Sunny Baggu:
=MAP(
 SEQUENCE(
     4
 ), LAMBDA(x, LET(
 _f,
     TAKE(B3:C26,
     MAX(SEQUENCE(
         ROWS(
             B3:B26
         )
     ) * (MONTH(
             B3:B26
         ) = x))), AVERAGE(      EOMONTH(
          DATE(
              2024,
               1,
               0
          ),
           x
      ) -
      MAP(
          UNIQUE(
              C3:C26
          ),
           LAMBDA(
               a,
                TAKE(
                    FILTER(
                        TAKE(
                            _f,
                             ,
                             1
                        ),
                         TAKE(
                             _f,
                              ,
                              -1
                         ) = a
                    ),
                     -1
                )
           )
      ) )
 )
 )
)
Excel solution 11 for Duration Since Last Visit!, proposed by Hussein SATOUR:
=LET(d,
    B3:B26,
    m,
    MONTH(
        d
    ),
    a,
    C3:C26,
    b,
    DROP(
        UNIQUE(
            m
        ),
        1
    ),
    HSTACK(b,
    MAP(b,
    LAMBDA(y,
    AVERAGE(MAP(UNIQUE(
        a
    ),
    LAMBDA(x,
    EOMONTH(
        y&"/"&y,
        0
    )-MAX(FILTER(d,
    (a=x)*(IF(
        m=12,
        0,
        m
    )<=y))))))))))
Excel solution 12 for Duration Since Last Visit!, proposed by Rahim Zulfiqar Ali:
=SORT(
    UNIQUE(
        TOCOL(
            B2:E10,
            3
        )
    )
)
Solving the challenge of Duration Since Last Visit! with Python
Python solution 1 for Duration Since Last Visit!, proposed by Konrad Gryczan, PhD:
import pandas as pd
from datetime import datetime, timedelta

input = pd.read_excel("CH-038 Duration Since Last Visit.xlsx", usecols="B:C", skiprows=1, nrows= 25)
test = pd.read_excel("CH-038 Duration Since Last Visit.xlsx", usecols="G:H", skiprows=1, nrows = 4)

dates = pd.date_range(start="2024-01-01", end="2024-05-01", freq="M").to_frame(name="end_of_month")

ends = pd.MultiIndex.from_product([dates["end_of_month"], input["Agent ID"].unique()], names=["Date", "Agent ID"]).to_frame(index=False)
ends["type"] = "end"

result = pd.concat([input.assign(type="visit"), ends]).sort_values(by=["Agent ID", "Date"])
result["last_visit"] = result["Date"].where(result["type"] == "visit").groupby(result["Agent ID"]).ffill()
result["month"] = result["Date"].dt.month.astype("int64")
result = result[result["type"] == "end"]
result["datediff"] = (result["Date"] - result["last_visit"]).dt.days
result = result.groupby("month")["datediff"].mean().reset_index()

result.columns = ["Month", "AVG Duration from Last Visit"]
print(result.equals(test)) # True
Solving the challenge of Duration Since Last Visit! with R
R solution 1 for Duration Since Last Visit!, proposed by Konrad Gryczan, PhD:
library(tidyverse)
library(readxl)

input = read_excel("files/CH-038 Duration Since Last Visit.xlsx", range = "B2:C26")
test = read_excel("files/CH-038 Duration Since Last Visit.xlsx", range = "G2:H6")

dates = seq(as.Date("2024-01-01"), as.Date("2024-04-01"), by = "month") %>%
 as_tibble() %>%
 mutate(end_of_month = value + months(1) - days(1)) %>%
 select(end_of_month)

ends = expand_grid(Date = dates$end_of_month, `Agent ID` = unique(input$`Agent ID`)) %>%
 mutate(type = "end")

result = input %>%
 mutate(type = "visit") %>%
 bind_rows(ends) %>%
 arrange(`Agent ID`, Date) %>%
 group_by(`Agent ID`) %>%
 mutate(last_visit = if_else(type == "visit", as.Date(as.POSIXct(Date)), NA)) %>%
 fill(last_visit, .direction = "down") %>%
 mutate(month = month(Date)) %>%
 filter(type == "end") %>%
 mutate(datediff = difftime(Date, last_visit, units = "days") %>% as.numeric()) %>%
 ungroup() %>%
 summarise(mean = mean(datediff, na.rm = TRUE), .by = "month")