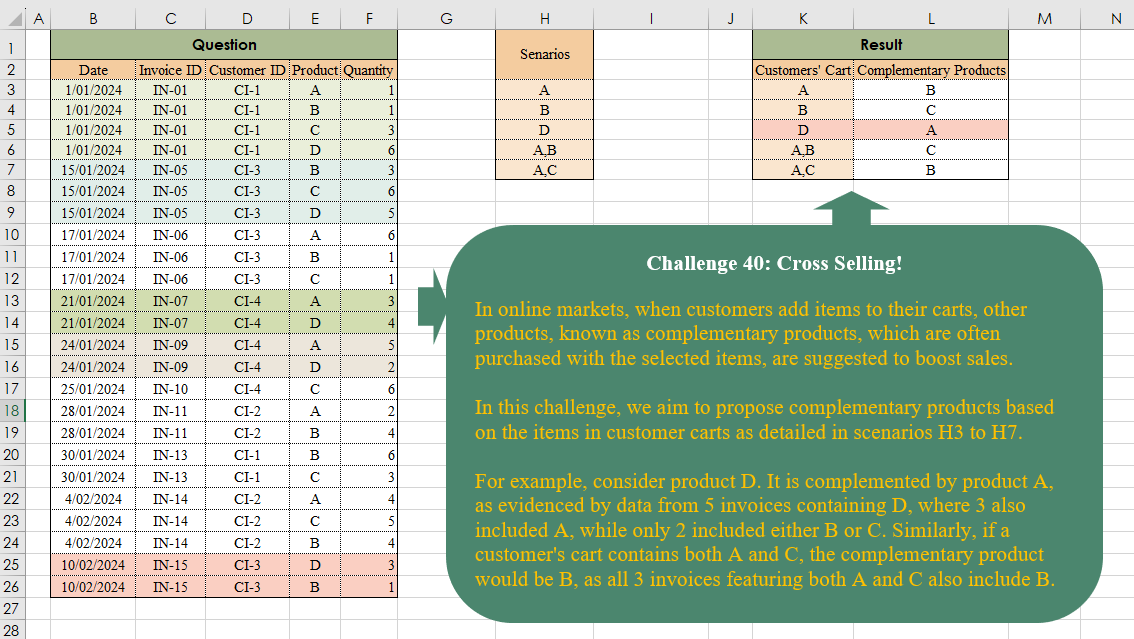
Challenge No. 40: In online markets, when customers add items to their carts, other products, known as complementary products, which are often purchased with the selected items, are suggested to boost sales.
Solved using:Excel (ARRAYTOTEXT, FILTER, HSTACK), Power Query (List.Transform, Text.Split, Table.AddColumn), and R.
UNIQUE
Returns unique values from a range or array in Excel.
Table Transformation! Part 5
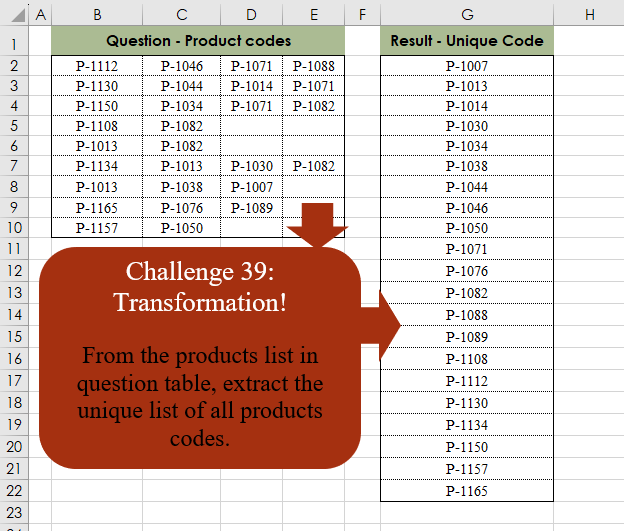
Challenge No. 39: From the products list in the question table, extract the unique list of all product codes.
Solved using:Excel (SORT, TOCOL, UNIQUE), Power Query (List.Distinct, Table.Distinct, Table.Sort), Python, and R.
Duration Since Last Visit!
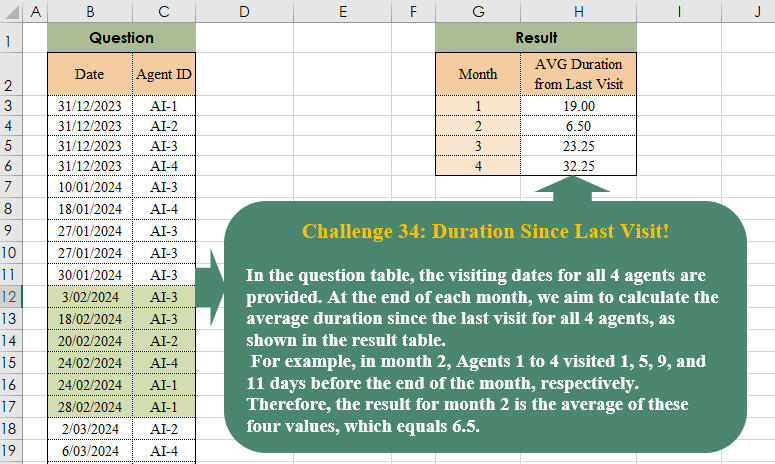
Challenge No. 38: In the question table, the visiting dates for all 4 agents are provided.
Solved using:Excel (AVERAGE, DROP, EOMONTH), Power Query (List.Transform, Table.AddColumn, Table.Group), Python, and R.
Connected People!
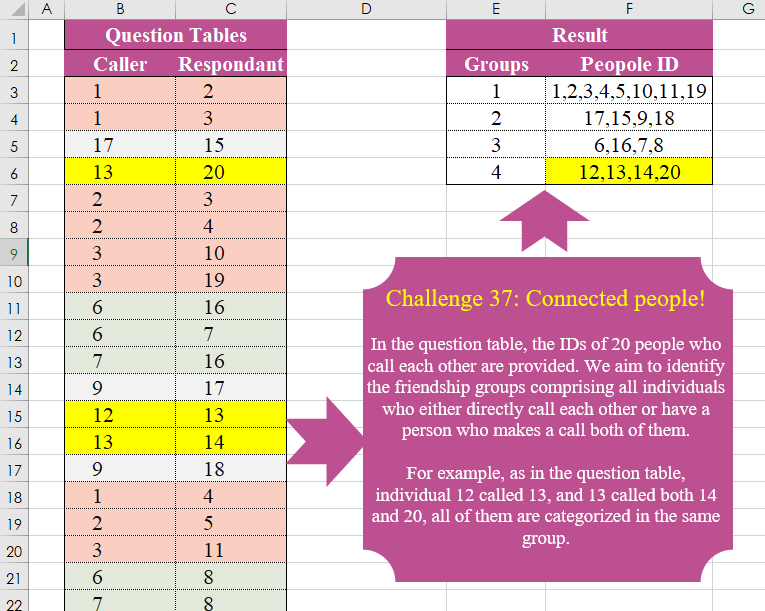
Challenge No. 37: In the question table, the IDs of 20 people who call each other are provided.
Solved using:Excel (FILTER, HSTACK, LAMBDA), Power Query (List.Transform, Text.Combine), Python, and R.
P & Down Grades!
Challenge No. 35: In our company, we utilize a grading system to evaluate the technical performance of our agents, assigning grades of C, B, A, and A+.
Solved using:Excel (DROP, FILTER, HSTACK), Power Query (Table.AddColumn, Table.Group), and R.
Customer Return Cycle!
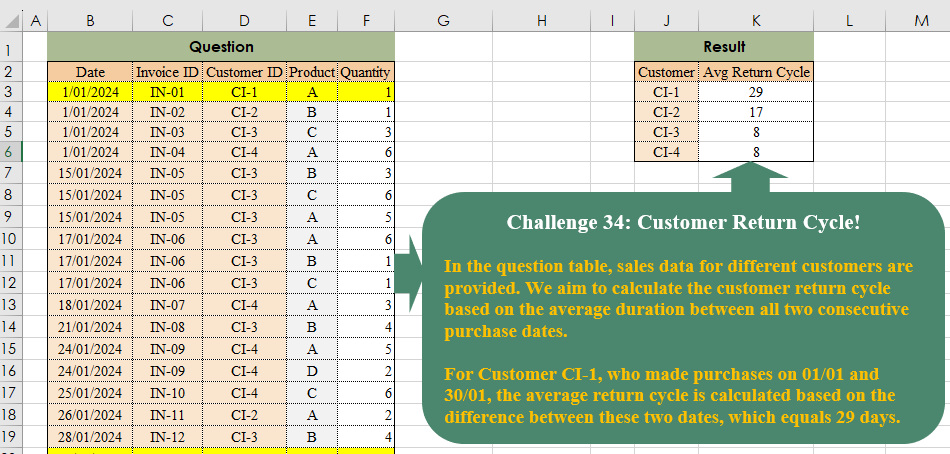
Challenge No. 34: In the question table, sales data for different customers are provided.
Solved using:Excel (DROP, FILTER, HSTACK), Power Query (Table.Group), Python, and R.
From-To Matrix
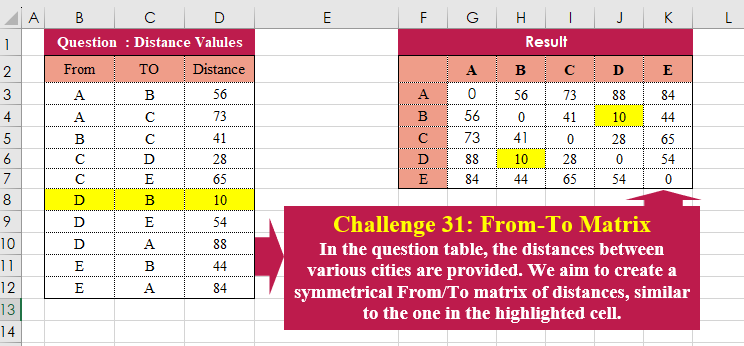
Challenge No. 31: In the question table, the distances between various cities are provided.
Solved using:Excel (HSTACK, LAMBDA, LET), Power Query (Table.Column, Table.ColumnNames), Python, and R.
Identifying Customers Staple Products!
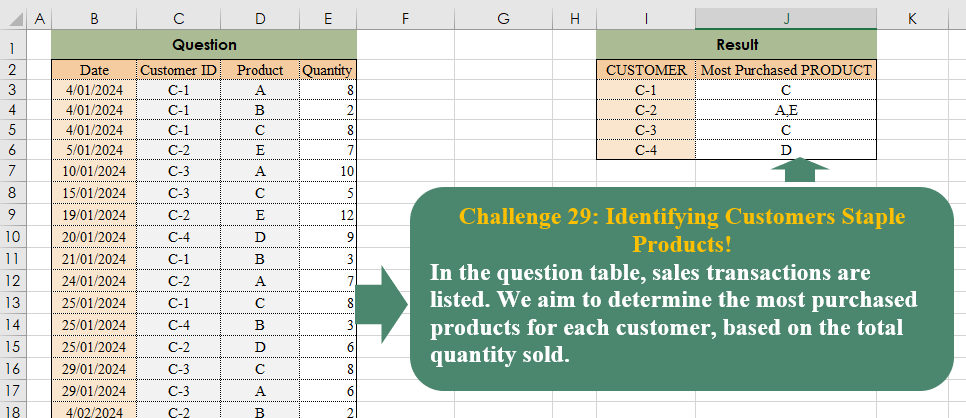
Challenge No. 29: In the question table, sales transactions are listed.
Solved using:Excel (CHOOSECOLS, FILTER, HSTACK), Power Query (Text.Combine, Table.Group), Python, and R.
Cluster Values!
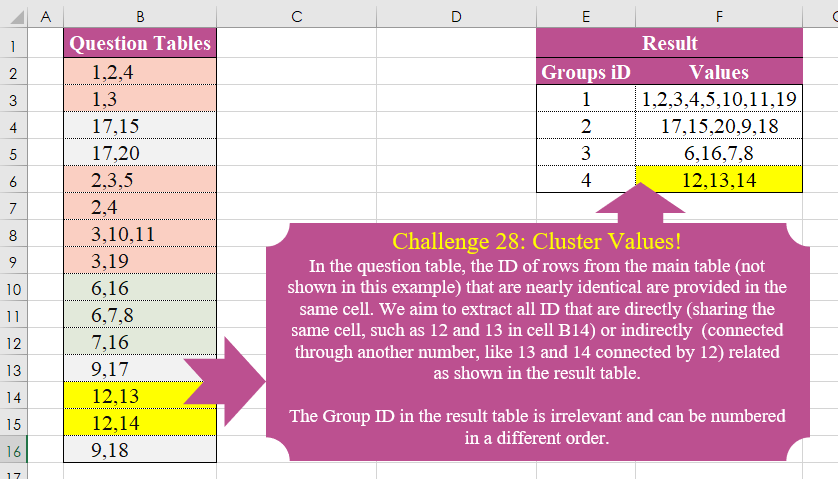
Challenge No. 28: In the question table, the ID of rows from the main table (not shown in this example) that are nearly identical are provided in the same cell.
Solved using:Excel (DROP, FILTER, HSTACK), Power Query (List.Transform), Python, and R.
Calculate Spending Time
Challenge No. 26: The provided question table contains information regarding the amount of time individuals spend in meetings with each other, and we want to generate a result table that displays the percentage of time each person (G3:G7) spends with others (H2:L2), ensuring that the sum of each row equals 100%.
Solved using:Excel (HSTACK, INDEX, LAMBDA), and Power Query (Table.AddColumn).