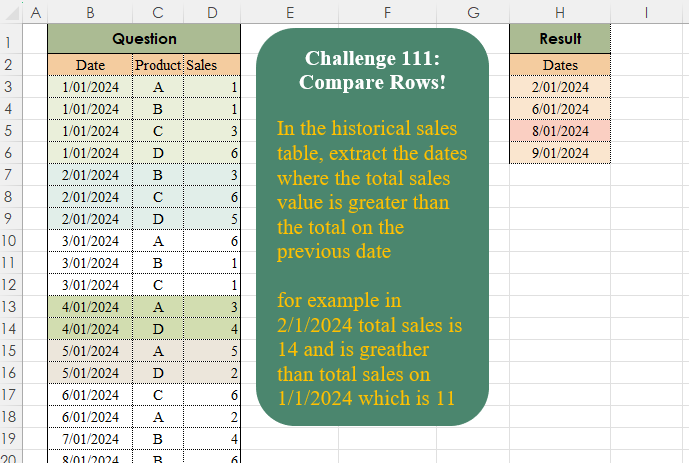
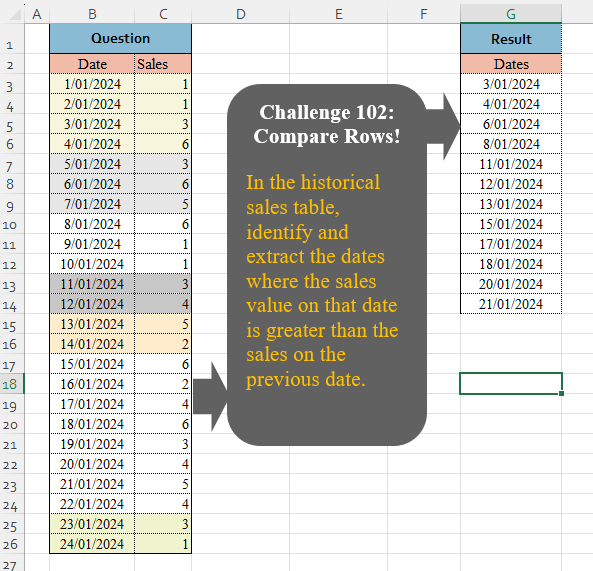
Challenge No. 111: In the historical sales table, extract the dates where the total sales value is greater than the total on the previous date
for example, in 2/1/2024 total sales were 14 and is greater than total sales on 1/1/2024 which is 11.
Solved using:Excel (DROP, FILTER, IF), Google Sheets, Power Query (Table.Group, Table.SelectRows), Python, Python in Excel, and R.
Python
Python programming for data analysis
Reconciliation!
Challenge No. 110: After reconciling the company’s bank transactions with the records in the financial department, discrepancies were found between 5 rows of bank transactions and 7 rows of financial records.
Solved using: Excel.
Avg Cooperation Time!
Challenge No. 108: Calculate the average cooperation time in months for those who are still with the company (do not have value on column leave date) as of 16/08/2024, categorized by their respective levels.
Solved using:Excel (AVERAGE, FILTER, HSTACK), Google Sheets, Power Query (Date.Month, Date.Year), Python, Python in Excel, and R.
Matching Tables!
Challenge No. 107: In a survey, 10 questions were asked to both
a manager and an expert, and they responded
to some of them.
Solved using:Excel (CHOOSECOLS, FILTER, HSTACK), Google Sheets, Power Query (List.PositionOf, List.Transform, Table.AddColumn), Python, Python in Excel, and R.
Custom Rank! Part 1
Challenge No. 106: Rank the countries based on Olympic medals, starting with the number of gold medals.
Solved using:Excel, Power Query, Python, and R.
Characters Repetition!
Challenge No. 105: In the question table, where some passwords are provided, extract the 6 most commonly used characters across all the passwords and count their repetitions.
Solved using:Excel (CONCAT, FILTER, GROUPBY), Google Sheets, Power Query (List.Combine, List.Distinct, List.Transform), Python, Python in Excel, and R.
Simuilation!
Challenge No. 104: Monte Carlo simulation is a technique used to predict the outcome of decisions by simulating a process multiple times.
Solved using:Excel, Power Query, Python, Python in Excel, and R.
Custom Average!
Challenge No. 103: Today is 20/08/2024, and we’re calculating the average delivery time per product in days.
Solved using:Excel (AVERAGE, CHOOSECOLS, FILTER), Google Sheets, Power Query (Table.AddColumn, Table.Group), Python, Python in Excel, and R.
Compare Rows! Part 1
Challenge No. 102: In the historical sales table, identify and extract the dates where the sales value on that date is greater than the sales on the previous date.
Solved using:Excel (DROP, FILTER, IF), Google Sheets, Power Query (Table.AddColumn, Table.AddIndexColumn, Table.SelectColumns), Python, Python in Excel, R, and VBA.
Duplicate Values! Part 1
Challenge No. 100: Consider the IDs in the question table.
Solved using:Excel (CHAR, COUNTIF, COUNTIFS), Google Sheets, Power Query (List.Transform, Table.AddColumn, Table.Group), Python, Python in Excel, and R.
