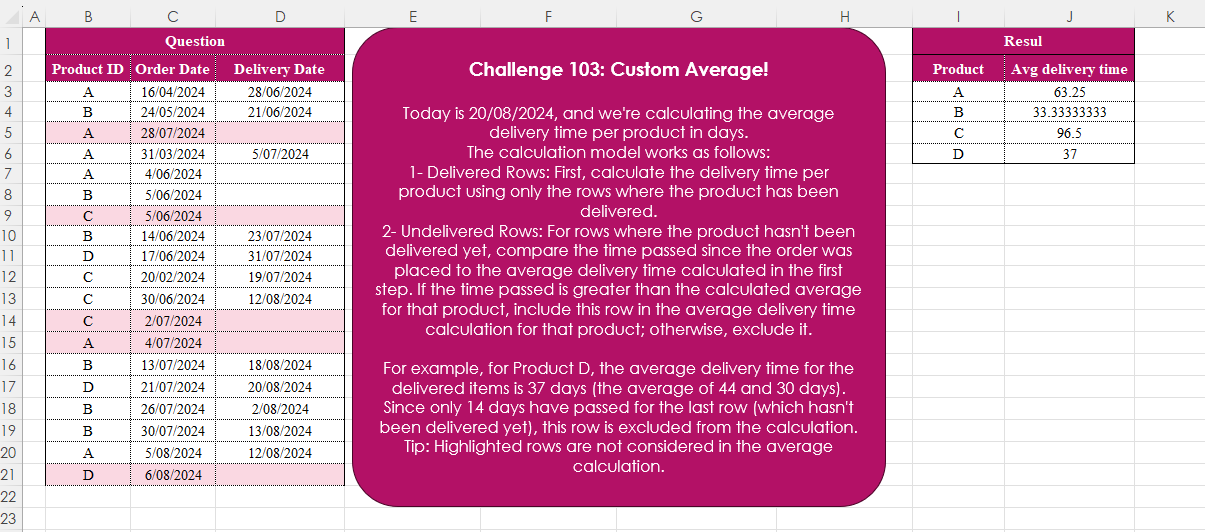
Today is 20/08/2024, and we’re calculating the average delivery time per product in days. The calculation model works as follows: 1- Delivered Rows: First, calculate the delivery time per product using only the rows where the product has been delivered. 2- Undelivered Rows: For rows where the product hasn’t been delivered yet, compare the time passed since the order was placed to the average delivery time calculated in the first step. If the time passed is greater than the calculated average for that product, include this row in the average delivery time calculation for that product; otherwise, exclude it. For example, for Product D, the average delivery time for the delivered items is 37 days (the average of 44 and 30 days). Since only 14 days have passed for the last row (which hasn’t been delivered yet), this row is excluded from the calculation. Tip: Highlighted rows are not considered in the average calculation.
📌 Challenge Details and Links
Challenge Number: 103
Challenge Difficulty: ⭐⭐
📥Download Sample File
📥Link to the solutions on LinkedIn
Solving the challenge of Custom Average! with Power Query
Power Query solution 1 for Custom Average!, proposed by Zoran Milokanović:
let
  Source = Excel.CurrentWorkbook(){[Name = "Input"]}[Content],
  S = Table.FromRecords(
    Table.Group(
      Table.AddColumn(
        Source,
        "N",
        each Duration.Days(
          Duration.From(([Delivery Date] ?? #datetime(2024, 8, 20, 0, 0, 0)) - [Order Date])
        )
      ),
      "Product ID",
      {
        "A",
        each
          let
            t = Table.ToRows(_),
            f = (b, v) =>
              List.Average(
                List.TransformMany(
                  t,
                  (i) => if i{2} <> null or ((i{3} > v) and b) then {i} else {},
                  (i, _) => i{3}
                )
              )
          in
            [Product = t{0}{0}, Avg delivery time = f(true, f(false, 0))]
      }
    )[A]
  )
in
  S
Power Query solution 2 for Custom Average!, proposed by Brian Julius:
let
  Source = Excel.CurrentWorkbook(){[Name = "Table1"]}[Content],
  ReType = Table.TransformColumnTypes(
    Source,
    {{"Order Date", type date}, {"Delivery Date", Date.Type}}
  ),
  AddElapsed = Table.AddColumn(
    ReType,
    "ElapsedDays",
    each try (Number.From([Delivery Date]) - Number.From([Order Date])) otherwise null
  ),
  GroupAvg = Table.Group(
    AddElapsed,
    {"Product ID"},
    {{"All", each _}, {"AvgDays", each Number.RoundUp(List.Average([ElapsedDays])), Int64.Type}}
  ),
  Expand = Table.ExpandTableColumn(GroupAvg, "All", {"Order Date", "Delivery Date", "ElapsedDays"}),
  AddAdjElapsed = Table.AddColumn(
    Expand,
    "AdjElapsed",
    each [
      a = Number.From(#date(2024, 8, 20)) - Number.From([Order Date]),
      b = if a > [AvgDays] then a else null,
      c = if [Delivery Date] <> null then [ElapsedDays] else b
    ][c]
  ),
  ReGroupAvg = Table.Group(
    AddAdjElapsed,
    {"Product ID"},
    {{"Avg Delivery Days", each List.Average([AdjElapsed])}}
  )
in
  ReGroupAvg
Power Query solution 3 for Custom Average!, proposed by Aditya Kumar Darak 🇮🇳:
let
  Source = Excel.CurrentWorkbook(){[Name = "data"]}[Content],
  Today = DateTime.From(#date(2024, 08, 20)),
  Days = Table.AddColumn(Source, "D", each Duration.Days([Delivery Date] - [Order Date])),
  Return = Table.Group(
    Days,
    "Product ID",
    {
      "Average",
      each [
        A1 = List.Average([D]),
        A = Table.AddColumn(
          _,
          "D2",
          (f) =>
            [
              d = Duration.Days((f[Delivery Date] ?? Today) - f[Order Date]),
              r = if f[D] = null and d > A1 then d else f[D]
            ][r]
        ),
        R = List.Average(A[D2])
      ][R]
    }
  )
in
  Return
Power Query solution 4 for Custom Average!, proposed by Alejandro Simón 🇵🇦 🇪🇸:
let
Source = Excel.CurrentWorkbook(){[Name="Table1"]}[Content],
Sol = Table.Group(Source, {"Product ID"}, {{"All", each
 let
 a = _,
 b = Table.ToRows(a),
 c = List.Transform(b, each Number.From(Date.From(_{2})-Date.From(_{1}))),
 d = List.Transform(List.Select(b, each _{2}=null), each
 Number.From(Replacer.ReplaceValue(_{2}, null,
hashtag
#date(2024,08,20)-Date.From(_{1})))),
 e = List.Average(List.Transform(d, each if _>List.Average(c) then _ else null)&c)
 in e}})
in
 Sol
Power Query solution 5 for Custom Average!, proposed by Kris Jaganah:
let
  Source = Excel.CurrentWorkbook(){[Name = "Table1"]}[Content],
  Group = Table.Group(
    Source,
    {"Product ID"},
    {
      "Avg delivery time",
      each
        let
          p = Table.AddColumn(_, "Dur", each [Delivery Date] - [Order Date]),
          q = List.Average(p[Dur]),
          r = Table.AddColumn(
            p,
            "Incl",
            each
              let
                b = [Delivery Date],
                c = [Order Date],
                d = #date(2024, 8, 20),
                e = Date.From(if b = null then c + q else b),
                f =
                  if b <> null then
                    [Dur]
                  else if b = null and e <= d then
                    d - Date.From(c)
                  else
                    null
              in
                Number.From(f)
          )
        in
          List.Average(r[Incl])
    }
  )
in
  Group
Power Query solution 6 for Custom Average!, proposed by Yaroslav Drohomyretskyi:
let
  Джерело = Excel.CurrentWorkbook(){[Name = "Таблиця1"]}[Content],
  Duration = Table.AddColumn(
    Джерело,
    "Duration",
    each Duration.Days([Delivery Date] - [Order Date])
  ),
  AvgDeliveryDur = Table.AddColumn(
    Duration,
    "DurationDelivery",
    each Table.SelectRows(
      Table.Group(Duration, "Product ID", {"Avg", each List.Average([Duration])}),
      (row) => row[Product ID] = [Product ID]
    ){0}[Avg]
  ),
  DurationFinal = Table.AddColumn(
    AvgDeliveryDur,
    "DurationCalc",
    each
      if Duration.Days(#datetime(2024, 8, 20, 0, 0, 0) - [Order Date])
        > [DurationDelivery] and [Delivery Date] is null
      then
        Duration.Days(#datetime(2024, 8, 20, 0, 0, 0) - [Order Date])
      else
        [Duration]
  ),
  #"Згруповані рядки" = Table.Group(
    DurationFinal,
    {"Product ID"},
    {{"Avg delivery time", each List.Average([DurationCalc])}}
  )
in
  #"Згруповані рядки"
Power Query solution 7 for Custom Average!, proposed by 🇮🇷 Navid Esmaeilzadeh اسماعیل زاده:
let
Source = Excel.CurrentWorkbook(){[Name="Table1"]}[Content],
A = Table.TransformColumnTypes(Source,{{"Product ID", type text}, {"Order Date", type date}, {"Delivery Date", type date}}),
B = Table.Group(A, {"Product ID"}, {{"Tbl", each _, type table [Product ID=nullable text, Order Date=nullable date, Delivery Date=nullable date]}}),
Fx=(t)=>
let
td=
hashtag
#date(2024,8,20),
b = Table.AddColumn(t, "Time", each if [Delivery Date]<>null then Duration.TotalDays([Delivery Date]-[Order Date]) else null),
ave = List.Average(List.RemoveNulls(b[Time])),
c = b,
d = Table.AddColumn(c, "T2", each if [Time]=null and Duration.TotalDays(td-[Order Date])>=ave then Duration.TotalDays(td-[Order Date]) else if [Time]<> null then [Time] else null),
e = Table.SelectRows(d, each ([T2] <> null)),
f = Table.Group(e, {"Product ID"}, {{"ave", each List.Average([T2]), type number}})
in
f,
C = Table.AddColumn(B, "Fx", each Fx([Tbl])),
D = Table.SelectColumns(C,{"Fx"}),
F = Table.ExpandTableColumn(D, "Fx", {"Product ID", "ave"}, {"Product ID", "ave"})
in
F
Solving the challenge of Custom Average! with Excel
Excel solution 1 for Custom Average!, proposed by 🇰🇷 Taeyong Shin:
=LET(p,
    B3:B21,
    o,
    C3:C21,
    d,
    D3:D21,
    n,
    (d=0)*"8-20"+d-o,
    GROUPBY(
        p,
        IF(
            d,
            n,
            IF(
                n>VLOOKUP(
                    p,
                    GROUPBY(
                        p,
                        d-o,
                        AVERAGE,
                        ,
                        0,
                        ,
                        d
                    ),
                    2
                ),
                n
            )
        ),
        AVERAGE,
        ,
        0
    ))
Excel solution 2 for Custom Average!, proposed by محمد حلمي:
=LET(b,
    B3:B21,
    o,
    C3:D21,
    d,
    D3:D21,
    u,
    UNIQUE(
        b
    ),HSTACK(u,
    MAP(u,
    LAMBDA(a,
    LET(
x,
    b=a,
    i,
    FILTER(
        o,
        d*x
    ),e,
    AVERAGE(
        DROP(
            i,
            ,
            1
        )-DROP(
            i,
            ,
            -1
        )
    ),j,
    INDEX(FILTER(o,
    (d=0)*x),
    IF(
        a="A",
        2,
        1
    ),
    1),r,
    TODAY()-j,
    IF(
        r>e,
        AVERAGE(
            e,
            r
        ),
        e
    ))))))
Excel solution 3 for Custom Average!, proposed by Oscar Mendez Roca Farell:
=LET(u,
     UNIQUE(
         B3:B21
     ),
     HSTACK(u,
     MAP(u,
     LAMBDA(a,
     LET(t,
     FILTER(
         C3:D21,
          B3:B21=a
     ),
     F,
     LAMBDA(
         i,
          MMULT(
              IF(
                  t,
                   t,
                   i
              ),
              {-1; 1}
          )
     ),
     n,
     F(
         0
     ),
     s,
     SUM(
         n*(
             n>0
         )
     )/SUM(
         N(
             n>0
         )
     ),
     m,
     F(
         45524
     ),
     c,
    (DROP(
        t,
         ,
         1
    )<>"")+(m>s),
     SUM(
         m*(
             c>0
         )
     )/SUM(
         N(
             c>0
         )
     ))))))
Excel solution 4 for Custom Average!, proposed by Julian Poeltl:
=LET(TD,
    DATE(
        2024,
        8,
        20
    ),
    PI,
    B3:B21,
    OD,
    C3:C21,
    DD,
    D3:D21,
    F,
    FILTER(
        HSTACK(
            PI,
            OD,
            DD
        ),
        DD
    ),
    I,
    TAKE(
        F,
        ,
        1
    ),
    D,
    TAKE(
        F,
        ,
        -1
    )-CHOOSECOLS(
        F,
        2
    ),
    U,
    SORT(
        UNIQUE(
            I
        )
    ),
    C,
    MAP(
        U,
        LAMBDA(
            A,
            AVERAGE(
                FILTER(
                    D,
                    I=A
                )
            )
        )
    ),
    CC,
    IF(
        DD=0,
        IF(
            TD-OD>XLOOKUP(
                PI,
                U,
                C
            ),
            TD-OD,
            0
        ),
        DD-OD
    ),
    VSTACK(HSTACK(
        "Product",
        "Avg delivery time"
    ),
    HSTACK(U,
    MAP(U,
    LAMBDA(A,
    AVERAGE(FILTER(CC,
    (CC>0)*(PI=A))))))))
Excel solution 5 for Custom Average!, proposed by Kris Jaganah:
=LET(
    a,
    B3:B21,
    b,
    C3:C21,
    c,
    D3:D21,
    d,
    GROUPBY(
        a,
        c-b,
        AVERAGE,
        ,
        0,
        ,
        c>0
    ),
    e,
    DATE(
        2024,
        8,
        20
    ),
    f,
    IFS(
        c>0,
        c,
        VLOOKUP(
            a,
            d,
            2,
            0
        )+b>e,
        0,
        1,
        e
    ),
    GROUPBY(
        a,
        f-b,
        AVERAGE,
        ,
        0,
        ,
        f>0
    )
)
Excel solution 6 for Custom Average!, proposed by Imam Hambali:
=LET(
pid,
    B3:B21,od,
     C3:C21,dd,
     D3:D21,do,
     dd-od,co,
     "2024-08-20"-od,vg,
     VLOOKUP(
         pid,
          GROUPBY(
              FILTER(
                  pid,
                   do>0
              ),
               FILTER(
                   do,
                    do>0
               ),
              AVERAGE,
              0,
              0
          ),
         2,
         0
     ),cf,
     (--(do>0) + --(co>vg)),GROUPBY(
    FILTER(
        pid,
         cf
    ),
     FILTER(
         IF(
             dd>0,
             do,
             co
         ),
          cf
     ),
     AVERAGE,
    0,
    0
)
)
Excel solution 7 for Custom Average!, proposed by Bilal Mahmoud kh.:
=MAP(UNIQUE(
    B3:B21
),
    LAMBDA(P,
    LET(n,
    DATEDIF(FILTER(C3:C21,
    (B3:B21=P)*(D3:D21<>"")),
    FILTER(D3:D21,
    (B3:B21=P)*(D3:D21<>"")),
    "d"),
    AVERAGE(LET(dd,
    DATEDIF(FILTER(C3:C21,
    (B3:B21=P)*(D3:D21="")),
    "08/20/2024",
    "d"),
    dds,
    IF(
        dd>AVERAGE(
            n
        ),
        dd,
        0
    ),
    ddr,
    FILTER(
        dds,
        dds<>0,
        0
    ),
    IF(
        ddr=0,
        n,
        VSTACK(
            ddr,
            n
        )
    ))))))
Excel solution 8 for Custom Average!, proposed by Eddy Wijaya:
=LET(
dat,
    "8/20/24",data,
    B3:D21,prod,
    CHOOSECOLS(
        data,
        1
    ),HSTACK(UNIQUE(
    prod
),
    MAP(UNIQUE(
    prod
),
    LAMBDA(m,LET(
eachDB,
    FILTER(
        data,
        prod=m
    ),calcDiff,
    BYROW(
        eachDB,
        LAMBDA(
            r,
            LET(

                diff,
                CHOOSECOLS(
                    r,
                    -1
                )-CHOOSECOLS(
                    r,
                    2
                ),

                IF(
                    diff<0,
                    dat-CHOOSECOLS(
                    r,
                    2
                ),
                    diff
                )
            )
        )
    ),modDb,
    HSTACK(
        eachDB,
        calcDiff
    ),filledDate,
    FILTER(
        modDb,
        CHOOSECOLS(
            modDb,
            3
        )<>""
    ),avg_a,
    BYCOL(
        TAKE(
            filledDate,
            ,
            -1
        ),
        LAMBDA(
            c,
            AVERAGE(
                c
            )
        )
    ),recalc,
    FILTER(modDb,
    (CHOOSECOLS(
            modDb,
            3
        )="")*(avg_a
Excel solution 9 for Custom Average!, proposed by Peter Bartholomew:
= LET(     today,
         DATE(
        2024,
         8,
         20
    ),     deliveryTimes,
     FILTER(
         Delivery_Date - Order_Date,
          Delivery_Date<>""
     ),     deliveredProd,
     FILTER(
         Product_ID,
          Delivery_Date<>""
     ),     averageDays,
      GROUPBY(
        deliveredProd,
         deliveryTimes,
         AVERAGE,
        ,
        0
    ),     undeliveredPr,
     FILTER(
         Product_ID,
          Delivery_Date=""
     ),     undelivOrderD,
     FILTER(
         Order_Date,
          Delivery_Date=""
     ),     expecteddate,
     undelivOrderD + LOOKUP(
        undeliveredPr,
         averageDays
    ),     includedProd,
     VSTACK(
        deliveredProd,
         FILTER(
             undeliveredPr,
              expecteddate
Solving the challenge of Custom Average! with Python
Python solution 1 for Custom Average!, proposed by Konrad Gryczan, PhD:
import pandas as pd
import numpy as np

path = "CH-103 Custom Average.xlsx"
input = pd.read_excel(path, usecols="B:D", skiprows = 1, nrows = 19)
test = pd.read_excel(path, usecols="I:J", skiprows = 1, nrows = 4)

today = pd.to_datetime("2024-08-20")

input["Delivery Time"] = (input["Delivery Date"] - input["Order Date"]).dt.days
input["Adjusted Delivery Time"] = np.where(input["Delivery Date"].isnull(), (today - input["Order Date"]).dt.days, input["Delivery Time"])
input = input[input["Delivery Time"].notnull() | (input["Adjusted Delivery Time"] > input.groupby("Product ID")["Delivery Time"].transform("mean"))]
 .groupby("Product ID")["Adjusted Delivery Time"].mean().reset_index()

print(input["Adjusted Delivery Time"].equals(test["Avg delivery time"])) # True
Solving the challenge of Custom Average! with Python in Excel
Python in Excel solution 1 for Custom Average!, proposed by Alejandro Campos:
import datetime
df = xl("B2:D21", headers=True)

df['Order Date'], df['Delivery Date'] = pd.to_datetime(df['Order Date'], format='%d/%m/%Y'), pd.to_datetime(df['Delivery Date'], format='%d/%m/%Y', errors='coerce')
df['Delivery Time'] = (df['Delivery Date'] - df['Order Date']).dt.days
avg_delivery = df.dropna(subset=['Delivery Date']).groupby('Product ID')['Delivery Time'].mean()

today = pd.Timestamp('2024-08-20')
df['Days Passed'] = (today - df['Order Date']).dt.days

df['Adjusted Delivery Time'] = df.apply(
 lambda row: (row['Days Passed'] if pd.isna(row['Delivery Date']) and row['Days Passed'] > avg_delivery.get(row['Product ID'], 0) else row['Delivery Time']),
 axis=1)

result = df.groupby('Product ID')['Adjusted Delivery Time'].mean().reset_index().rename(columns={'Adjusted Delivery Time': 'Avg delivery time'})
Solving the challenge of Custom Average! with R
R solution 1 for Custom Average!, proposed by Konrad Gryczan, PhD:
library(tidyverse)
library(readxl)

path = "files/CH-103 Custom Average.xlsx"
input = read_excel(path, range = "B2:D21")
test = read_excel(path, range = "I2:J6")

today = as.POSIXct(as.Date("2024-08-20"))

result = input %>%
 mutate(del_time = as.numeric(`Delivery Date` - `Order Date`),
 adj_del_time = ifelse(is.na(`Delivery Date`), today - `Order Date`, del_time)) %>%
 mutate(avg_del_time = mean(del_time, na.rm = T), .by = `Product ID`) %>%
 filter(!is.na(del_time) | adj_del_time >= avg_del_time) %>%
 summarise(`Avg delivery time` = mean(adj_del_time, na.rm = T), .by = `Product ID`) %>%
 arrange(`Product ID`)

identical(result$`Avg delivery time`, test$`Avg delivery time`)
#> [1] TRUE
Solving the challenge of Custom Average! with Google Sheets
Google Sheets solution 1 for Custom Average!, proposed by Peter Krkos:
PowerQuery Solution:
https://docs.google.com/spreadsheets/d/1zR5IZLz8OT76vhaPEHfsPrw8-RDKnLyyqS49IJjdhFk/edit?usp=sharing