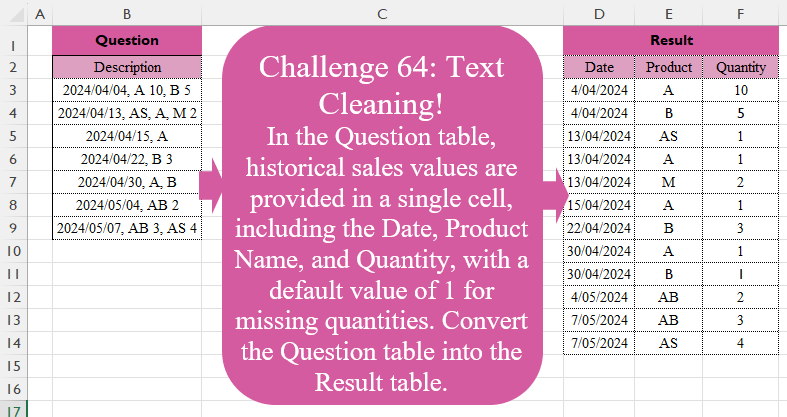
Challenge No. 64: In the Question table, historical sales values are provided in a single cell, including the Date, Product Name, and Quantity, with a default value of 1 for missing quantities.
Solved using:Excel (DROP, HSTACK, IFERROR), Power Query (List.Transform, Text.Split, Table.Split), Python, R, and VBA.
Python
Python programming for data analysis
Custom Splitter!
Challenge No. 63: In the Question table, sales information including Date, Product Name, and Quantity is provided without any separators.
Solved using:Excel (CHAR, HSTACK, LAMBDA), Power Query (List.Contains, Table.Combine, Table.FromRows), Python, R, and VBA.
Missing Values! Part 2
Challenge No. 62: The question table presents the actual progress of 3 projects at the end of each month, but some values are missing.
Solved using:Excel (DATE, DROP, IF), Power Query (Date.Month), Python, and R.
Sales Per Customer
Challenge No. 61: In Question Table 1, sales transactions are provided.
Solved using:Excel (FILTER, HSTACK, IF), Power Query (Table.Group, Table.Sort), Python, R, and VBA.
Match Payments!
Challenge No. 60: The customer receipt costs and their payments are provided in Question Tables 1 and 2.
Solved using:Excel, Power Query, and R.
Merge Columns
Challenge No. 59: The power consumption of a house every 30 minutes on different dates is provided in the question table.
Solved using:Excel (CHOOSECOLS, FILTER, HSTACK), Power Query (List.Distinct, List.Skip, List.Split), Python, Python in Excel, and R.
Stepped Tax!
Challenge No. 58: In this challenge, we aim to find an efficient way to calculate the stepped tax based on the tax rates presented in the question table.
Solved using:Excel (LAMBDA, LET, MAP), Power Query (Table.AddColumn), Python, and R.
Process Efficiency!
Challenge No. 56: In Question Table 2, the sequence of machinery based on the process type is presented, and historical machinery data is provided in Question Table 1.
Solved using:Excel, and Power Query.
Warehouse Management!
Challenge No. 55: In the question table, transactions for different products are presented.
Solved using:Excel (FILTER, HSTACK, INDEX), Power Query (List.Distinct, Table.Group, Table.Pivot), Python, and R.
Missing Values! Part 1
Challenge No. 54: The table presents the actual progress of three projects at the end of each month, but some values are missing.
Solved using:Excel (DATE, DROP, EOMONTH), Power Query (List.Transform, Table.Group, Table.TransformColumnTypes), Python, and R.
