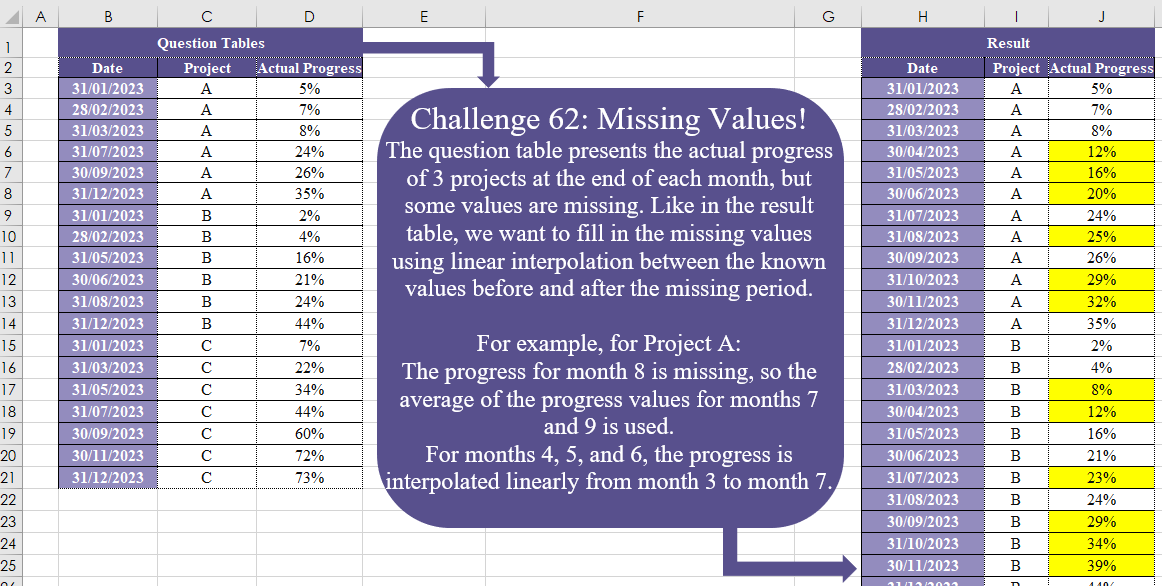
The question table presents the actual progress of 3 projects at the end of each month, but some values are missing. Like in the result table, we want to fill in the missing values using linear interpolation between the known values before and after the missing period. For example, for Project A: The progress for month 8 is missing, so the average of the progress values for months 7 and 9 is used. For months 4, 5, and 6, the progress is interpolated linearly from month 3 to month 7
📌 Challenge Details and Links
Challenge Number: 62
Challenge Difficulty: ⭐⭐⭐⭐
📥Download Sample File
📥Link to the solutions on LinkedIn
Solving the challenge of Missing Values! Part 2 with Power Query
Power Query solution 1 for Missing Values! Part 2, proposed by Omid Motamedisedeh:
let
  Source = Excel.CurrentWorkbook(){[Name = "Table1"]}[Content],
  S1 = Table.TransformColumns(Source, {{"Date", Date.Month}}),
  Result = Table.FromRows(
    List.Combine(
      List.Transform(
        {"A" .. "C"},
        (r) =>
          List.Accumulate(
            {1 .. 12},
            {},
            (a, b) =>
              a
                & {
                  [
                    y1 = Table.Last(Table.SelectRows(S1, each _[Project] = r and _[Date] <= b)),
                    y2 = Table.SelectRows(S1, each _[Project] = r and _[Date] >= b){0},
                    z = y1[Actual Progress]
                      + (b - y1[Date])
                      * (y2[Actual Progress] - y1[Actual Progress])
                      / List.Max({y2[Date] - y1[Date], 1}),
                    w = {Date.EndOfMonth(#date(2023, b, 1)), r, z}
                  ][w]
                }
          )
      )
    ),
    Table.ColumnNames(S1)
  )
in
  Result
Power Query solution 2 for Missing Values! Part 2, proposed by Aditya Kumar Darak 🇮🇳:
let
  Source = Excel.CurrentWorkbook(){[Name = "data"]}[Content],
  Type = Table.TransformColumnTypes(Source, {"Date", type date}),
  MyFun = (start_date, end_date) =>
    Date.Year(end_date)
      * 12 + Date.Month(end_date) - Date.Year(start_date)
      * 12 - Date.Month(start_date) + 1,
  Group = Table.Group(
    Type,
    "Project",
    {
      "R",
      each List.Generate(
        () => [a = List.Min([Date]), b = _{[Date = a]}[Actual Progress]],
        (f) => f[a] <= List.Max([Date]),
        (f) => [
          a = Date.EndOfMonth(Date.AddMonths(f[a], 1)),
          b = _{[Date = a]}?[Actual Progress]? ?? f[b] + e,
          c = Table.SelectRows(_, (x) => x[Date] >= a){0},
          d = MyFun(a, c[Date]),
          e = (c[Actual Progress] - f[b]) / d
        ],
        (f) => [Date = f[a], Project = _{0}[Project], Actual Progress = f[b]]
      )
    }
  ),
  Return = Table.FromRecords(List.Combine(Group[R]))
in
  Return
Power Query solution 3 for Missing Values! Part 2, proposed by Alejandro Simón 🇵🇦 🇪🇸:
let
 Source = Excel.CurrentWorkbook(){[Name="Table1"]}[Content],
 Type = Table.TransformColumnTypes(Source,{{"Date", type date}}),
 Sol = Table.Combine(Table.Group(Type, {"Project"}, {{"A", each
let
a = _,
b = List.Transform(a[Date], each Date.Month(_)),
c = {b{0}..List.Last(b)},
d = List.Transform(List.Difference(c,b), each {Date.EndOfMonth(
hashtag
#date(2023,_,1)), a[Project]{0}, null}),
e = Table.Sort(a&Table.FromRows(d, Table.ColumnNames(a)), "Date"),
f = Table.Group(e, {"Actual Progress"}, {{"A", each _}, {"B", each Table.RowCount(_)}},0),
g = Table.AddIndexColumn(f, "Idx", 0,1),
h = List.Combine(Table.AddColumn(g, "N", each if [Actual Progress] <> null then {[Actual Progress]} else List.Transform({1..[B]}, (x)=> g[Actual Progress]{[Idx]-1}+(g[Actual Progress]{[Idx]+1}-g[Actual Progress]{[Idx]-1})/([B]+1)*x))[N]),
i = Table.FromColumns(List.RemoveLastN(Table.ToColumns(e))&{h}, Table.ColumnNames(e))
in i}})[A])
in
 Sol
Power Query solution 4 for Missing Values! Part 2, proposed by Daniel Madhadha:
let
  Source = Excel.CurrentWorkbook(){[Name = "Table1"]}[Content],
  Type = Table.TransformColumnTypes(
    Source,
    {{"Date", type date}, {"Actual Progress", Percentage.Type}}
  ),
  ChangeDate = (start_date, end_date) =>
    Date.Year(end_date)
      * 12 + Date.Month(end_date) - Date.Year(start_date)
      * 12 - Date.Month(start_date) + 1,
  Group = Table.Group(
    Type,
    "Project",
    {
      "R",
      each List.Generate(
        () => [a = List.Min([Date]), b = _{[Date = a]}[Actual Progress]],
        (f) => f[a] <= List.Max([Date]),
        (f) => [
          a = Date.EndOfMonth(Date.AddMonths(f[a], 1)),
          b = _{[Date = a]}?[Actual Progress]? ?? f[b] + e,
          c = Table.SelectRows(_, (x) => x[Date] >= a){0},
          d = ChangeDate(a, c[Date]),
          e = (c[Actual Progress] - f[b]) / d
        ],
        (f) => [Date = f[a], Project = _{0}[Project], Actual Progress = f[b]]
      )
    }
  ),
  Return = Table.FromRecords(List.Combine(Group[R]))
in
  ReturnAssisted
Solving the challenge of Missing Values! Part 2 with Excel
Excel solution 1 for Missing Values! Part 2, proposed by Bo Rydobon 🇹🇭:
=LET(
    d,
    B3:B21,
    p,
    C3:C21,
    REDUCE(
        B2:D2,
        UNIQUE(
            p
        ),
        LAMBDA(
            a,
            v,
            LET(
                s,
                SEQUENCE(
                    12
                ),
                e,
                EOMONTH(
                    B3,
                    s-1
                ),

                VSTACK(
                    a,
                    HSTACK(
                        e,
                        IF(
                            s,
                            v
                        ),
                        MAP(
                            e,
                            LAMBDA(
                                x,
                                LET(
                                    n,
                                    XMATCH(
                                        v&x,
                                        p&d,
                                        {-1,
                                        1}
                                    ),
                                    TREND(
                                        INDEX(
                                            D3:D21,
                                            n
                                        ),
                                        MONTH(
                                            INDEX(
                                                d,
                                                n
                                            )
                                        ),
                                        MONTH(
                                            x
                                        )
                                    )
                                )
                            )
                        )
                    )
                )
            )
        )
    )
)
Excel solution 2 for Missing Values! Part 2, proposed by 🇰🇷 Taeyong Shin:
=LET(
    d,
    B3:B21,
    c,
    C3:C21,
    s,
    TOCOL(
        UNIQUE(
            c
        )&EDATE(
            @+d,
            SEQUENCE(
                ,
                12,
                0
            )
        )
    ),
    MAP(
        s&{"",
        "",
        ""},
        IFNA(
            {1,
            2,
            3},
            s
        ),
        LAMBDA(
            x,
            i,
            LET(
                n,
                IFNA(
                    XMATCH(
                        x,
                        c&d,
                        {-1,
                        1}
                    ),
                    ROWS(
                        d
                    )
                ),
                a,
                LEFT(
                    x
                ),
                dt,
                NUMBERVALUE(
                    x,
                    " ",
                    a
                ),
                CHOOSE(
                    i,
                    dt,
                    a,
                    TREND(
                        INDEX(
                            D3:D21,
                            n
                        ),
                        INDEX(
                            d,
                            n
                        ),
                        dt
                    )
                )
            )
        )
    )
)
Excel solution 3 for Missing Values! Part 2, proposed by محمد حلمي:
=LET(
    c,
    C3:C21,
    y,
    TOCOL(
        EDATE(
            B3,
            SEQUENCE(
                ,
                12,
                0
            )
        )&UNIQUE(
            c
        )
    ),    i,
    XLOOKUP(
        y,
        B3:B21&c,
        D3:D21
    ),
    HSTACK(
        --LEFT(
            y,
            5
        ),
        RIGHT(
            y
        ),        ROUND(
            SCAN(
                0,
                SEQUENCE(
                    ROWS(
                        i
                    )
                ),
                LAMBDA(
                    a,
                    v,
                    LET(

                        j,
                        DROP(
                            i,
                            v-1
                        ),

                        IFNA(
                            @j,
                            a+@TOCOL(
                                j-a,
                                2
                            )/XMATCH(
                                0,
                                -ISNA(
                                    j
                                )
                            )
                        )
                    )
                )
            ),
            2
        )
    )
)

////

Not same value always

=REDUCE(
    B2:D2,
    UNIQUE(
        C3:C21
    ),
    LAMBDA(
        a,
        v,
        LET(
            x,
            C3:C21=v,

            b,
            FILTER(
                B3:B21,
                x
            ),
            d,
            FILTER(
                D3:D21,
                x
            ),
            n,
            EDATE(
                @b,
                SEQUENCE(
                    12
                )-1
            ),

            VSTACK(
                a,
                CHOOSE(
                    {1,
                    2,
                    3},
                    n,
                    v,
                     IFNA(
                         XLOOKUP(
                             n,
                             b,
                             d
                         ),
                         TREND(
                             d,
                             b,
                             n
                         )
                     )
                )
            )
        )
    )
)
Excel solution 4 for Missing Values! Part 2, proposed by محمد حلمي:
=LET(
    c,
    C3:C21,
    y,
    TOCOL(
        EDATE(
            B3,
            SEQUENCE(
                ,
                12,
                0
            )
        )&UNIQUE(
            c
        )
    ),    i,
    XLOOKUP(
        y,
        B3:B21&c,
        D3:D21
    ),
    HSTACK(
        --LEFT(
            y,
            5
        ),
        RIGHT(
            y
        ),        SCAN(
            0,
            SEQUENCE(
                ROWS(
                    i
                )
            ),
            LAMBDA(
                a,
                v,
                LET(
                    j,
                    DROP(
                        i,
                        v-1
                    ),

                    IFNA(
                        @j,
                        a+@TOCOL(
                            j-a,
                            2
                        )/XMATCH(
                            0,
                            -ISNA(
                                j
                            )
                        )
                    )
                )
            )
        )
    )
)
Excel solution 5 for Missing Values! Part 2, proposed by Julian Poeltl:
=LET(T,
    B2:D21,
    TT,
    DROP(
        T,
        1
    ),
    D,
    TAKE(
        TT,
        ,
        1
    ),
    SD,
    MIN(
        D
    ),
    ED,
    MAX(
        D
    ),
    P,
    CHOOSECOLS(
        TT,
        2
    ),
    UP,
    UNIQUE(
        P
    ),
    AP,
    DROP(
        TT,
        ,
        2
    ),
    Dur,
    MONTH(
        ED
    )-MONTH(
        SD
    )+1,
    Se,
    EOMONTH(
        DATE(
            YEAR(
        SD
    ),
            SEQUENCE(
                Dur
            ),
            1
        ),
        0
    ),
    R,
    MAP(UP,
    LAMBDA(A,
    LET(BV,
    XLOOKUP(
        A&Se,
        P&D,
        AP,
        ,
        -1
    ),
    EV,
    XLOOKUP(
        A&Se,
        P&D,
        AP,
        ,
        1
    ),
    BM,
    MONTH(
        XLOOKUP(
            A&Se,
            P&D,
            D,
            ,
            -1
        )
    ),
    EM,
    MONTH(
        XLOOKUP(
            A&Se,
            P&D,
            D,
            ,
            1
        )
    ),
    IP,
    IF(BV=EV,
    BV,
    BV+(EV-BV)/(EM-BM)*(MONTH(
        Se
    )-BM)),
    TEXTJOIN(
        ",",
        ,
        VSTACK(
            Se,
            REPT(
                A&",",
                Dur
            ),
            IP
        )
    )))),
    Z,
    SUBSTITUTE(
        TEXTJOIN(
            ",",
            ,
            R
        ),
        ",,",
        ","
    ),
    ST,
    VSTACK(
        TAKE(
        T,
        1
    ),
        SORT(
            WRAPROWS(
                TOCOL(
                    WRAPCOLS(
                        TEXTSPLIT(
                            Z,
                            ,
                            ","
                        ),
                        Dur
                    )
                ),
                3
            ),
            2
        )
    ),
    IFERROR(
        ST*1,
        ST
    ))
Excel solution 6 for Missing Values! Part 2, proposed by Kris Jaganah:
=LET(a,
    B3:B21,
    b,
    C3:C21,
    c,
    D3:D21,
    d,
    VSTACK(
        DROP(
            a,
            1
        ),
        TAKE(
            a,
            1
        )
    ),
    e,
    VSTACK(
        DROP(
            b,
            1
        ),
        TAKE(
            b,
            1
        )
    ),
    f,
    VSTACK(
        DROP(
            c,
            1
        ),
        TAKE(
            c,
            1
        )
    ),
    g,
    MONTH(
        a
    ),
    h,
    MONTH(
        d
    )-g,
    i,
    IF(b=e,
    (f-c)/h,
    c),
    j,
    TOCOL(
        EOMONTH(
            TAKE(
            a,
            1
        ),
            SEQUENCE(
                ,
                12,
                0
            )
        )&UNIQUE(
            b
        )
    ),
    k,
    --LEFT(
        j,
        5
    ),
    l,
    RIGHT(
        j
    ),
    m,
    XLOOKUP(
        j,
        a&b,
        c,
        0
    ),
    n,
    VSTACK(
        0,
        DROP(
            m,
            -1
        )
    ),
    o,
    MAP(k,
    l,
    m,
    LAMBDA(x,
    y,
    z,
    IF(z=0,
    TAKE(FILTER(i,
    (d>=x)*(e=y)),
    1),
    0))),
    p,
    IF(
        o>0,
        n+o,
        0
    ),
    VSTACK(
        {"Date",
        "Project",
        "Actual Progress"},
        HSTACK(
            k,
            l,
            SCAN(
                ,
                p,
                LAMBDA(
                    x,
                    y,
                    IF(
                        y>0,
                        x+y,
                        y
                    )
                )
            )+m
        )
    ))
Excel solution 7 for Missing Values! Part 2, proposed by Sunny Baggu:
=LET(
 m,
     SEQUENCE(
         12
     ), _u,
     UNIQUE(
         C3:C21
     ), _a,
     TOCOL(
         IF(
             SEQUENCE(
                 ,
                  ROWS(
                      _u
                  )
             ),
              EOMONTH(
                  DATE(
                      YEAR(
                          B3
                      ),
                       m,
                       1
                  ),
                   0
              ),

         ),
          ,
          1
     ), _b,
     TOCOL(
         IF(
             m,
              TOROW(
                      _u
                  )
         ),
          ,
          1
     ), _c,
     XLOOKUP(
         _a & _b,
          B3:B21 & C3:C21,
          D3:D21
     ), _s,
     SEQUENCE(
         ROWS(
             _c
         )
     ), _e1,
     LAMBDA(
         arr,
          SCAN(
              0,
               arr,
               LAMBDA(
                   a,
                    v,
                    IF(
                        ISERROR(
                            v
                        ),
                         a,
                         v
                    )
               )
          )
     ), _fd,
     _e1(
             _c
         ), _fu,
     SORTBY(_e1(SORTBY(
         _c,
          _s,
          -1
     )),
     _s,
     -1), _ll,
     XMATCH(
         _b & _fd,
          _b & _fd
     ), _ul,
     XMATCH(
         _b & _fd,
          _b & _fd,
          1,
          -1
     ) + 1, _r,
     TOCOL(
         IF(
             SEQUENCE(
                 ,
                  ROWS(
                      _u
                  )
             ),
              m
         ),
          ,
          1
     ), HSTACK(      _a,      _b,      MAP(           _fd,           _fu,           _ll,           _ul,           _s,           LAMBDA(
               r,
                s,
                t,
                u,
                v,
                FORECAST.LINEAR(
                    v,
                     VSTACK(
                         r,
                          s
                     ),
                     VSTACK(
                         t,
                          u
                     )
                )
           )

      ) )
)
Solving the challenge of Missing Values! Part 2 with Python
Python solution 1 for Missing Values! Part 2, proposed by Konrad Gryczan, PhD:
import pandas as pd
from datetime import timedelta
from scipy.interpolate import interpolate

input = pd.read_excel("CH-062 Missing Values.xlsx", usecols="B:D", skiprows=1, nrows=19)
test = pd.read_excel("CH-062 Missing Values.xlsx", usecols="H:J", skiprows=1)
test.columns = test.columns.str.replace('.1', '')

input["Date"] = pd.to_datetime(input["Date"]) + timedelta(days=1)
all_dates = pd.date_range(start=input["Date"].min(), end=input["Date"].max(), freq='MS')
all_dates = pd.DataFrame(all_dates, columns=["Date"])
all_dates["Date"] = pd.to_datetime(all_dates["Date"]) - timedelta(days=1)
input["Date"] = pd.to_datetime(input["Date"]) - timedelta(days=1)

all_projects = pd.DataFrame(input["Project"].unique(), columns=["Project"])

all_dates["key"] = 0
all_projects["key"] = 0
all_dates = all_dates.merge(all_projects, on="key").drop(columns=["key"]).sort_values(["Project","Date"]).reset_index().drop(columns="index")

all_dates = all_dates.merge(input, on=["Project","Date"], how="left")

all_dates["Actual Progress"] = all_dates.groupby("Project")["Actual Progress"].transform(lambda x: x.interpolate())

print(all_dates["Actual Progress"].round(4).equals(test["Actual Progress"].round(4)))
Solving the challenge of Missing Values! Part 2 with R
R solution 1 for Missing Values! Part 2, proposed by Konrad Gryczan, PhD:
library(tidyverse)
library(readxl)
library(zoo)
library(padr)

input = read_excel("files/CH-062 Missing Values.xlsx", range = "B2:D21")
test = read_excel("files/CH-062 Missing Values.xlsx", range = "H2:J38")

result = input %>%
 mutate(Date = Date + days(1)) %>%
 group_by(Project) %>%
 pad() %>%
 mutate(`Actual Progress` = na.approx(`Actual Progress`)) %>%
 ungroup() %>%
 mutate(Date = Date - days(1))

all.equal(test,result)
#> [1] TRUE
R solution 2 for Missing Values! Part 2, proposed by Anil Kumar Goyal:
ashtag
#rstats

data <- read_excel("OM Challanges/CH-062 Missing Values.xlsx", range = "B2:D21")

data %>%
 mutate(Date = as.Date(Date)) %>%
 group_by(Project) %>%
 complete(Date = seq.Date(min(Date)+1, max(Date)+1, by = "months")-1) %>%
 mutate(`Actual Progress` = scales::percent(as.vector(imputeTS::na_interpolation(as.ts(`Actual Progress`)))))