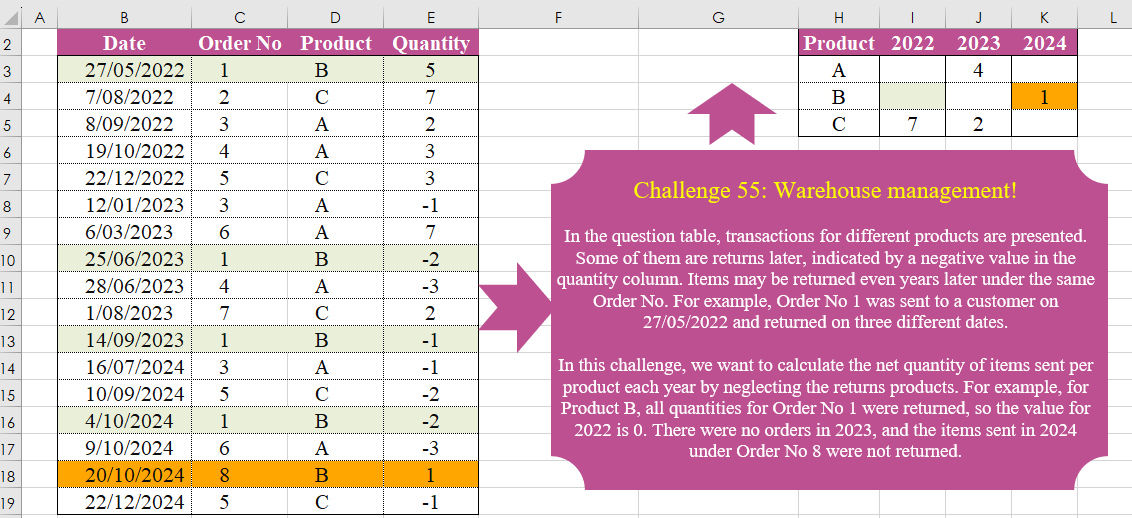
In the question table, transactions for different products are presented. Some of them are returns later, indicated by a negative value in the quantity column. Items may be returned even years later under the same Order No. For example, Order No 1 was sent to a customer on 27/05/2022 and returned on three different dates. In this challenge, we want to calculate the net quantity of items sent per product each year by neglecting the returns of products. For example, for Product B, all quantities for Order No 1 were returned, so the value for 2022 is 0. There were no orders in 2023, and the items sent in 2024 under Order No 8 were not returned.
📌 Challenge Details and Links
Challenge Number: 55
Challenge Difficulty: ⭐⭐⭐⭐
📥Download Sample File
📥Link to the solutions on LinkedIn
Solving the challenge of Warehouse Management! with Power Query
Power Query solution 1 for Warehouse Management!, proposed by Brian Julius:
let
  Source = Excel.CurrentWorkbook(){[Name = "Table1"]}[Content],
  ExtractYear = Table.TransformColumns(Source, {{"Date", Date.Year, Int64.Type}}),
  Group = Table.Group(
    ExtractYear,
    {"Order No", "Product"},
    {
      {"TotalQ", each List.Sum([Quantity]), type number},
      {"MinYear", each List.Min([Date]), type number}
    }
  ),
  RemCol = Table.RemoveColumns(Group, {"Order No"}),
  Pivot = Table.Pivot(
    Table.TransformColumnTypes(RemCol, {{"MinYear", type text}}, "en-US"),
    List.Distinct(Table.TransformColumnTypes(RemCol, {{"MinYear", type text}}, "en-US")[MinYear]),
    "MinYear",
    "TotalQ",
    List.Sum
  )
in
  Pivot
Power Query solution 2 for Warehouse Management!, proposed by Luan Rodrigues:
let
  Fonte = Tabela1,
  gp = Table.Group(
    Fonte,
    {"Product", "Order No"},
    {
      {"Data", each List.Transform([Date], each DateTime.ToText(_, "yyyy")){0}},
      {"soma", each List.Sum([Quantity])}
    }
  )[[Product], [Data], [soma]],
  res = Table.Pivot(gp, List.Distinct(gp[Data]), "Data", "soma", List.Sum)
in
  res
Power Query solution 3 for Warehouse Management!, proposed by Aditya Kumar Darak 🇮🇳:
let
  Source = Excel.CurrentWorkbook(){[Name = "data"]}[Content],
  Group = Table.Group(
    Source,
    {"Product", "Order No"},
    {{"Y", each DateTime.ToText(List.Min([Date]), "yyyy")}, {"Q", each List.Sum([Quantity])}}
  ),
  Remove = Table.RemoveColumns(Group, {"Order No"}),
  Pivot = Table.Pivot(
    Remove,
    List.Distinct(Remove[Y]),
    "Y",
    "Q",
    each if List.Sum(_) = 0 then null else List.Sum(_)
  )
in
  Pivot
Power Query solution 4 for Warehouse Management!, proposed by Alejandro Simón 🇵🇦 🇪🇸:
let
 Source = Excel.CurrentWorkbook(){[Name="Table1"]}[Content],
 Group = Table.SelectRows(Table.Combine(Table.Group(Source, {"Order No", "Product"}, {{"A", each
let
b = List.Sum([Quantity]),
c = Text.From(Date.Year(Date.From([Date]{0}))),
d = Table.FromColumns({{[Product]{0}},{c},{if b=0 then null else b}}, {"Product", "B","C"})
in d}})[A]), each [C]<>null),
 Sol = Table.Pivot(Group, List.Distinct(Group[B]), "B", "C")
in
 Sol
Power Query solution 5 for Warehouse Management!, proposed by Alexis Olson:
let
  Source = Excel.CurrentWorkbook(){[Name = "Table1"]}[Content],
  Group = Table.Group(
    Source,
    {"Order No", "Product"},
    {{"Quantity", each List.Sum([Quantity])}, {"Year", each Text.From(Date.Year(List.Min([Date])))}}
  ),
  Cleanup = Table.RemoveColumns(Group, {"Order No"}),
  Pivot = Table.Pivot(Cleanup, List.Distinct(Cleanup[Year]), "Year", "Quantity", List.Sum)
in
  Pivot
Power Query solution 6 for Warehouse Management!, proposed by Kris Jaganah:
let
  Source = Excel.CurrentWorkbook(){[Name = "Table1"]}[Content],
  Qty = Table.AddColumn(
    Source,
    "Qty",
    each
      let
        a = List.Sum(Table.SelectRows(Source, (x) => x[Order No] = [Order No])[Quantity])
      in
        if [Quantity] > 0 and a > 0 then a else null
  ),
  Year = Table.AddColumn(Qty, "Year", each Text.From(Date.Year([Date]))),
  Keep = Table.SelectColumns(Year, {"Year", "Qty", "Product"}),
  Pivot = Table.Pivot(Keep, List.Distinct(Keep[Year]), "Year", "Qty", List.Sum)
in
  Pivot
Power Query solution 7 for Warehouse Management!, proposed by 🇮🇷 Navid Esmaeilzadeh اسماعیل زاده:
let
  Source = Excel.CurrentWorkbook(){[Name = "Table1"]}[Content],
  A = Table.TransformColumns(Source, {{"Date", Date.Year, Int64.Type}}),
  B = Table.Group(
    A,
    {"Order No"},
    {
      {
        "Tbl",
        each _,
        type table [
          Date = number,
          Order No = nullable number,
          Product = nullable text,
          Quantity = nullable number
        ]
      }
    }
  ),
  M = (FX) =>
    let
      S = Table.Sort(FX, {{"Date", Order.Ascending}}),
      A = Table.AddColumn(S, "TQ", each if [Quantity] > 0 then List.Sum(S[Quantity]) else null),
      B = Table.SelectRows(A, each ([TQ] <> null))
    in
      B,
  C = Table.AddColumn(B, "M", each M([Tbl])),
  D = Table.SelectColumns(C, {"M"}),
  E = Table.ExpandTableColumn(D, "M", {"Date", "Product", "TQ"}, {"Date", "Product", "TQ"}),
  F = Table.ReplaceValue(E, 0, null, Replacer.ReplaceValue, {"TQ"}),
  Sol = Table.Pivot(
    Table.TransformColumnTypes(F, {{"Date", type text}}, "en-US"),
    List.Distinct(Table.TransformColumnTypes(F, {{"Date", type text}}, "en-US")[Date]),
    "Date",
    "TQ",
    List.Sum
  )
in
  Sol
Solving the challenge of Warehouse Management! with Excel
Excel solution 1 for Warehouse Management!, proposed by Bo Rydobon 🇹🇭:
=LET(
    o,
    C3:C19,
    u,
    UNIQUE(
        o
    ),
    s,
    SUMIFS(
        E3:E19,
        o,
        u
    ),
    PIVOTBY(
        XLOOKUP(
            u,
            o,
            D3:D19
        ),
        XLOOKUP(
            u,
            o,
            YEAR(
                B3:B19
            )
        ),
        s,
        SUM,
        ,
        0,
        ,
        0,
        ,
        s
    )
)
Excel solution 2 for Warehouse Management!, proposed by محمد حلمي:
=MAP(I2:K2&H3:H5,
    LAMBDA(a,
    LET(
c,
    C3:C19,
    d,
    D3:D19,
    SUM((a=YEAR(
        B3:B19
    )&d)*(XMATCH(
        c,
        c
    )=ROW(
        c
    )-2)*SUMIFS(
        E3:E19,
        d,
        d,
        c,
        c
    )))))
Excel solution 3 for Warehouse Management!, proposed by محمد حلمي:
=LET(c,
    C3:C17,
    u,
    UNIQUE(
        c
    ),
    SORT(HSTACK(u,MAP(u,
    LAMBDA(a,
    LET(j,
    FILTER(
        B3:B17,
        c=a
    ),SUM(SCAN(0,
    SEQUENCE(
        ROWS(
            j
        )
    ),
    LAMBDA(i,
    v,(INDEX(
    j,
    v
)=WORKDAY(
    INDEX(
        VSTACK(
            0,
            j
        ),
        v
    ),
    1
))*i+1)))))))))
Excel solution 4 for Warehouse Management!, proposed by 🇵🇪 Ned Navarrete C.:
=LET(
    a,
    D3:D19,
    b,
    C3:C19,
    u,
    SORT(
        UNIQUE(
            a&b
        )
    ),
    p,
    LEFT(
        u
    ),
    n,
    RIGHT(
        u
    ),
    q,
    SUMIFS(
        E3:E19,
        a,
        p,
        b,
        n
    ),
    d,
    YEAR(
        MINIFS(
            B3:B19,
            a,
            p,
            b,
            n
        )
    ),
    i,
    UNIQUE(
        p
    ),
    j,
    TOROW(
        UNIQUE(
            d
        )
    ),
    x,
    IFNA(
        XLOOKUP(
            i&j,
            p&d,
            q
        ),    ),
    IF(
        x,
        x,
        ""
    )
)
Excel solution 5 for Warehouse Management!, proposed by Owen Price:
=LET(    grp,
    GROUPBY(
        C3:D19,
        HSTACK(
            E3:E19,
            YEAR(
                B3:B19
            )
        ),
        HSTACK(
            SUM,
            MIN
        ),
        0,
        0
    ),    c,
    LAMBDA(
        i,
        INDEX(
            grp,
            ,
            i
        )
    ),    piv,
    PIVOTBY(
        c(
            2
        ),
        c(
            4
        ),
        c(
            3
        ),
        MAX,
        0,
        0,
        ,
        0,
        ,
        c(
            2
        )<>""
    ),    IF(
        piv=0,
        "",
        piv
    ))
Excel solution 6 for Warehouse Management!, proposed by Julian Poeltl:
=LET(T,
    B3:E19,
    Y,
    YEAR(
        TAKE(
            T,
            ,
            1
        )
    ),
    O,
    CHOOSECOLS(
        T,
        2
    ),
    P,
    CHOOSECOLS(
        T,
        3
    ),
    Q,
    TAKE(
        T,
        ,
        -1
    ),
    UO,
    UNIQUE(
        O
    ),
    QS,
    MAP(
        UO,
        LAMBDA(
            A,
            SUM(
                FILTER(
                    Q,
                    O=A
                )
            )
        )
    ),
    PY,
    MAP(UO,
    LAMBDA(A,
    TAKE((FILTER(
        P&Y,
        O=A
    )),
    1))),
    UPY,
    UNIQUE(
        PY
    ),
    UC,
    MAP(
        UPY,
        LAMBDA(
            A,
            SUM(
                FILTER(
                    QS,
                    PY=A
                )
            )
        )
    ),
    TUY,
    TRANSPOSE(
        UNIQUE(
            Y
        )
    ),
    USP,
    UNIQUE(
        SORT(
            P
        )
    ),
    X,
    XLOOKUP(
        USP&TUY,
        UPY,
        UC,
        0
    ),
    VSTACK(
        HSTACK(
            "Product",
            TUY
        ),
        HSTACK(
            USP,
            IF(
                X=0,
                "",
                X
            )
        )
    ))
Excel solution 7 for Warehouse Management!, proposed by Kris Jaganah:
=PIVOTBY(
    D3:D19,
    YEAR(
        B3:B19
    ),
    SUMIFS(
        E3:E19,
        C3:C19,
        C3:C19
    ),
    SUM,
    ,
    0,
    ,
    0,
    ,
    E3:E19>0
)
Excel solution 8 for Warehouse Management!, proposed by Kris Jaganah:
=LET(
    a,
    YEAR(
        B3:B19
    ),
    b,
    C3:C19,
    c,
    D3:D19,
    d,
    E3:E19,
    f,
    PIVOTBY(
        HSTACK(
            b,
            c
        ),
        a,
        d,
        SUM
    ),
    PIVOTBY(
        c,
        a,
        XLOOKUP(
            b,
            TAKE(
                f,
                ,
                1
            ),
            TAKE(
                f,
                ,
                -1
            )
        ),
        SUM,
        ,
        0,
        ,
        0,
        ,
        d>0
    )
)
Excel solution 9 for Warehouse Management!, proposed by John Jairo Vergara Domínguez:
=LET(o,
    C3:C19,
    q,
    E3:E19,
    s,
    SUMIF(
        o,
        o,
        q
    ),
    PIVOTBY(D3:D19,
    YEAR(
        B3:B19
    ),
    s,
    SUM,
    ,
    0,
    ,
    0,
    ,
    (q>0)*s))
Excel solution 10 for Warehouse Management!, proposed by Sunny Baggu:
=LET(
 p,
     SORT(
         UNIQUE(
             D3:D19
         )
     ), y,
     TOROW(
         UNIQUE(
             YEAR(
                 B3:B19
             )
         )
     ), v,
     DROP(
 REDUCE(
 "", y, LAMBDA(g,
     h, HSTACK(
 g, DROP(
 REDUCE( "",
       p,
     LAMBDA(x,
     y,VSTACK( x,
     LET(  _f,
     FILTER(
         B3:E19,
          D3:D19 = y
     ), _up,
     UNIQUE(
         INDEX(
             _f,
              ,
              2
         )
     ), _a,
     DROP(
 REDUCE( "",
      _up,
                                                   LAMBDA(a,
     v,
     VSTACK( a,
                                                            SUM(FILTER(TAKE(
        _f,
         ,
         -1
    ),
     (YEAR(
         TAKE(
             _f,
              ,
              1
         )
     ) = h) * (INDEX(
             _f,
              ,
              2
         ) = v),
     0)) -  ABS(SUM(FILTER(TAKE(
        _f,
         ,
         -1
    ),
     (YEAR(
         TAKE(
             _f,
              ,
              1
         )
     ) <> h) * (INDEX(
             _f,
              ,
              2
         ) = v),
     0)))
 )    )   ),
      1 ), SUM(
     FILTER(
         _a,
          _a >= 0,
          0
     )
 )
 )     )       )       ),
          1        )        )        )      ),
      ,
        1    ), VSTACK(
     HSTACK(
         D2,
          y
     ),
      HSTACK(
          p,
           v
      )
 )
)
Solving the challenge of Warehouse Management! with Python
Python solution 1 for Warehouse Management!, proposed by Konrad Gryczan, PhD:
import pandas as pd
import numpy as np

input = pd.read_excel("CH-055 Warehouse Management.xlsx", usecols="B:E", skiprows=1)
test = pd.read_excel("CH-055 Warehouse Management.xlsx", usecols="H:K", skiprows=1, nrows= 3)

result = input.copy()
result["Year"] = result["Date"].dt.year
result = result.groupby(["Order No", "Product"]).agg({"Year": "min","Quantity": "sum"}).reset_index()
result.drop(columns=["Order No"], inplace=True)
result = result.pivot_table(index="Product", columns="Year", values="Quantity", aggfunc="sum", fill_value=0).reset_index()

test.columns = result.columns
result.iloc[:, 1:] = result.iloc[:, 1:].astype(float)
result.iloc[:, 1:] = result.iloc[:, 1:].replace(0, np.NaN)

print(result.equals(test))  # True
Python solution 2 for Warehouse Management!, proposed by Luan Rodrigues:
import pandas as pd

file = r"CH-055 Warehouse Management.xlsx"

df = pd.read_excel(file,usecols="B:E", skiprows=1)
df_group = df.groupby(['Product','Order No']).agg(
 Date = ('Date', lambda x: x.dt.year.iloc[0]),
 Quantity = ('Quantity','sum')
 ).reset_index()
df_pivoted = df_group.pivot_table(index='Product', columns='Date', values='Quantity', aggfunc=sum)

print(df_pivoted)
Solving the challenge of Warehouse Management! with R
R solution 1 for Warehouse Management!, proposed by Konrad Gryczan, PhD:
library(tidyverse)
library(readxl)

input = read_excel("files/CH-055 Warehouse Management.xlsx", range = "B2:E19")
test = read_excel("files/CH-055 Warehouse Management.xlsx", range = "H2:K5")

result = input %>%
 mutate(Year = year(Date)) %>%
 summarise(Year = min(Year),
 Quantity = sum(Quantity),
 .by = c("Order No", "Product")) %>%
 select(-`Order No`) %>%
 pivot_wider(names_from = Year, values_from = Quantity, values_fn = sum) %>%
 mutate(across(everything(), ~ifelse(. == 0, NA, .))) %>%
 arrange(Product)

identical(result, test)
# [1] TRUE