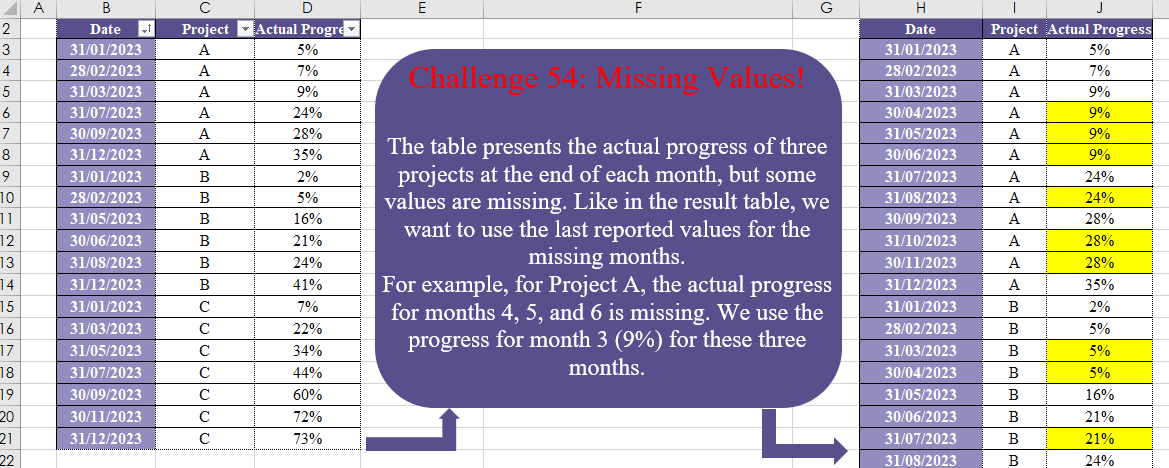
Challenge No. 54: The table presents the actual progress of three projects at the end of each month, but some values are missing.
Solved using:Excel (DATE, DROP, EOMONTH), Power Query (List.Transform, Table.Group, Table.TransformColumnTypes), Python, and R.
DROP
Removes a specified number of rows or columns from an array in Excel.
Custom Grouping! Part 2
Challenge No. 46: The “Question” table provides a list of Product IDs.
Solved using:Excel (CHOOSECOLS, DROP, FILTER), Power Query (Table.Group, List.Transform, Text.End), Python, and R.
Combine Tables
Challenge No. 44: The question tables display product sales across various regions for the different months of spring.
Solved using:Excel (DROP, FILTER, HSTACK), Power Query (List.Distinct, Table.Column, Table.ColumnNames), Python, and R.
Revisit After Surgery!
Challenge No. 42: In the question table, a list of patients is provided who are scheduled to visit the doctor for consultations and surgery.
Solved using:Excel (CHOOSECOLS, DROP, FILTER), Power Query (Text.Combine, Table.Group, Table.SelectRows), Python, and R.
Duration Since Last Visit!
Challenge No. 38: In the question table, the visiting dates for all 4 agents are provided.
Solved using:Excel (AVERAGE, DROP, EOMONTH), Power Query (List.Transform, Table.AddColumn, Table.Group), Python, and R.
P & Down Grades!
Challenge No. 35: In our company, we utilize a grading system to evaluate the technical performance of our agents, assigning grades of C, B, A, and A+.
Solved using:Excel (DROP, FILTER, HSTACK), Power Query (Table.AddColumn, Table.Group), and R.
Customer Return Cycle!
Challenge No. 34: In the question table, sales data for different customers are provided.
Solved using:Excel (DROP, FILTER, HSTACK), Power Query (Table.Group), Python, and R.
Table Transformation! Part 4
Challenge No. 32: In the question table, monthly sales and the percentage of total annual sales are provided.
Solved using:Excel (CHOOSECOLS, CHOOSEROWS, DROP), Power Query (Table.Column, Table.ColumnNames, Table.Sort), Python, and R.
Risk Analysis
Challenge No. 30: In risk analysis, activities are categorized into various groups according to their likelihood of occurrence and their impact.
Solved using:Excel, Power Query, Python, and R.
Cluster Values!
Challenge No. 28: In the question table, the ID of rows from the main table (not shown in this example) that are nearly identical are provided in the same cell.
Solved using:Excel (DROP, FILTER, HSTACK), Power Query (List.Transform), Python, and R.
