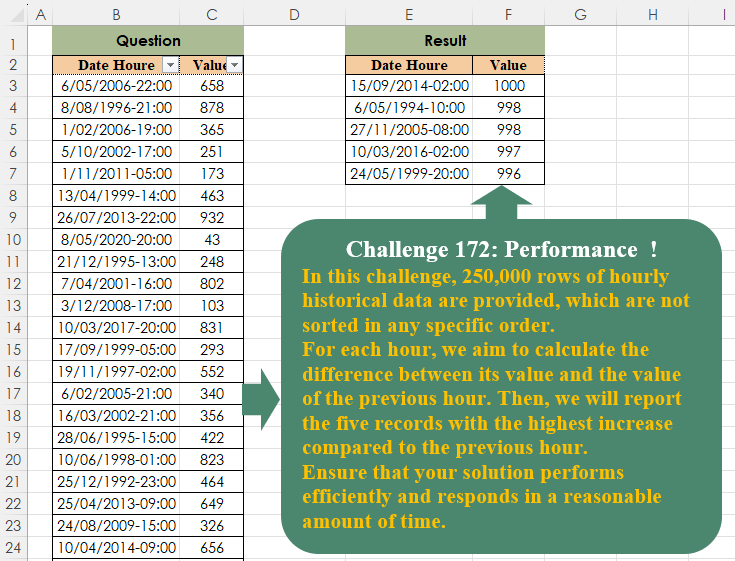
Challenge No. 172: In this challenge, 250,000 rows of hourly historical data are provided, which are not sorted in any specific order.
Solved using:Excel (DROP, LET, SORT), Google Sheets, Power Query (Table.AddColumn, Table.Sort), Python, Python in Excel, and R.
Aggregation & Summarization
Summarizing data using various methods.
Lookup and Sum
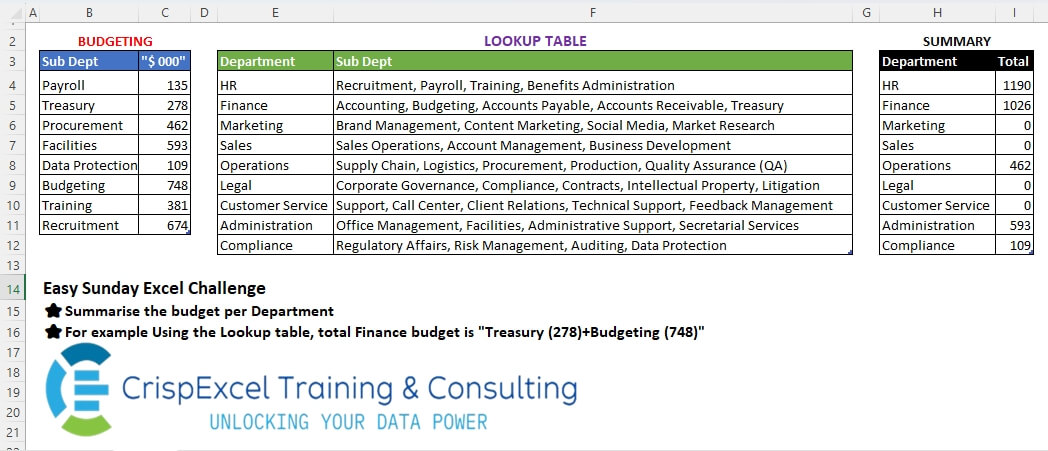
Challenge No. 44: Summarise the budget per Department
For example, Using the Lookup table, the total Finance budget is
“Treasury (278)+Budgeting (748)”.
Solved using: Python.
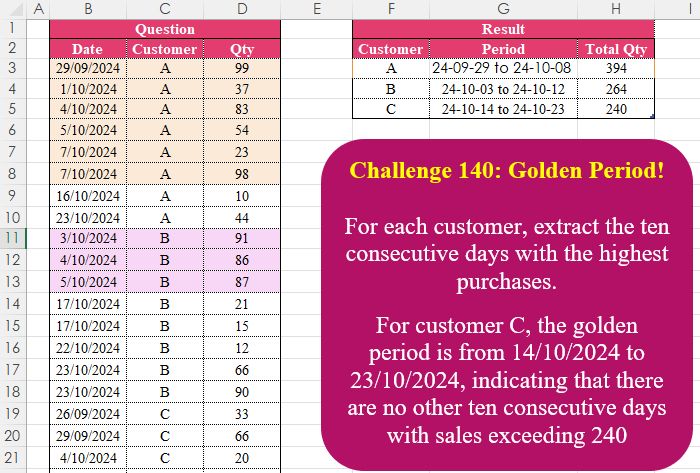
Golden Period!
Challenge No. 140: For each customer, extract the ten consecutive days with the highest purchases.
Solved using:Excel (FILTER, HSTACK, IFS), Google Sheets, Power Query (Table.AddColumn, Table.Group), Python in Excel, and R.
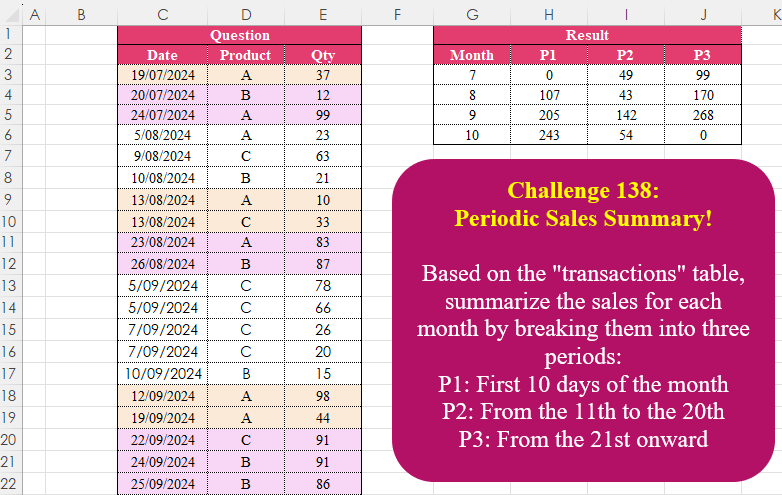
Periodic Sales Summary!
Challenge No. 138: Based on the “transactions” table, summarize the sales for each month by breaking them into three periods:
P1: First 10 days of the month
P2: From the 11th to the 20th
P3: From the 21st onward.
Solved using:Excel (DAY, DROP, HSTACK), Google Sheets, Power Query (Date.Month, List.Distinct, Table.AddColumn), Python, Python in Excel, and R.
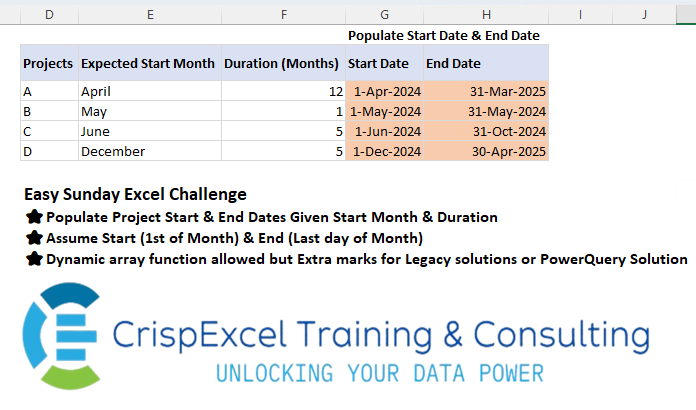
Populate Start & End Date from a month name
Challenge No. 35: Populate Project Start & End Dates Given Start Month & Duration Assume Start (1st of Month) & End (Last day of Month)
Dynamic array function allowed but Extra marks for Legacy solutions or PowerQuery Solution.
Solved using: R.
Compare Rows! Part 2
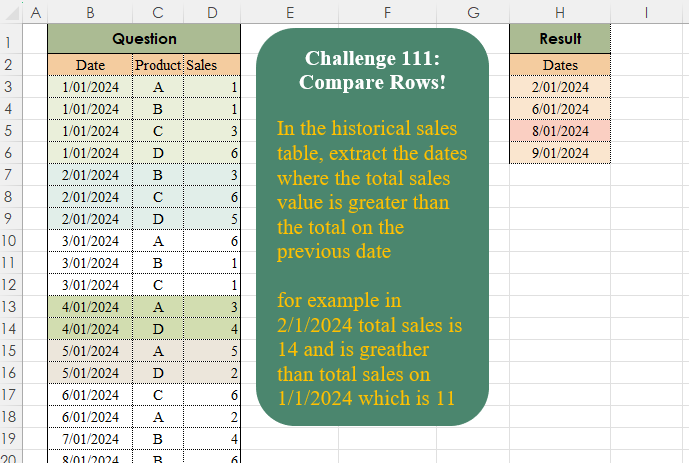
Challenge No. 111: In the historical sales table, extract the dates where the total sales value is greater than the total on the previous date
for example, in 2/1/2024 total sales were 14 and is greater than total sales on 1/1/2024 which is 11.
Solved using:Excel (DROP, FILTER, IF), Google Sheets, Power Query (Table.Group, Table.SelectRows), Python, Python in Excel, and R.
Custom Average!
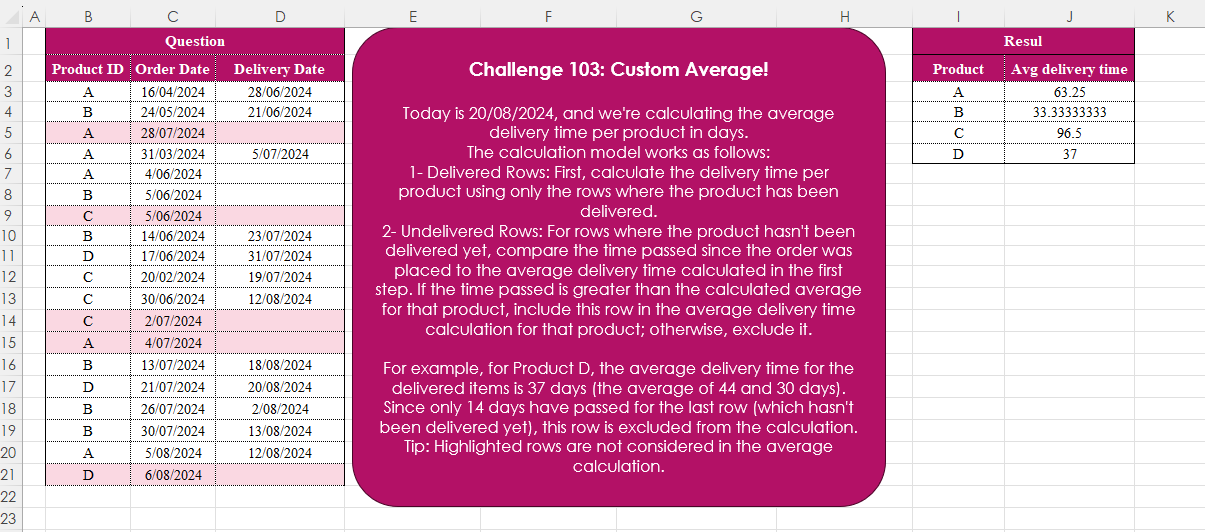
Challenge No. 103: Today is 20/08/2024, and we’re calculating the average delivery time per product in days.
Solved using:Excel (AVERAGE, CHOOSECOLS, FILTER), Google Sheets, Power Query (Table.AddColumn, Table.Group), Python, Python in Excel, and R.
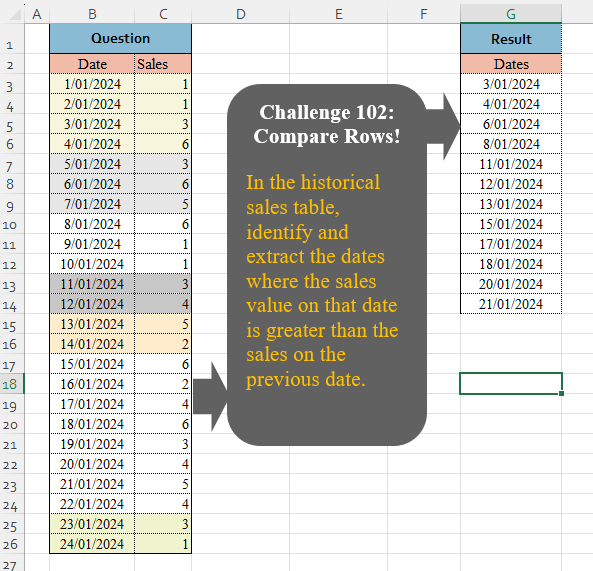
Compare Rows! Part 1
Challenge No. 102: In the historical sales table, identify and extract the dates where the sales value on that date is greater than the sales on the previous date.
Solved using:Excel (DROP, FILTER, IF), Google Sheets, Power Query (Table.AddColumn, Table.AddIndexColumn, Table.SelectColumns), Python, Python in Excel, R, and VBA.
Analyse Data Using Financial Year
Challenge No. 20: Analyse the sales data by Financial Year and Financial Quaters
Assume the Financial year starts in April
Dynamic array function allowed, but Extra marks for Legacy solutions or PowerQuery Solution.
Solved using: Python in Excel.
Sum Data Per Week Excluding Weekends
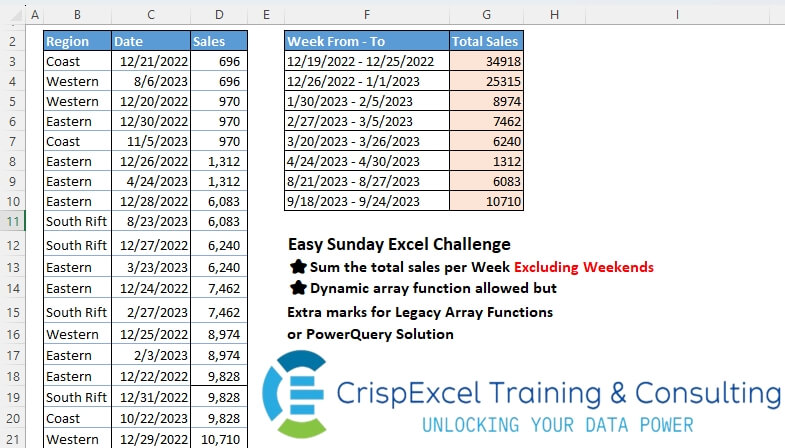
Challenge No. 17: Sum the total sales per Week Excluding Weekends
Dynamic array function allowed but
Extra marks for Legacy Array Functions or PowerQuery Solution.
Solved using: Power Query.