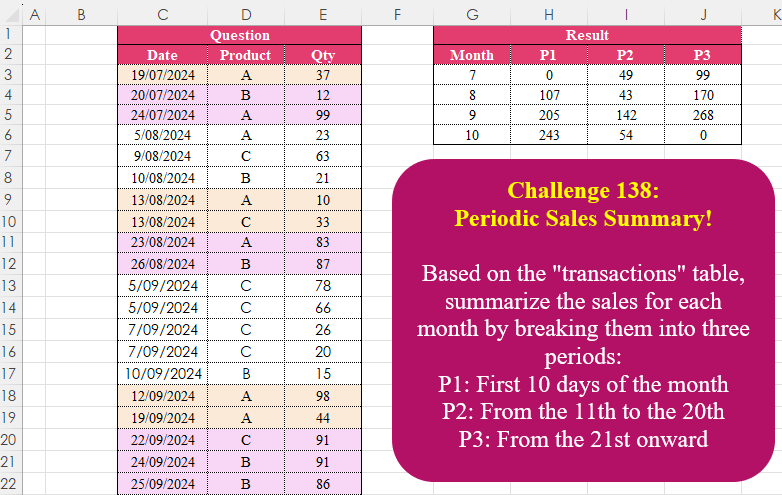
Based on the “transactions” table, summarize the sales for each month by breaking them into three periods: P1: First 10 days of the month P2: From the 11th to the 20th P3: From the 21st onward
📌 Challenge Details and Links
Challenge Number: 138
Challenge Difficulty: ⭐⭐
📥Download Sample File
📥Link to the solutions on LinkedIn
Solving the challenge of Periodic Sales Summary! with Power Query
Power Query solution 1 for Periodic Sales Summary!, proposed by Zoran Milokanović:
let
  Source = Excel.CurrentWorkbook(){[Name = "Input"]}[Content],
  R = Table.ToRows(Source),
  P = {"P1", "P2", "P3"},
  S = Table.Pivot(
    Table.FromList(
      R,
      each
        let
          d = Date.Day(_{0})
        in
          {Date.Month(_{0}), P{List.PositionOf({d < 11, d < 21, true}, true)}, _{2}},
      {"Month", "P", "V"}
    ),
    P,
    "P",
    "V",
    each List.Sum(_) ?? 0
  )
in
  S
Power Query solution 2 for Periodic Sales Summary!, proposed by Brian Julius:
let
  Source = Excel.CurrentWorkbook(){[Name = "Table1"]}[Content],
  AddMonth = Table.AddColumn(Source, "Month", each Date.Month([Date])),
  AddPer = Table.AddColumn(
    AddMonth,
    "Per",
    each [a = Date.Day([Date]), b = if a <= 10 then "P1" else if a <= 20 then "P2" else "P3"][b]
  ),
  Rem = Table.RemoveColumns(AddPer, {"Date", "Product"}),
  Piv = Table.ReorderColumns(
    Table.Pivot(Rem, List.Distinct(Rem[Per]), "Per", "Qty", List.Sum),
    {"Month", "P1", "P2", "P3"}
  ),
  RepNull = Table.ReplaceValue(Piv, null, 0, Replacer.ReplaceValue, Table.ColumnNames(Piv))
in
  RepNull
Power Query solution 3 for Periodic Sales Summary!, proposed by Luan Rodrigues:
let
  Fonte = Tabela1,
  data = Table.AddColumn(Fonte, "Month", each Date.Month([Date])),
  grp = Table.Group(
    data,
    {"Month"},
    {
      {
        "ext",
        each
          let
            lista = List.Transform(
              {{1 .. 10}, {11 .. 20}, {21 .. 31}},
              (y) => Table.FromColumns({y})
            ),
            add = List.Transform(
              {0 .. 2},
              (w) =>
                List.Sum(
                  Table.Combine(
                    Table.AddColumn(
                      lista{w},
                      "add",
                      (y) => Table.SelectRows(_, (x) => Date.Day(x[Date]) = y[Column1])
                    )[add]
                  )[Qty]
                )
            )
          in
            Table.FromRows({add}, {"P1", "P2", "P3"})
      }
    }
  ),
  res = Table.ExpandTableColumn(grp, "ext", Table.ColumnNames(grp[ext]{0}))
in
  res
Power Query solution 4 for Periodic Sales Summary!, proposed by Alejandro Simón 🇵🇦 🇪🇸:
let
Source = Excel.CurrentWorkbook(){[Name="Table1"]}[Content],
A = Table.AddColumn(Source, "A", each
 if Date.Day([Date])<=10 then "P1" else
 if Date.Day([Date])<=20 then "P2" else "P3"),
Month = Table.TransformColumns(Table.RemoveColumns(A,{"Product"}),
 {{"Date", Date.Month}}),
Sol = Table.RenameColumns(Table.Pivot(Month,
 List.Sort(List.Distinct(Month[A])), "A", "Qty", each List.Sum(_) ??0), {"Date", "Month"})
in
Sol
Power Query solution 5 for Periodic Sales Summary!, proposed by Krzysztof Kominiak:
let
  Source = Excel.CurrentWorkbook(){[Name = "Table1"]}[Content],
  InsertPeriod = Table.AddColumn(
    Source,
    "Period",
    each "P" & Text.From(List.Min({(Number.IntegerDivide(Date.Day([Date]) - 1, 10) + 1), 3}))
  ),
  InsertMonth = Table.SelectColumns(
    Table.AddColumn(InsertPeriod, "Month", each Date.Month([Date]), Int64.Type),
    {"Month", "Period", "Qty"}
  ),
  PivotCol = Table.Pivot(
    Table.TransformColumnTypes(InsertMonth, {{"Period", type text}}, "pl-PL"),
    List.Sort(
      List.Distinct(
        Table.TransformColumnTypes(InsertMonth, {{"Period", type text}}, "pl-PL")[Period]
      )
    ),
    "Period",
    "Qty",
    List.Sum
  )
in
  PivotCol
Power Query solution 6 for Periodic Sales Summary!, proposed by Abdallah Ally:
let
  Source = Excel.CurrentWorkbook(){[Name = "Table1"]}[Content],
  AddCol = Table.AddColumn(
    Table.AddColumn(Source, "Month", each Date.Month([Date])),
    "Period",
    each "P" & Text.From(Number.RoundUp(Date.Day([Date]) / 10))
  ),
  Result = Table.Pivot(
    AddCol[[Month], [Period], [Qty]],
    List.Distinct(List.Sort(AddCol[Period])),
    "Period",
    "Qty",
    each List.Sum(_) ?? 0
  )
in
  Result
Power Query solution 7 for Periodic Sales Summary!, proposed by Kris Jaganah:
let
  A = Excel.CurrentWorkbook(){[Name = "Table1"]}[Content],
  B = Table.AddColumn(
    A,
    "Period",
    each
      let
        a = Date.Day([Date])
      in
        if a < 11 then "P1" else if a < 21 then "P2" else "P3"
  ),
  C = Table.TransformColumns(B, {"Date", Date.Month}),
  D = Table.RenameColumns(C, {"Date", "Month"}),
  E = Table.RemoveColumns(D, {"Product"}),
  F = Table.Pivot(E, List.Sort(List.Distinct(E[Period])), "Period", "Qty", List.Sum)
in
  F
Power Query solution 8 for Periodic Sales Summary!, proposed by Masoud Karami:
let
  Source = Excel.CurrentWorkbook(){[Name = "Table1"]}[Content],
  A = Table.TransformColumnTypes(Source, {{"Date", type text}}),
  B = Table.SplitColumn(
    A,
    "Date",
    Splitter.SplitTextByDelimiter(" ", QuoteStyle.Csv),
    {"Date.1", "Date.2"}
  ),
  C = Table.SplitColumn(
    B,
    "Date.1",
    Splitter.SplitTextByDelimiter("/", QuoteStyle.Csv),
    {"Date.1.1", "Date.1.2", "Date.1.3"}
  ),
  D = Table.TransformColumnTypes(
    C,
    {{"Date.1.1", Int64.Type}, {"Date.1.2", Int64.Type}, {"Date.1.3", Int64.Type}}
  ),
  H = Table.AddColumn(
    D,
    "Subtraction",
    each if [Date.1.1] <= 10 then "P1" else if [Date.1.1] <= 20 then "P2" else "p3"
  ),
  M = Table.Group(H, {"Subtraction", "Date.1.2"}, {{"Count", each List.Sum([Qty]), type number}}),
  S = Table.Sort(M, {{"Subtraction", Order.Ascending}}),
  N = Table.Pivot(S, List.Distinct(S[Subtraction]), "Subtraction", "Count")
in
  N
Power Query solution 9 for Periodic Sales Summary!, proposed by 🇮🇷 Navid Esmaeilzadeh اسماعیل زاده:
let
  Source = Excel.CurrentWorkbook(){[Name = "Table1"]}[Content],
  A = Table.TransformColumnTypes(
    Source,
    {{"Date", type date}, {"Product", type text}, {"Qty", Int64.Type}}
  ),
  B = Table.AddColumn(
    A,
    "P",
    each if Date.Day([Date]) >= 21 then "P3" else if Date.Day([Date]) >= 11 then "P2" else "P1"
  ),
  C = Table.TransformColumns(B, {{"Date", Date.Month, Int64.Type}}),
  D = Table.RemoveColumns(C, {"Product"}),
  E = Table.Pivot(D, List.Sort(List.Distinct(D[P])), "P", "Qty", List.Sum)
in
  E
Solving the challenge of Periodic Sales Summary! with Excel
Excel solution 1 for Periodic Sales Summary!, proposed by Bo Rydobon 🇹🇭:
=LET(
    d,
    C3:C27,
    PIVOTBY(
        MONTH(
            d
        ),
        "P"&MATCH(
            DAY(
            d
        ),
            {1,
            11,
            21}
        ),
        E3:E27,
        SUM,
        ,
        0,
        ,
        0
    )
)
Excel solution 2 for Periodic Sales Summary!, proposed by 🇰🇷 Taeyong Shin:
=LET(
    p,
    PIVOTBY(
        MONTH(
            C2:C27
        ),
        "P"&MATCH(
            DAY(
            C2:C27
        ),
            {1,
            11,
            21}
        ),
        E2:E27,
        SUM,
        ,
        0,
        ,
        0
    ),
    IFS(
        SEQUENCE(
            ROWS(
                p
            ),
            COLUMNS(
                p
            )
        )=1,
        "Month",
        p="",
        0,
        1,
        p
    )
)
Excel solution 3 for Periodic Sales Summary!, proposed by Oscar Mendez Roca Farell:
=PIVOTBY(MONTH(
    C3:C27
),
     "P"&(INT((DAY(
    C3:C27
)-1)/10)+1),
     E3:E27,
     SUM,
     ,
    0,
     ,
    0)
Excel solution 4 for Periodic Sales Summary!, proposed by Julian Poeltl:
=LET(D,
    C3:C27,
    Q,
    E3:E27,
    M,
    MONTH(
        D
    ),
    DY,
    DAY(
        D
    ),
    U,
    UNIQUE(
        M
    ),
    HSTACK(VSTACK(
        "Month",
        U
    ),
    REDUCE("P"&SEQUENCE(
        ,
        3
    ),
    U,
    LAMBDA(C,
    U,
    VSTACK(C,
    MAP(SEQUENCE(
        ,
        3,
        0,
        10
    ),
    LAMBDA(A,
    SUM(IFERROR(FILTER(Q,
    (M=U)*(DY>A)*(DY
Excel solution 5 for Periodic Sales Summary!, proposed by Julian Poeltl:
=LET(D,
    C3:C27,
    Q,
    E3:E27,
    M,
    MONTH(
        D
    ),
    DY,
    DAY(
        D
    ),
    U,
    UNIQUE(
        M
    ),
    HSTACK(VSTACK(
        "Month",
        U
    ),
    REDUCE("P"&SEQUENCE(
        ,
        3
    ),
    U,
    LAMBDA(A,
    B,
    VSTACK(A,
    MAP(SEQUENCE(
        ,
        3,
        0,
        10
    ),
    LAMBDA(C,
    SUM(FILTER(Q,
    (M=B)*(DY>C)*(DY<(C+11)),
    0)))))))))
Excel solution 6 for Periodic Sales Summary!, proposed by Kris Jaganah:
=LET(
    a,
    C3:C27,
    b,
    D3:D27,
    c,
    E3:E27,
    d,
    DAY(
        a
    ),
    PIVOTBY(
        MONTH(
        a
    ),
        IFS(
            d<11,
            "P1",
            d<21,
            "P2",
            1,
            "P3"
        ),
        c,
        SUM,
        ,
        0,
        ,
        0
    )
)
Excel solution 7 for Periodic Sales Summary!, proposed by Imam Hambali:
=LET(    d,
     C3:C27,    q,
     E3:E27,    p,
     XLOOKUP(
         DAY(
             d
         ),
         {1;11;21},
         {"P1";"P2";"P3"},
         ,
         -1
     ),    pvt,
     DROP(
         PIVOTBY(
             MONTH(
             d
         ),
             p,
             q,
             SUM,
             0,
             0,
             ,
             0
         ),
         1
     ),    VSTACK(
        {"Month",
        "P1",
        "P2",
        "P3"},
         IF(
             pvt="",
             0,
             pvt
         )
    ))
Excel solution 8 for Periodic Sales Summary!, proposed by Ivan William:
=PIVOTBY(
    MONTH(
        C3:C27
    ),
    "P"&LOOKUP(
        DAY(
        C3:C27
    ),
        {0,
        11,
        21},
        {1,
        2,
        3}
    ),
    E3:E27,
    SUM,
    ,
    0,
    ,
    0
)
Excel solution 9 for Periodic Sales Summary!, proposed by Sunny Baggu:
=LET(
 _m,
     UNIQUE(
         MONTH(
             C3:C27
         )
     ), REDUCE(
 {"Month",
     "P1",
     "P2",
     "P3"}, _m, LAMBDA(x,
     y, VSTACK(
 x, LET(
 _a,
     CHOOSECOLS(
         FILTER(
             C3:E27,
              MONTH(
             C3:C27
         ) = y
         ),
          1,
          3
     ), HSTACK(
 y, MAP(
 {1,
     2,
     3}, LAMBDA(a, SUM(
 (CEILING.MATH(
     DAY(
         TAKE(
             _a,
              ,
              1
         )
     ),
      10
 ) / 10 = a) *
 TAKE(
     _a,
      ,
      -1
 )
 )
 )
 )
 )
 )
 )
 )
 )
)
Excel solution 10 for Periodic Sales Summary!, proposed by Ahmed Ariem:
=PIVOTBY(
    MONTH(
        C3:C27
    ),
    "P "&ROUNDUP(
        DAY(
        C3:C27
    )/10,
        0
    ),
    E3:E27,
    SUM,
    0,
    0,
    ,
    0
)
Excel solution 11 for Periodic Sales Summary!, proposed by Asheesh Pahwa:
=LET(dt,
    C3:C27,
    qty,
    E3:E27,
    m,
    MONTH(
        dt
    ),
    DROP(REDUCE("",
    UNIQUE(
        m
    ),
    LAMBDA(x,
    y,
    VSTACK(x,
    LET(f,
    FILTER(
        HSTACK(
            dt,
            qty
        ),
        m=y
    ),
    t,
    TAKE(
        f,
        ,
        -1
    ),
    d,
    DAY(
        TAKE(
            f,
            ,
            1
        )
    ),
    HSTACK(y,
    SUM((d<11)*t),
    SUM((d>10)*(d<21)*t),
    SUM((d>20)*t)))))),
    1))
Excel solution 12 for Periodic Sales Summary!, proposed by ferhat CK:
=PIVOTBY(
    MONTH(
        C3:C27
    ),
    MAP(
        DAY(
        C3:C27
    ),
        LAMBDA(
            x,
            XLOOKUP(
                x,
                {1,
                11,
                21},
                {"P1",
                "P2",
                "P3"},
                ,
                -1
            )
        )
    ),
    E3:E27,
    SUM,
    ,
    0,
    ,
    0
)
Excel solution 13 for Periodic Sales Summary!, proposed by Hamidi Hamid:
=LET(
    m,
    MONTH(
        C3:C27
    ),
    j,
    DAY(
        C3:C27
    ),
    q,
    E3:E27,
    p,
    IF(
        j<=10,
        "p1",
        IF(
            j<=20,
            "p2",
            "p3"
        )
    ),
    PIVOTBY(
        m,
        p,
        q,
        SUM,
        ,
        0,
        ,
        0
    )
)
Excel solution 14 for Periodic Sales Summary!, proposed by Hussein SATOUR:
=LET(
    d,
    C3:C27,
    p,
    PIVOTBY(
        MONTH(
            d
        ),
        ROUNDUP(
            DAY(
            d
        )/10,
            0
        ),
        E3:E27,
        SUM,
        ,
        0,
        ,
        0
    ),
    t,
    TAKE(
        p,
        1
    ),
    VSTACK(
        IF(
            t="",
            "Month",
            "P"&t
        ),
        DROP(
        p,
        1
    )
    )
)
Excel solution 15 for Periodic Sales Summary!, proposed by Julien Lacaze:
=PIVOTBY(
    MONTH(
        C3:C27
    ),
    "P""IENT(
        DAY(
        C3:C27
    ),
        11
    )+1,
    E3:E27,
    SUM,
    ,
    0,
    ,
    0
)
Excel solution 16 for Periodic Sales Summary!, proposed by Md. Zohurul Islam:
=LET(    a,
    C3:C27,    b,
    E3:E27,    p,
    MONTH(
        a
    ),    q,
    "P"&CEILING(
        DAY(
        a
    )/10,
        1
    ),    months,
    UNIQUE(
        p
    ),    period,
    TRANSPOSE(
        UNIQUE(
            SORT(
                q
            )
        )
    ),    lokupVal,
    TOCOL(
        months&period
    ),    myVal,
    MAP(
        lokupVal,
        LAMBDA(
            x,
            IFERROR(
                SUM(
                    FILTER(
                        b,
                        p&q=x
                    )
                ),
                0
            )
        )
    ),    res,
    WRAPROWS(
        myVal,
        COUNTA(
            period
        )
    ),    result,
    VSTACK(
        period,
        res
    ),    rowhdr,
    VSTACK(
        "Month",
        months
    ),    Report,
    HSTACK(
        rowhdr,
        result
    ),    Report
)
Excel solution 17 for Periodic Sales Summary!, proposed by Md. Zohurul Islam:
=LET(    a,
    C3:C27,    b,
    E3:E27,    p,
    MONTH(
        a
    ),    q,
    "P"&CEILING(
        DAY(
        a
    )/10,
        1
    ),    r,
    PIVOTBY(
        p,
        q,
        b,
        SUM,
        0,
        0,
        ,
        0
    ),    s,
    VSTACK(
        "Month",
        DROP(
            TAKE(
                r,
                ,
                1
            ),
            1
        )
    ),    tt,
    DROP(
                r,
                ,
                1
            ),    u,
    IF(
        tt="",
        0,
        tt
    ),    result,
    HSTACK(
        s,
        u
    ),    result
)
Excel solution 18 for Periodic Sales Summary!, proposed by Nicolas Micot:
=MAP(G3:G6&";"&H2:J2;
    LAMBDA(l_month_period;
    LET(_split;
    FRACTIONNER.TEXTE(
        l_month_period;
        ;
        ";"
    );
    _month;
    INDEX(
        _split;
        1
    )+0;
    _period;
    INDEX(
        _split;
        2
    );
    SOMME(E3:E27*(MOIS(
        C3:C27
    )=_month)*("P" & EQUIV(
        JOUR(
        C3:C27
    );
        {1;
        11;
        21};
        1
    ) = _period)))))
Excel solution 19 for Periodic Sales Summary!, proposed by Oscar Javier Rosero Jiménez:
=VSTACK(
    {"Month",
    "P1",
    "P2",
    "P3"},
    IFERROR(
        DROP(
            PIVOTBY(
                MONTH(
                    C3:C27
                ),
                IF(
                    DAY(
                    C3:C27
                )<=10,
                    1,
                    IF(
                        DAY(
                    C3:C27
                )<=20,
                        2,
                        3
                    )
                ),
                E3:E27,
                SUM,
                0,
                0,
                ,
                0,
                ,
                ,

            )+0,
            1
        ),
        0
    )
)
Excel solution 20 for Periodic Sales Summary!, proposed by Rahim Zulfiqar Ali:
=PIVOTBY(
    MONTH(
        Data[Date]
    ),    "P"&MATCH(
        DAY(
        Data[Date]
    ),
        {1,
        11,
        21}
    ),    Data[Qty],
    SUM,
    ,
    0,
    ,
    0
)

Month Names with Chronological Sorting!
=PIVOTBY(--(1&TEXT(
    Data[Date],
    "MMM"
)),"P"&MATCH(
        DAY(
        Data[Date]
    ),
        {1,
        11,
        21}
    ),Data[Qty],
    SUM,
    ,
    0,
    ,
    0)
Excel solution 21 for Periodic Sales Summary!, proposed by Rick Rothstein:
=LET(c,
    C3:C27,
    u,
    UNIQUE(
        MONTH(
            c
        )
    ),
    v,
    IF(
        MONTH(
            c
        )=TOROW(
            u
        ),
        OFFSET(
            c,
            ,
            2
        ),
        0
    ),
    HSTACK(VSTACK(
        "Month",
        u
    ),
    REDUCE({"P1",
    "P2",
    "P3"},
    SEQUENCE(
        4
    ),
    LAMBDA(a,
    g,
    VSTACK(a,
    BYCOL(IF((ABS(
        DAY(
            c
        )-{6,
        16,
        27}
    )<6),
    INDEX(
        v,
        ,
        g
    ),
    0),
    SUM))))))
Excel solution 22 for Periodic Sales Summary!, proposed by Tomasz Jakóbczyk:
=UNIQUE(
    MONTH(
        C3:C27
    )
)
H3: =SUMPRODUCT((MONTH(
    $C$3:$C$27
)=$G3)*($E$3:$E$27)*(IFS(
    DAY(
    $C$3:$C$27
)<=10,
    "P1",
    DAY(
    $C$3:$C$27
)<=20,
    "P2",
    DAY(
    $C$3:$C$27
)>=21,
    "P3"
)=H$2))
Solving the challenge of Periodic Sales Summary! with Python
Python solution 1 for Periodic Sales Summary!, proposed by Konrad Gryczan, PhD:
import pandas as pd

path = "CH-138 Periodic Sales Summary.xlsx"
input = pd.read_excel(path, usecols="C:E", skiprows=1, nrows=26)
test = pd.read_excel(path, usecols="G:J", skiprows=1, nrows = 4 )

input['Month'] = input['Date'].dt.month
input['decade_days'] = 'P' + (((input['Date'].dt.day - 1) // 10 + 1).clip(upper=3)).astype(str)

result = input.pivot_table(index = "Month", columns = "decade_days", values = "Qty", aggfunc = "sum").reset_index()
result = result.fillna(0).astype("int64")
result.columns.name = None

print(test.equals(result)) # True
Solving the challenge of Periodic Sales Summary! with Python in Excel
Python in Excel solution 1 for Periodic Sales Summary!, proposed by Alejandro Campos:
df = xl("C2:E27", headers=True)

df['Date'] = pd.to_datetime(df['Date'], format='%d/%m/%Y')
df['Month'] = df['Date'].dt.month.astype(str)
df['Day'] = df['Date'].dt.day
df['Period'] = pd.cut(df['Day'], bins=[0, 10, 20, 31], labels=['P1', 'P2', 'P3'], right=True)

summary = df.groupby(['Month', 'Period'], observed=False)['Qty'].sum().unstack(fill_value=0).reset_index()
summary['Month'] = summary['Month'].astype(int)
summary = summary.sort_values(by='Month').reset_index(drop=True)
summary.columns.name = None
summary
Solving the challenge of Periodic Sales Summary! with R
R solution 1 for Periodic Sales Summary!, proposed by Konrad Gryczan, PhD:
library(tidyverse)
library(readxl)

path = "files/CH-138 Periodic Sales Summary.xlsx"
input = read_excel(path, range = "C2:E27")
test = read_excel(path, range = "G2:J6")

result = input %>%
 mutate(Month = month(Date),
 day = day(Date),
 decade_days = paste0("P",ifelse(ceiling(day / 10) == 4, 3, ceiling(day/10)))) %>%
 summarise(`Total Qty` = sum(Qty, na.rm = TRUE), .by = c(decade_days, Month)) %>%
 pivot_wider(names_from = decade_days, values_from = `Total Qty`, values_fill = 0) %>%
 select(Month, P1, P2, P3)

all.equal(result, test, check.attributes = FALSE)
#> [1] TRUE
Solving the challenge of Periodic Sales Summary! with Google Sheets
Google Sheets solution 1 for Periodic Sales Summary!, proposed by Peter Krkos:
PowerQuery solution
https://docs.google.com/spreadsheets/d/1zR5IZLz8OT76vhaPEHfsPrw8-RDKnLyyqS49IJjdhFk/edit?pli=1&gid=348354255#gid=348354255