Challenge No. 158: From the question table, extract the last transaction per product for each month.
Solved using:Excel (DROP, FILTER, GROUPBY), Google Sheets, Power Query (Date.Month, Table.AddColumn, Table.Combine), Python, Python in Excel, and R.
TAKE
Returns a specified number of rows or columns from an array in Excel.
Table Transformation! Part 18
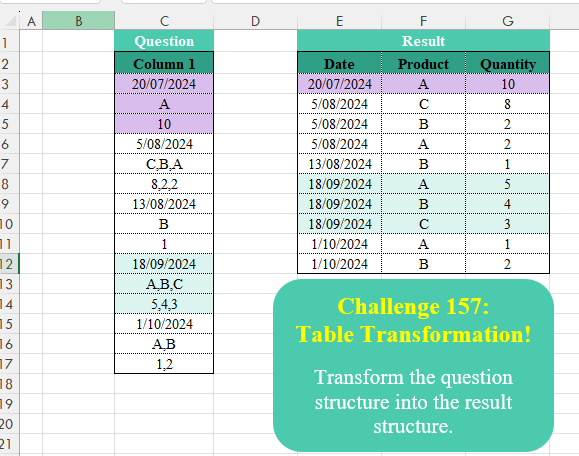
Challenge No. 157: Transform the question structure into the result structure.
Solved using:Excel (HSTACK, INDEX, LAMBDA), Google Sheets, Power Query (List.Split, List.Transform, Text.Split), Python, Python in Excel, and R.
Custom Grouping! Part 10
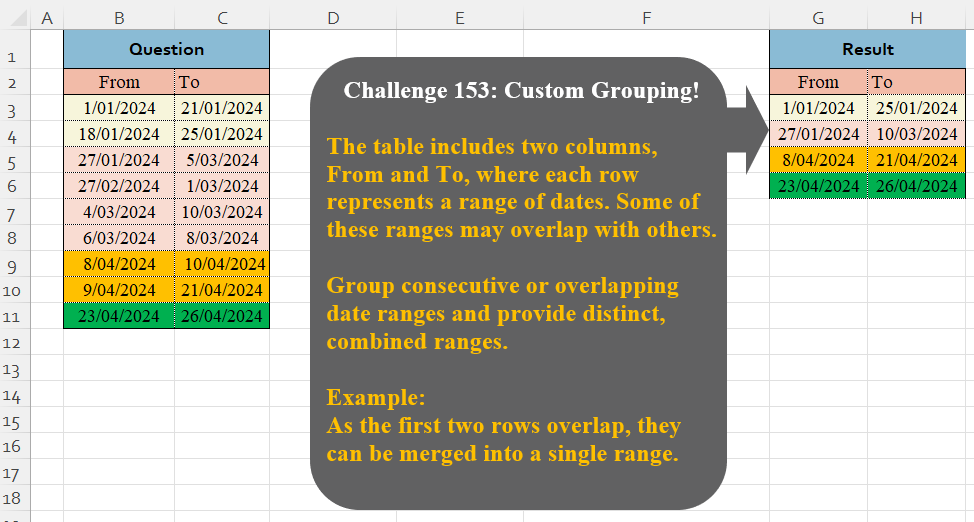
Challenge No. 153: The table includes two columns, From and To, where each row represents a range of dates.
Solved using:Excel (DROP, HSTACK, IF), Google Sheets, Power Query (Table.Group), Python, Python in Excel, and R.
First Date Of Months!
Challenge No. 144: From the provided “transactions” table, filter the first transaction for each.
Solved using:Excel (DROP, FILTER, LAMBDA), Google Sheets, Power Query (Date.Month, Table.AddColumn, Table.Group), Python, Python in Excel, and R.
Sort Rows by Key Count
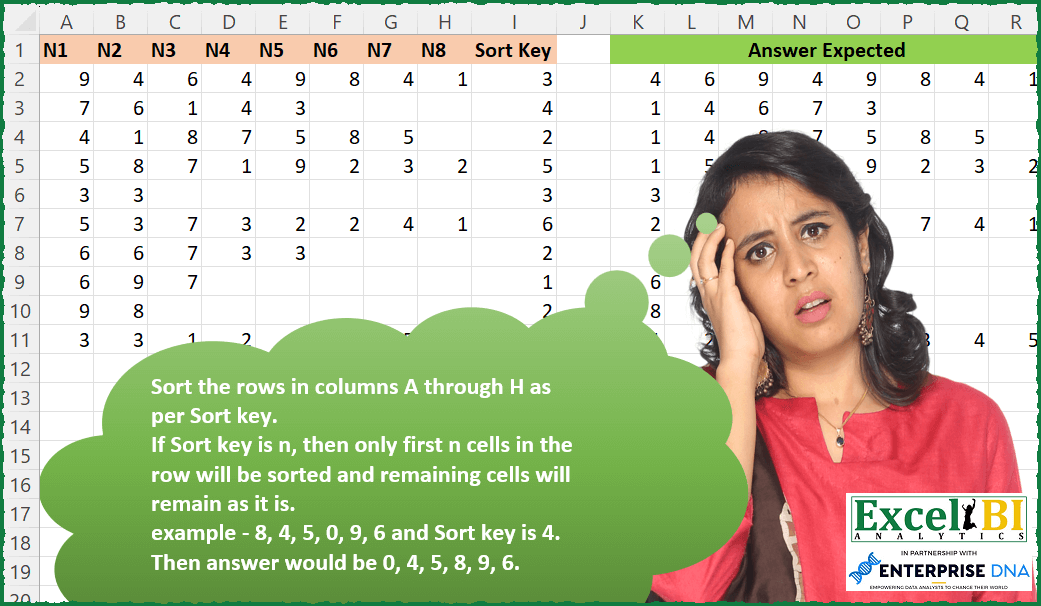
Challenge No. 223: Sort the rows in columns A through H as per Sort key.
Solved using: Power Query.
Top Headers by Total
Challenge No. 220: First row is column headers and first column is row headers.
Solved using: Power Query (List.Transform).
Golden Period!
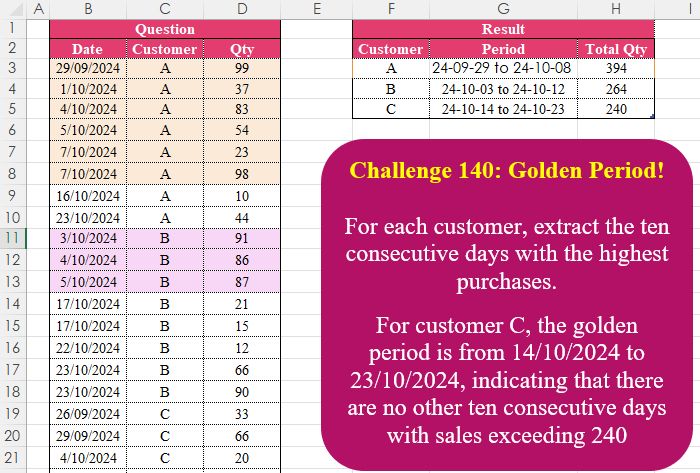
Challenge No. 140: For each customer, extract the ten consecutive days with the highest purchases.
Solved using:Excel (FILTER, HSTACK, IFS), Google Sheets, Power Query (Table.AddColumn, Table.Group), Python in Excel, and R.
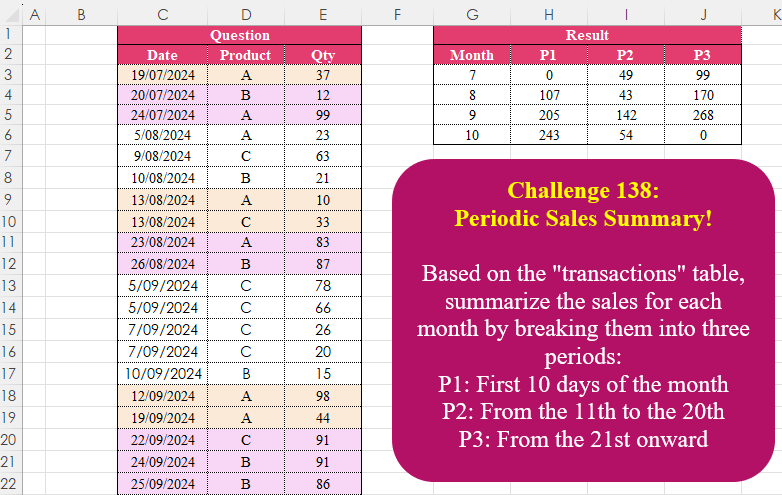
Periodic Sales Summary!
Challenge No. 138: Based on the “transactions” table, summarize the sales for each month by breaking them into three periods:
P1: First 10 days of the month
P2: From the 11th to the 20th
P3: From the 21st onward.
Solved using:Excel (DAY, DROP, HSTACK), Google Sheets, Power Query (Date.Month, List.Distinct, Table.AddColumn), Python, Python in Excel, and R.
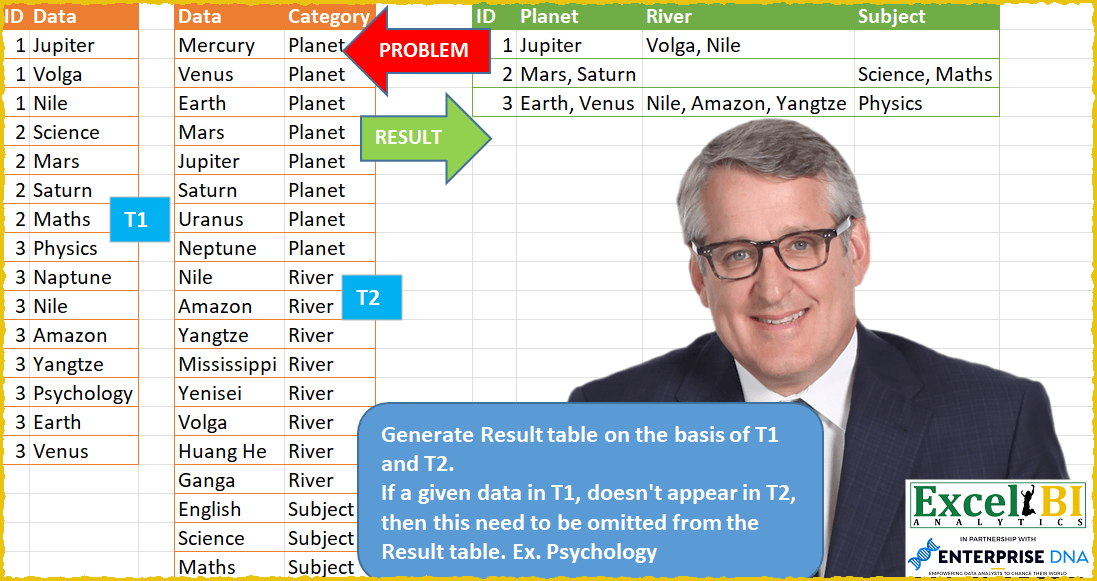
Filter Values Based on Table
Challenge No. 61: Generate Result table on the basis of T1 and T2.
Solved using: Power Query (List.Distinct, Table.Group, Table.Pivot).
Identify The Pattern !
Challenge No. 135: Find the number of occurrences of the “+-+” pattern across the test IDs for each product.
Solved using:Excel (BYROW, CONCAT, DROP), Google Sheets, Power Query (List.Range, Text.Combine, Table.AddColumn), Python, Python in Excel, and R.