
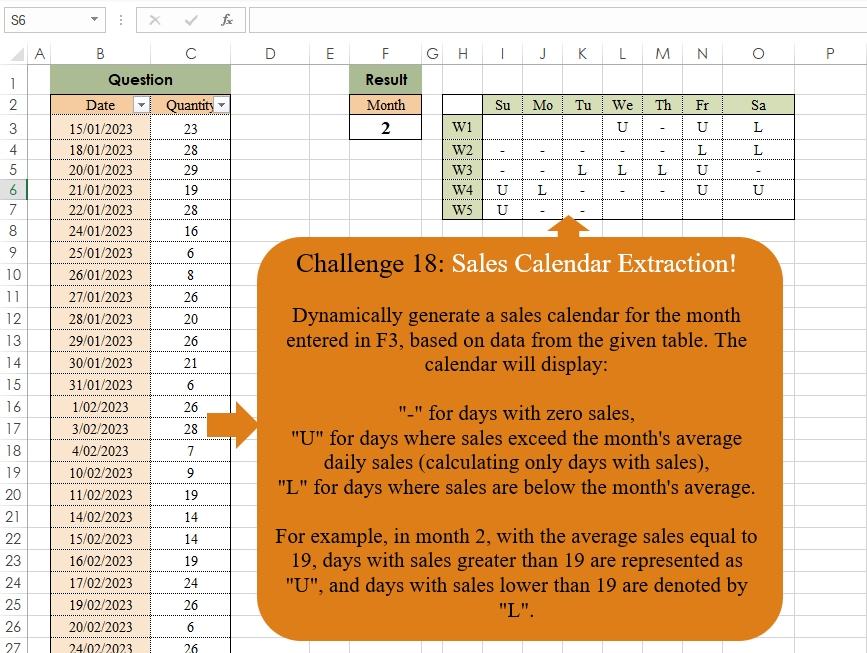
Challenge No. 18: Dynamically generate a sales calendar for the month entered in F3, based on data from the given table.
Solved using:Excel, Power Query, and R.
Stacks arrays horizontally into a single row in Excel.
Challenge No. 18: Dynamically generate a sales calendar for the month entered in F3, based on data from the given table.
Solved using:Excel, Power Query, and R.
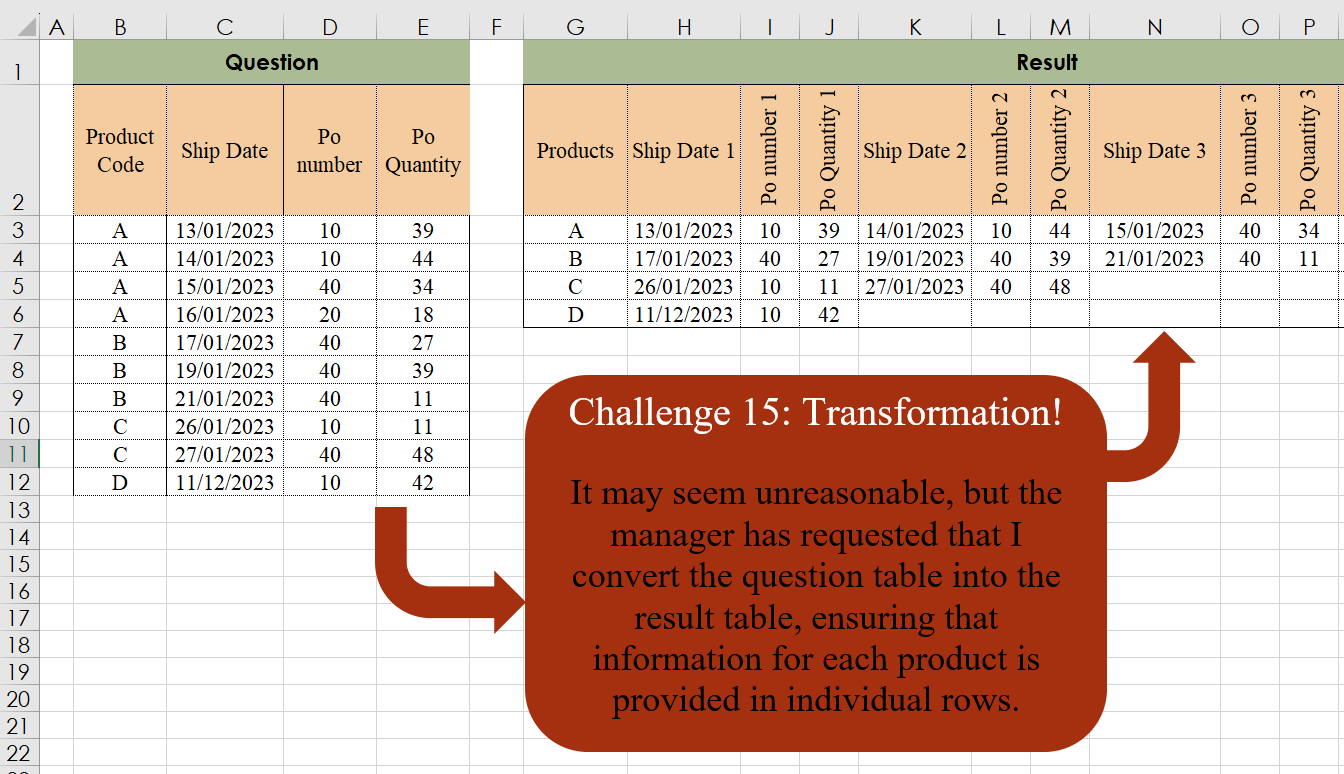
Challenge No. 15: It may seem unreasonable, but the manager has requested that I convert the question table into the result table, ensuring that information for each product is provided in individual rows.
Solved using:Excel, Power Query, and R.
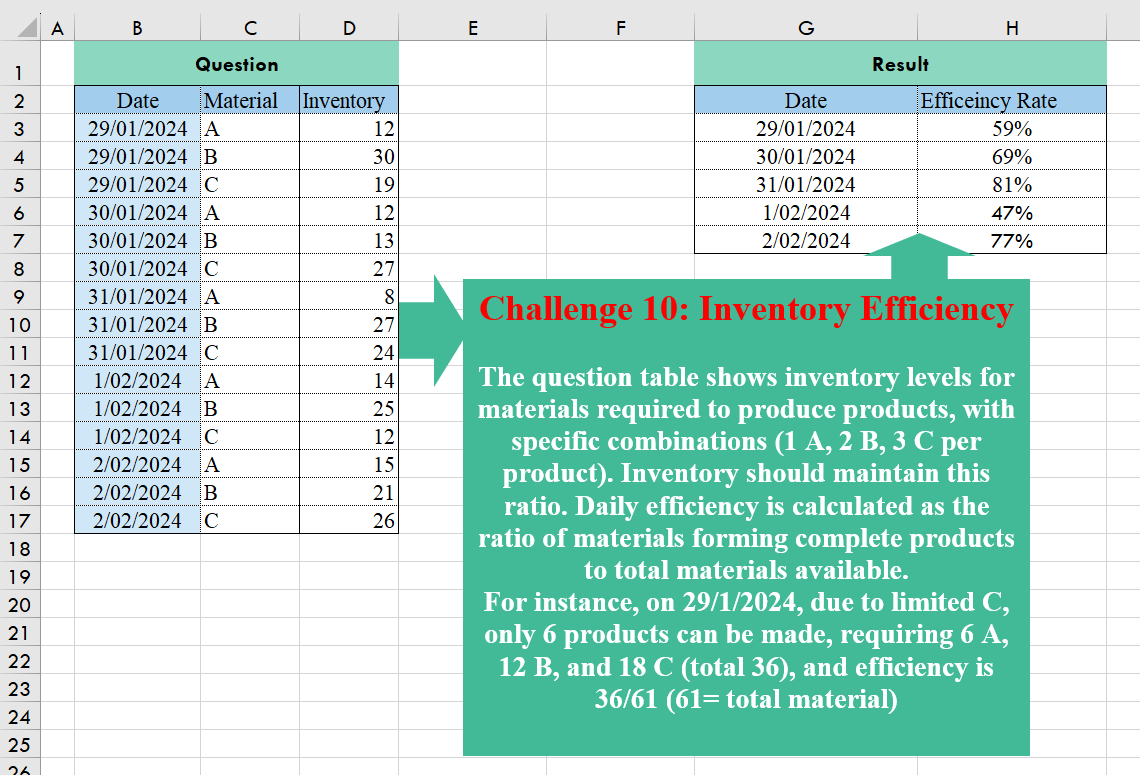
Challenge No. 10: The question table shows inventory levels for materials required to produce products, with specific combinations (1 A, 2 B, 3 C per product).
Solved using:Excel (HSTACK, LAMBDA, LET), Power Query (Table.AddColumn, Table.Group), and R.

Challenge No. 8: The Question’s table outlines warehouse transactions with records for Initial value (warehouse product count), Add (purchased and incoming products), and Reduce (sold and outgoing products).
Solved using:Excel, and Power Query.

Challenge No. 5: Determine how frequently products are bought together (same invoice number).
Solved using:Excel, and Power Query.
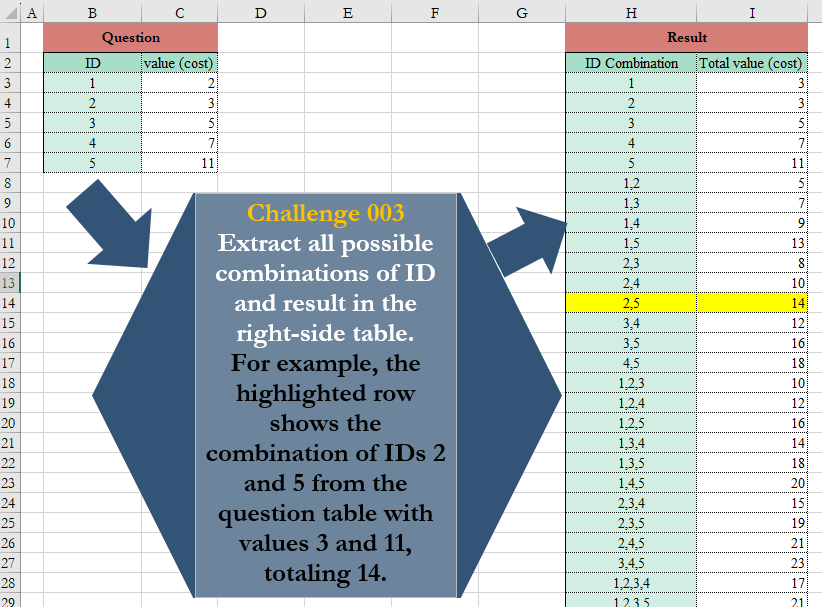
Challenge No. 3: Extract all possible combinations of ID and result in the right-side table.
Solved using:Excel (BYROW, COUNTA, DROP), Power Query (List.Transform), Python, and Python in Excel.
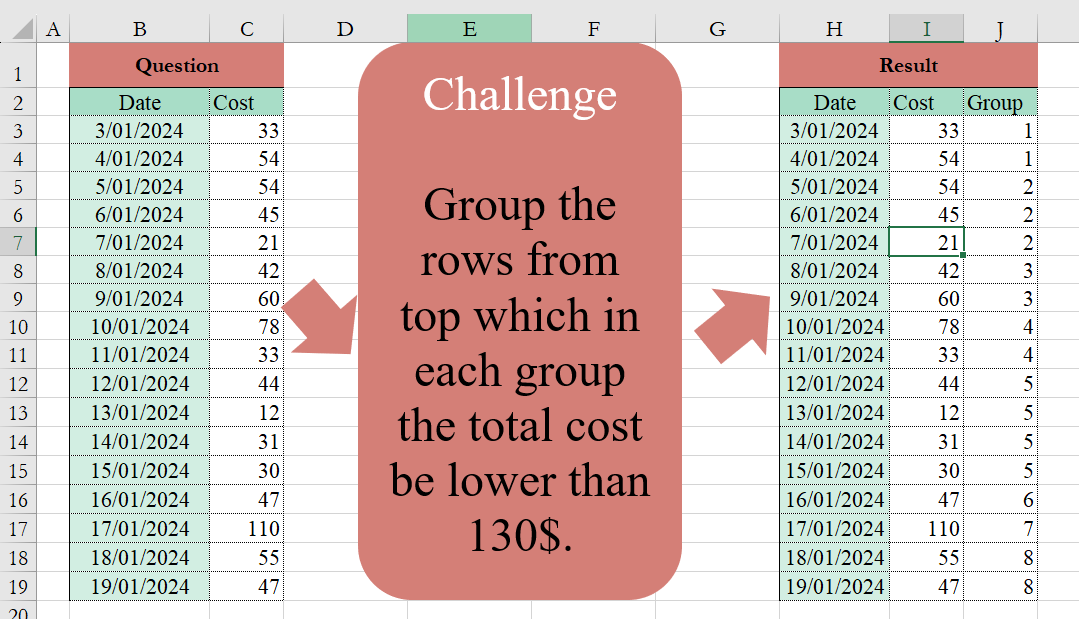
Challenge No. 2: Group the rows from the top, which in each group the total cost be lower than 130$.
Solved using:Excel (HSTACK, IF, LAMBDA), and Power Query (Table.Group).
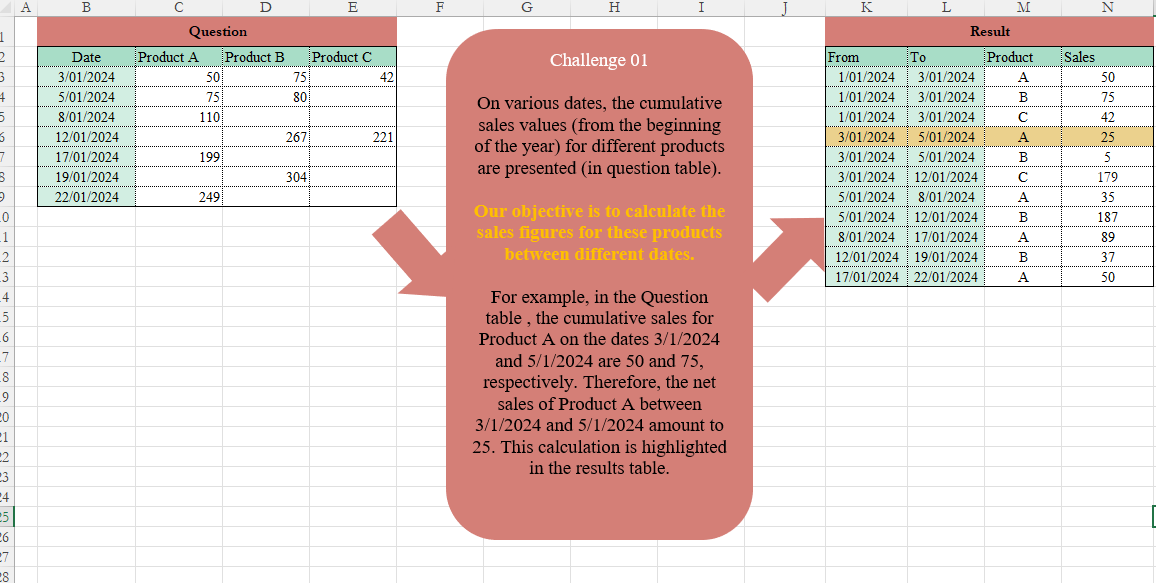
Challenge No. 1: On various dates, the cumulative sales values (from the beginning of the year) for different products are presented (in the Question table).
Solved using:Excel (DROP, FILTER, HSTACK), and Power Query (Table.AddColumn, Table.TransformColumnTypes).