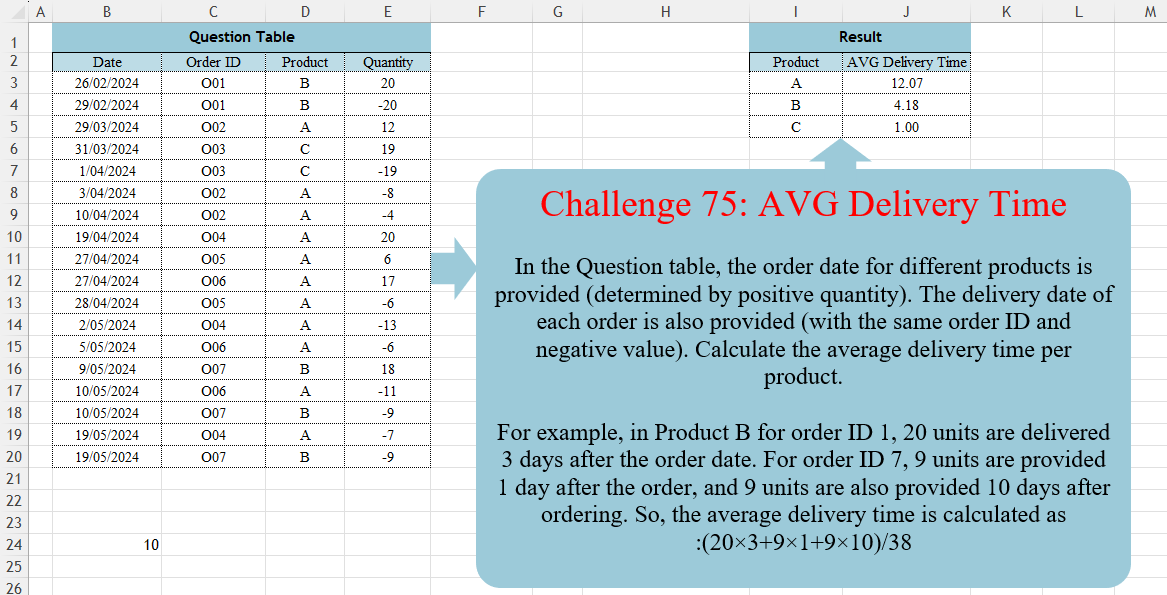
Challenge No. 75: In the Question table, the order date for different products is provided (determined by positive quantity).
Solved using:DAX, Excel (CHOOSECOLS, FILTER, HSTACK), Power Query (Table.AddColumn, Table.Group, Table.SelectRows), Python, R, and SQL.
CHOOSECOLS
Returns specific columns from an array in Excel.
Merge Columns
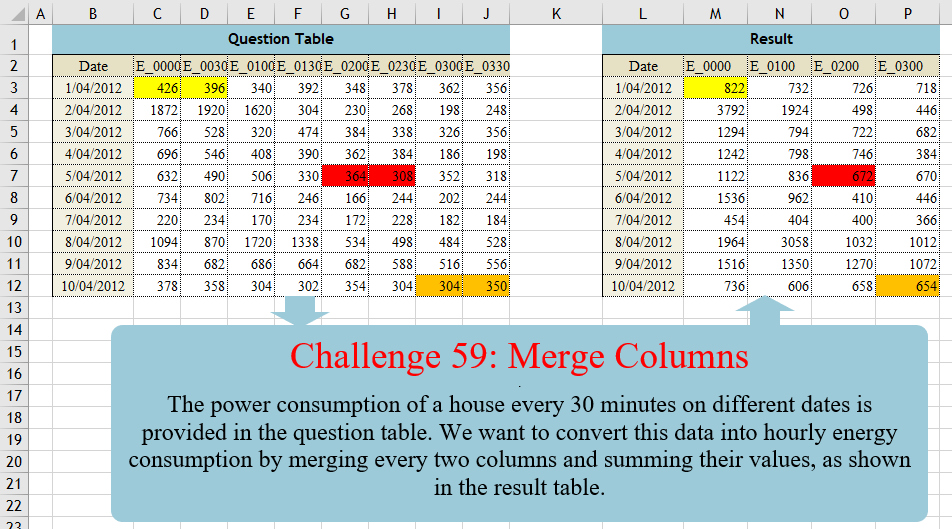
Challenge No. 59: The power consumption of a house every 30 minutes on different dates is provided in the question table.
Solved using:Excel (CHOOSECOLS, FILTER, HSTACK), Power Query (List.Distinct, List.Skip, List.Split), Python, Python in Excel, and R.
Assignment Problem (Part 2)!
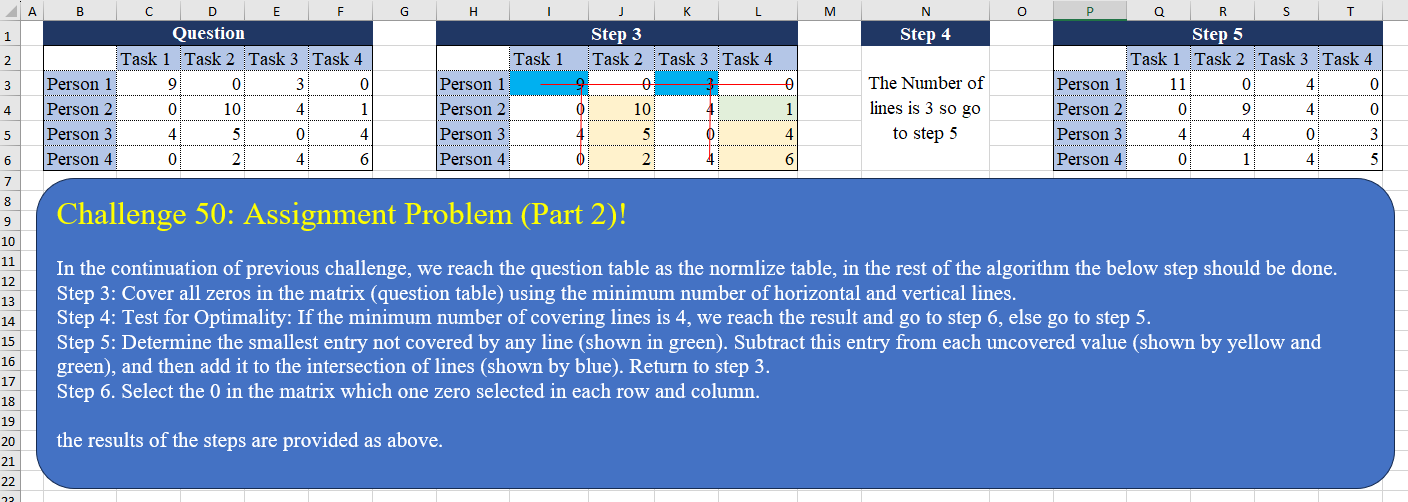
Challenge No. 50: In the continuation of the previous challenge, we reach the question table as the normalized table, in the rest of the algorithm the below step should be done.
Solved using:Excel (AND, BYCOL, BYROW), Power Query (List.Transform, Table.Column), Python, and R.
Custom Grouping! Part 2
Challenge No. 46: The “Question” table provides a list of Product IDs.
Solved using:Excel (CHOOSECOLS, DROP, FILTER), Power Query (Table.Group, List.Transform, Text.End), Python, and R.
Revisit After Surgery!
Challenge No. 42: In the question table, a list of patients is provided who are scheduled to visit the doctor for consultations and surgery.
Solved using:Excel (CHOOSECOLS, DROP, FILTER), Power Query (Text.Combine, Table.Group, Table.SelectRows), Python, and R.
Table Transformation! Part 4
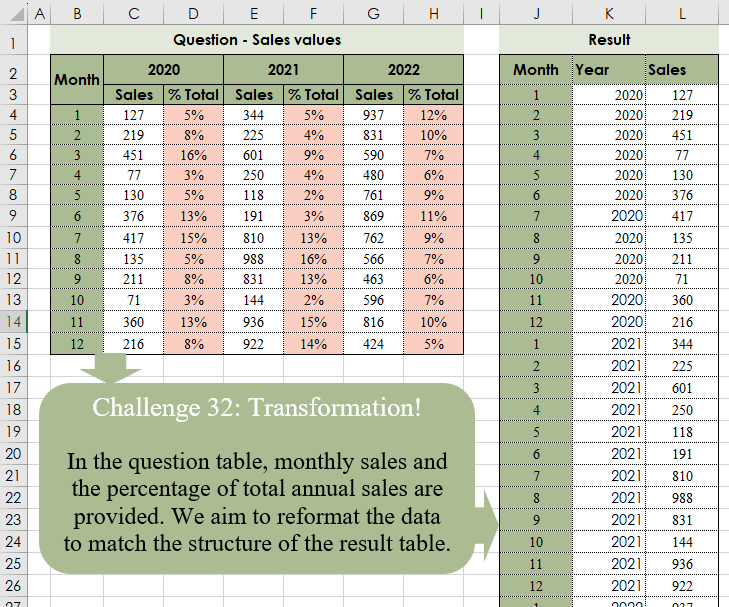
Challenge No. 32: In the question table, monthly sales and the percentage of total annual sales are provided.
Solved using:Excel (CHOOSECOLS, CHOOSEROWS, DROP), Power Query (Table.Column, Table.ColumnNames, Table.Sort), Python, and R.
Identifying Customers Staple Products!
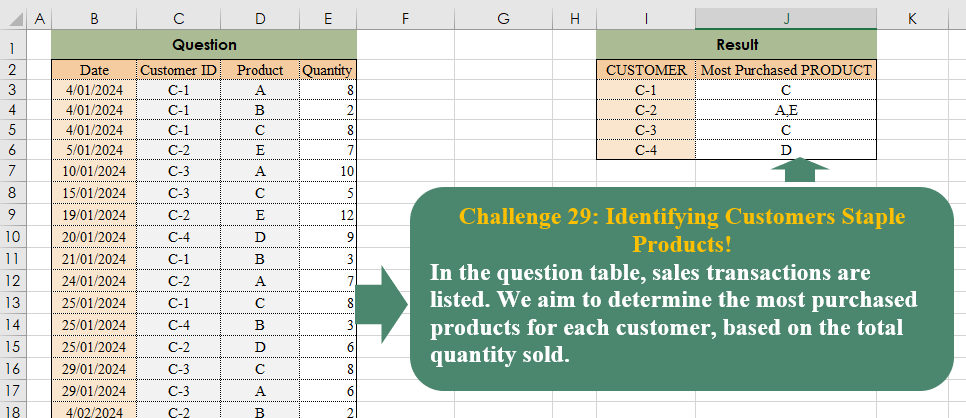
Challenge No. 29: In the question table, sales transactions are listed.
Solved using:Excel (CHOOSECOLS, FILTER, HSTACK), Power Query (Text.Combine, Table.Group), Python, and R.
ABC Inventory Analysis
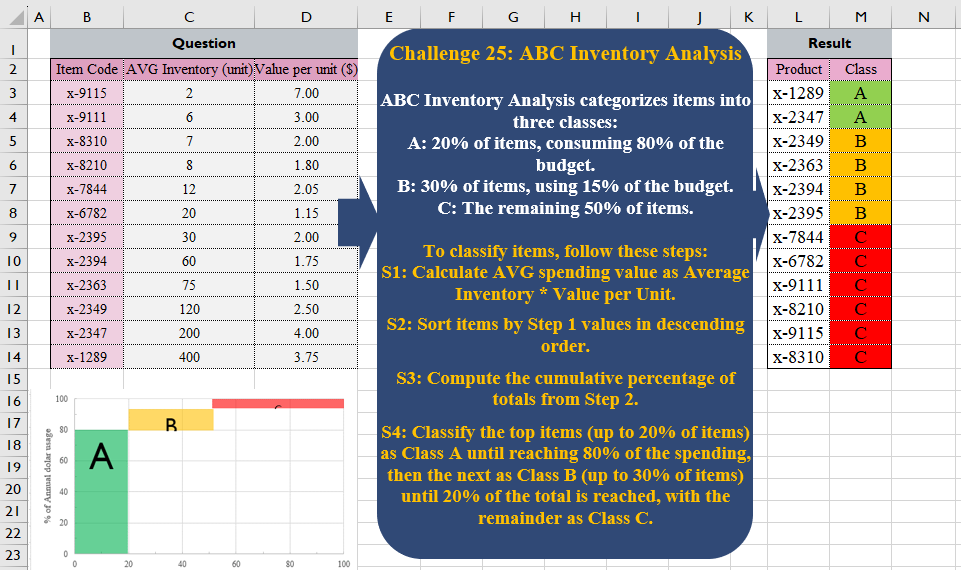
Challenge No. 25: ABC Inventory Analysis categorizes items into three classes:
A: 20% of items, consuming 80% of the budget.
Solved using:Excel (CHOOSECOLS, HSTACK, LET), Power Query (Table.AddColumn), Python, and R.
Advanced Weighted Average Calculation
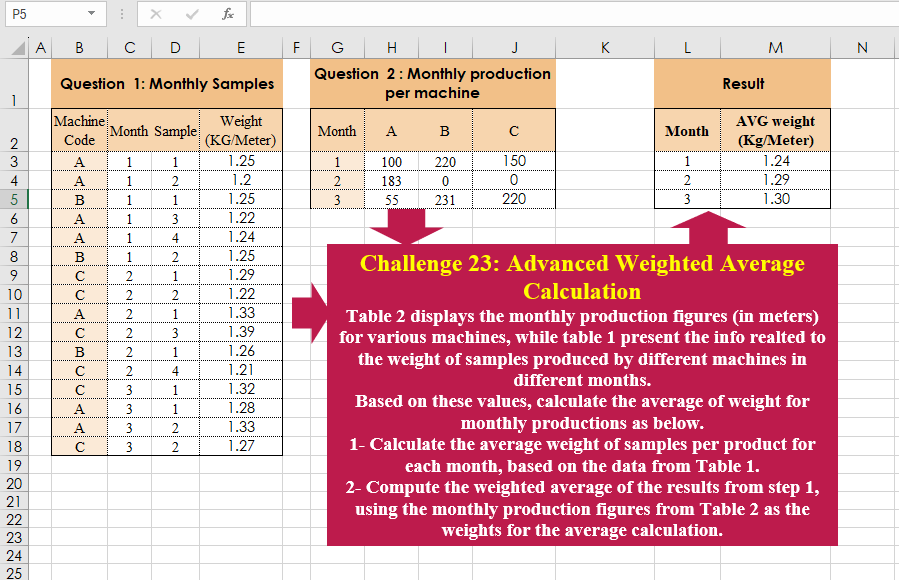
Challenge No. 23: Table 2 displays the monthly production figures (in meters) for various machines, while table 1 present the info realted to the weight of samples produced by different machines in different months.
Solved using:Excel (CHOOSECOLS, HSTACK, LAMBDA), Power Query (Table.AddColumn, Table.Group), and R.