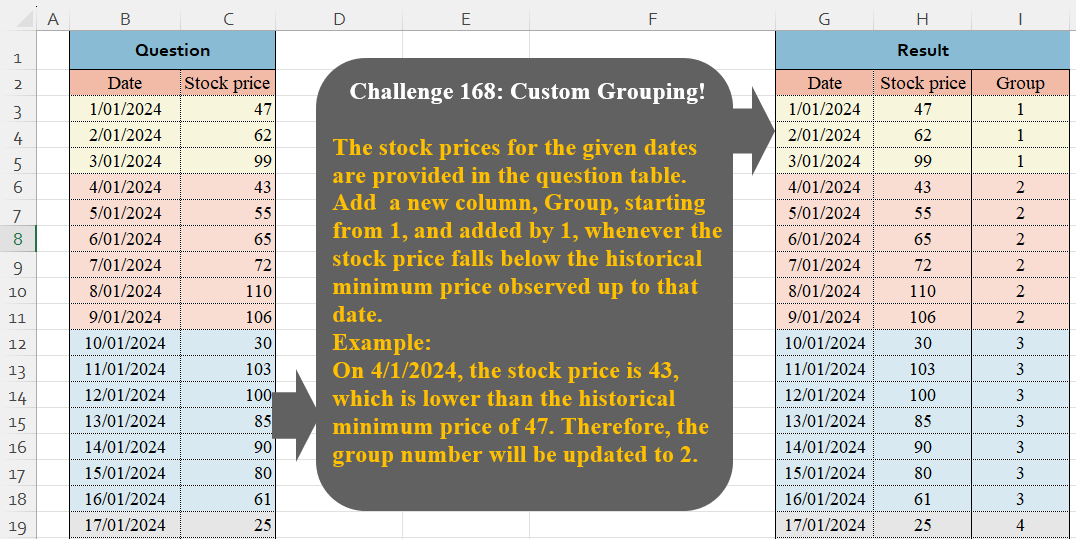
The stock prices for the given dates are provided in the question table. Add a new column, Group, starting from 1, and added by 1, whenever the stock price falls below the historical minimum price observed up to that date. Example:On 4/1/2024, the stock price is 43, which is lower than the historical minimum price of 47. Therefore, the group number will be updated to 2.
📌 Challenge Details and Links
Challenge Number: 168
Challenge Difficulty: ⭐
📥Download Sample File
📥Link to the solutions on LinkedIn
Solving the challenge of Custom Grouping! Part 14 with Power Query
Power Query solution 1 for Custom Grouping! Part 14, proposed by Zoran Milokanović:
let
  Source = Excel.CurrentWorkbook(){[Name = "Input"]}[Content],
  _ = Table.Group(Source, "Stock price", {"R", Table.ToRecords}, 0, (b, n) => Byte.From(b > n)),
  S = Table.FromRecords(
    List.TransformMany([R], each _, (i, o) => o & [Group = List.PositionOf([R], i) + 1])
  )
in
  S
Power Query solution 2 for Custom Grouping! Part 14, proposed by Zoran Milokanović:
let
  Source = Excel.CurrentWorkbook(){[Name = "Input"]}[Content],
  _ = Table.Group(
    Source,
    {"Date", "Stock price"},
    {"R", Table.ToRecords},
    0,
    (b, n) =>
      let
        p = each Table.PositionOf(Source, _),
        s = each [Stock price]
      in
        Byte.From(s(n) < List.Min(List.Range(s(Source), p(b), p(n) - p(b)), s(n)))
  ),
  S = Table.FromRecords(
    List.TransformMany([R], each _, (i, o) => o & [Group = List.PositionOf([R], i) + 1])
  )
in
  S
Power Query solution 3 for Custom Grouping! Part 14, proposed by Luan Rodrigues:
let
  Fonte = Table.Group(
    Tabela1,
    {"Stock price"},
    {{"tab", each _}},
    0,
    (a, b) => Number.From(a[Stock price] > b[Stock price])
  ),
  Ind = Table.AddIndexColumn(Fonte, "Group", 1)[[tab], [Group]],
  res = Table.ExpandTableColumn(Ind, "tab", {"Date", "Stock price"})
in
  res
Power Query solution 4 for Custom Grouping! Part 14, proposed by Ramiro Ayala Chávez:
let
S = Excel.CurrentWorkbook(){[Name="Table1"]}[Content],
a = Table.Group(S,"Stock price",{"G", each _},0,(x,y)=>Number.From(x>y)),
b = Table.AddIndexColumn(a,"Group",1)[[G],[Group]],
Sol = Table.ExpandTableColumn(b,"G",{"Date","Stock price"})
in
Sol
Power Query solution 5 for Custom Grouping! Part 14, proposed by Alejandro Simón 🇵🇦 🇪🇸:
let
  Source = Excel.CurrentWorkbook(){[Name = "Table1"]}[Content],
  Index = Table.AddIndexColumn(Source, "Idx", 0, 1, Int64.Type),
  Grp = Table.Group(
    Index,
    {"Idx", "Stock price"},
    {{"A", each _}},
    0,
    (a, b) => Number.From(b[Stock price] < List.Min(List.FirstN(Index[Stock price], b[Idx])))
  )[[A]],
  Group = Table.AddIndexColumn(Grp, "Group", 1),
  Sol = Table.ExpandTableColumn(Group, "A", Table.ColumnNames(Source))
in
  Sol
Power Query solution 6 for Custom Grouping! Part 14, proposed by Kris Jaganah:
let
  A = Excel.CurrentWorkbook(){[Name = "Table1"]}[Content],
  B = A[Stock price],
  C = List.Generate(
    () => [a = 0, b = B{0}, c = 1],
    each [a] < List.Count(B),
    each [a = [a] + 1, b = List.Min(List.FirstN(B, a + 1)), c = if b = [b] then [c] else [c] + 1],
    each [c]
  ),
  D = Table.FromColumns({A[Date], C}, Table.ColumnNames(A))
in
  D
Power Query solution 7 for Custom Grouping! Part 14, proposed by Abdallah Ally:
let
  Source = Excel.CurrentWorkbook(){[Name = "Table1"]}[Content],
  Generate = List.Generate(
    () => [Row = 0, Cur = Source[Stock price]{0}, Min = Cur, Gr = 1],
    each [Row] < Table.RowCount(Source),
    each [
      Row = [Row] + 1,
      Cur = Source[Stock price]{Row},
      Min = if Cur < [Min] then Cur else [Min],
      Gr  = [Gr] + Byte.From(Cur < [Min])
    ],
    each [Gr]
  ),
  ColNames = Table.ColumnNames(Source) & {"Group"},
  FromCols = Table.FromColumns(Table.ToColumns(Source) & {Generate}, ColNames),
  Result = Table.TransformColumnTypes(FromCols, {"Date", type date})
in
  Result
Power Query solution 8 for Custom Grouping! Part 14, proposed by 🇮🇷 Navid Esmaeilzadeh اسماعیل زاده:
let
  S = Excel.CurrentWorkbook(){[Name = "Table1"]}[Content],
  A = Table.AddIndexColumn(S, "I", 1, 1),
  B = Table.AddColumn(A, "L", each List.Min(List.FirstN(A[Stock price], [I]))),
  C = Table.RemoveColumns(B, {"I"}),
  D = Table.Group(C, {"L"}, {{"T", each _}}),
  E = Table.AddIndexColumn(D, "Group", 1, 1),
  F = Table.AddColumn(
    E,
    "T2",
    each Table.FromColumns(
      {[T][Date], [T][#"Stock price"], List.Repeat({[Group]}, Table.RowCount([T]))},
      {"Date", "Stock Price", "Group"}
    )
  ),
  G = Table.Combine(F[T2])
in
  G
Power Query solution 9 for Custom Grouping! Part 14, proposed by Seokho MOON:
let
  Source   = Excel.CurrentWorkbook(){[Name = "Table1"]}[Content],
  Group    = Table.Group(Source, "Stock price", {"All", each _}, 0, (x, y) => Number.From(x > y)),
  AddIndex = Table.AddIndexColumn(Group, "Group", 1, 1)[[All], [Group]],
  Expand   = Table.ExpandTableColumn(AddIndex, "All", {"Date", "Stock price"})
in
  Expand
Power Query solution 10 for Custom Grouping! Part 14, proposed by Alexandre Garcia:
let
H = Excel.CurrentWorkbook(){[Name="Table1"]}[Content],
P = {"Date", "Stock price"},
L = Table.Group(H, P, {"x", (x)=> x }, 0,(x,y)=> Byte.From(x[Stock price] > y[Stock price])),
C = Table.ExpandTableColumn(Table.RemoveColumns(Table.AddIndexColumn(L, "Group", 1),P),"x",P)
in C
Power Query solution 11 for Custom Grouping! Part 14, proposed by Vida Vaitkunaite:
let
 Source = Excel.CurrentWorkbook(){[Name="Table1"]}[Content],
 Custom = Table.AddColumn(Source, "Custom", each let
a = Table.First(Source)[Stock price],
b = if a - [Stock price]>=0 then 1*[Stock price] else null
in b),
 FillDown = Table.FillDown(Custom,{"Custom"}),
 Groups = Table.Group(FillDown, {"Custom"}, {{"All", each _, type table}}),
 Index = Table.RemoveColumns(Table.AddIndexColumn(Groups, "Group", 1, 1), "Custom"),
 Final = Table.ExpandTableColumn(Index, "All", {"Date", "Stock price"}, {"Date", "Stock price"})
in
 Final
Solving the challenge of Custom Grouping! Part 14 with Excel
Excel solution 1 for Custom Grouping! Part 14, proposed by Oscar Mendez Roca Farell:
=LET(
    s,
    SCAN(
        ,
        C3:C26,
        MIN
    ),
    HSTACK(
        B3:C26,
        XMATCH(
            s,
            UNIQUE(
                s
            )
        )
    )
)
Excel solution 2 for Custom Grouping! Part 14, proposed by Julian Poeltl:
=LET(
    M,
    MAP(
        C3:C26,
        LAMBDA(
            A,
            MIN(
                C3:A
            )
        )
    ),
    XMATCH(
        M,
        UNIQUE(
            M
        )
    )
)
Excel solution 3 for Custom Grouping! Part 14, proposed by Kris Jaganah:
=LET(
    a,
    SCAN(
        ,
        C3:C26,
        MIN
    ),
    XMATCH(
        a,
        UNIQUE(
            a
        )
    )
)
Excel solution 4 for Custom Grouping! Part 14, proposed by Sunny Baggu:
=LET(     _a,
     MAP(          C3:C26,          LAMBDA(
              a,
               MIN(
                   C3:a
               )
          )     ),     HSTACK(          B3:C26,          XMATCH(
              _a,
               UNIQUE(
                   _a
               )
          )     ))
Excel solution 5 for Custom Grouping! Part 14, proposed by Sunny Baggu:
=LET(     _s,
     SEQUENCE(
         ROWS(
             B3:B26
         )
     ),     _m,
     MAP(          _s,          LAMBDA(
              a,
               MIN(
                   TAKE(
                       C3:C26,
                        a
                   )
               )
          )     ),     HSTACK(
         B3:C26,
          XMATCH(
              _m,
               UNIQUE(
                   _m
               )
          )
     ))
Excel solution 6 for Custom Grouping! Part 14, proposed by Ankur Sharma:
=SCAN(0,
     SEQUENCE(
         COUNT(
             H3:H26
         )
     ),
     LAMBDA(i,
     a,LET(s,
     CHOOSEROWS(
         H3:H26,
          a
     ),m,
     MIN(
         TAKE(
         H3:H26,
          a
     )
     ),i + (s <= m))))
Excel solution 7 for Custom Grouping! Part 14, proposed by Asheesh Pahwa:
=LET(
    t,
    TAKE(
        C3:C26,
        1
    ),
    v,
    VSTACK(
        TRUE,
        DROP(
            t>C3:C26,
            1
        )
    ),    s,
    SCAN(
        0,
        --v*C3:C26,
        LAMBDA(
            x,
            y,
            IF(
                y,
                y,
                x
            )
        )
    ),
    XMATCH(
        s,
        UNIQUE(
            s
        )
    )
)
Excel solution 8 for Custom Grouping! Part 14, proposed by Asheesh Pahwa:
=LET(
    s,
    SCAN(
        0,
        C3:C26,
        LAMBDA(
            x,
            y,
            MIN(
                C3:y
            )
        )
    ),
    XMATCH(
        s,
        UNIQUE(
            s
        )
    )
)
Excel solution 9 for Custom Grouping! Part 14, proposed by Liuxuan Fan:
=IF(
    ISNUMBER(
        B2
    )*1,
    IF(
        B3
Excel solution 10 for Custom Grouping! Part 14, proposed by Md. Zohurul Islam:
=LET(    a,
    B3:C26,    b,
    C3:C26,    hdr,
    HSTACK(
        B2:C2,
        "Group"
    ),    u,
    SCAN(
        C3,
        b,
        LAMBDA(
            x,
            y,
            MIN(
                x,
                y
            )
        )
    ),    v,
    VSTACK(
        1,
        ABS(
            DROP(
                u,
                1
            )=DROP(
                u,
                -1
            )
        )
    ),    w,
    SCAN(
        0,
        v,
        LAMBDA(
            x,
            y,
            IF(
                y=0,
                x+1,
                x
            )
        )
    )+1,    z,
    VSTACK(
        hdr,
        HSTACK(
            a,
            w
        )
    ),    z
)
Excel solution 11 for Custom Grouping! Part 14, proposed by Nicolas Micot:
=LET(
    _cumMin;
    SCAN(
        -1;
        H3:H26;
        LAMBDA(
            l_min;
            l_valeur;
            SI(
                OU(
                    l_min=-1;
                    l_valeurINDEX(
                        _cumMin;
                        l_index-1
                    );
                    l_valeurInit+1;
                    l_valeurInit
                )
            )
        )
    )
)
Excel solution 12 for Custom Grouping! Part 14, proposed by Nikola Z Grujicic - Nikola Ž Grujičić:
=LET(
    a,
     SCAN(
         1000,
          C3:C26,
          LAMBDA(
              x,
              y,
               IF(
                   y
Excel solution 13 for Custom Grouping! Part 14, proposed by Peter Bartholomew:
= LET(     currentMin,
     SCAN(
         ,
         price,
          MIN
     ),     previousMin,
     VSTACK(
         "x",
          DROP(
              currentMin,
              -1
          )
     ),     change,
     currentMin<>previousMin,     SCAN(
         ,
         N(
             change
         ),
          SUM
     ))
Excel solution 14 for Custom Grouping! Part 14, proposed by Pieter de B.:
=LET(
    r,
    REDUCE(
        ,
        C3:C26,
        LAMBDA(
            a,
            b,
            VSTACK(
                a,
                IF(
                    b
Excel solution 15 for Custom Grouping! Part 14, proposed by Rick Rothstein:
=SCAN(0,
    C3:C26,
    LAMBDA(a,
    x,
    a+(x<=MIN(
        C3:x
    ))))
Solving the challenge of Custom Grouping! Part 14 with Python
Python solution 1 for Custom Grouping! Part 14, proposed by Konrad Gryczan, PhD:
import pandas as pd

path = "CH-168 Custom Grouping.xlsx"
input = pd.read_excel(path, usecols="B:C", skiprows=1, nrows=25)
test = pd.read_excel(path, usecols="G:I", skiprows=1, nrows=25).rename(columns=lambda x: x.split('.')[0])

input['Group'] = ((input['Stock price'].cummin() != input['Stock price'].cummin().shift().fillna(input['Stock price'].cummin().iloc[0])).cumsum() + 1)

print(all(input == test)) # True
Python solution 2 for Custom Grouping! Part 14, proposed by Luan Rodrigues:
import pandas as pd

file = "CH-168 Custom Grouping.xlsx"

df = pd.read_excel(file,usecols="B:C",skiprows=1)

df['Group'] = df['Stock price'].cummin()
group_dict = {group: idx+1 for idx, group in enumerate(df['Group'].unique())}
df['Group'] = df['Group'].map(group_dict)
print(df)
Python solution 3 for Custom Grouping! Part 14, proposed by Abdallah Ally:
import pandas as pd
# Load the Excel file
file_path = CH-168 Custom Grouping.xlsx'
df = pd.read_excel(file_path, usecols='B:C', skiprows=1)
# Perform data manipulation
group_values = []
minimum = df.iat[0, 1]
group = 1
for price in df['Stock price']:
 if price < minimum:
 minimum = price
 group += 1
 group_values.append(group)
df['Group'] = group_values
# Display the final results
df
Solving the challenge of Custom Grouping! Part 14 with Python in Excel
Python in Excel solution 1 for Custom Grouping! Part 14, proposed by Abdallah Ally:
_xDCB9_Office script solution ✍
hashtag
#Python
hashtag
#R
hashtag
#SQL
hashtag
#Excel
hashtag
#VBA
hashtag
#OfficeScript
hashtag
#PowerBI
hashtag
#PowerQuery
function main(workbook: ExcelScript.Workbook) {
 // Get the active worksheet and initialize values.
 const curSheet = workbook.getActiveWorksheet();
 const resCell = curSheet.getRange('K2');
 const curRegion = curSheet.getRange('B2').getSurroundingRegion();
 const copyRange = curRegion.getOffsetRange(1, 0).getResizedRange(-1, 0);
 const colCount = copyRange.getColumnCount();
 const rowCount = copyRange.getRowCount();
 // Paste values and add a heading
 resCell.copyFrom(copyRange, ExcelScript.RangeCopyType.values);
 resCell.getOffsetRange(0, colCount).setValue('Group')
 let minimum = resCell.getOffsetRange(1, colCount - 1).getValue();
 let groupValue = 1;
 for (let cRow = 1; cRow < rowCount; cRow++) {
 const cRange = resCell.getOffsetRange(cRow, colCount - 1);
 const cValue = cRange.getValue() as number;
 if (minimum > cValue) {
 minimum = cValue;
 groupValue++
 }
 cRange.getOffsetRange(0, 1).setValue(groupValue);
 }
}
Python in Excel solution 2 for Custom Grouping! Part 14, proposed by Alejandro Campos:
df = xl("B2:C26", headers=True)
df['Group'] = 1
min_price = df.loc[0, 'Stock price']
for i in range(1, len(df)):
 if df.loc[i, 'Stock price'] < min_price:
 min_price = df.loc[i, 'Stock price']
 df.loc[i:, 'Group'] = df.loc[i, 'Group'] + 1
df
Solving the challenge of Custom Grouping! Part 14 with R
R solution 1 for Custom Grouping! Part 14, proposed by Konrad Gryczan, PhD:
library(tidyverse)
library(readxl)

path = "files/CH-168 Custom Grouping.xlsx"
input = read_excel(path, range = "B2:C26")
test = read_excel(path, range = "G2:I26")

result = input %>%
 mutate(group = cumsum(cummin(`Stock price`) != lag(cummin(`Stock price`), default = first(cummin(`Stock price`)))) + 1)

all.equal(result, test, check.attributes = FALSE)
#> [1] TRUE
Solving the challenge of Custom Grouping! Part 14 with Google Sheets
Google Sheets solution 1 for Custom Grouping! Part 14, proposed by Peter Krkos:
PowerQuery solution:
https://docs.google.com/spreadsheets/d/1zR5IZLz8OT76vhaPEHfsPrw8-RDKnLyyqS49IJjdhFk/edit?pli=1&gid=933552922#gid=933552922