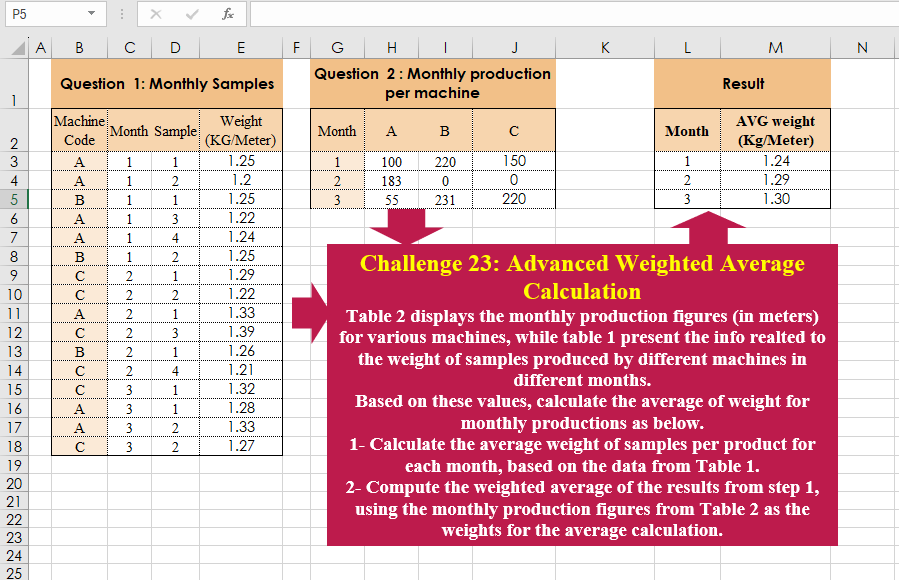
Challenge No. 23: Table 2 displays the monthly production figures (in meters) for various machines, while table 1 present the info realted to the weight of samples produced by different machines in different months.
Solved using:Excel (CHOOSECOLS, HSTACK, LAMBDA), Power Query (Table.AddColumn, Table.Group), and R.
By Creator
This is determine the challenge creator
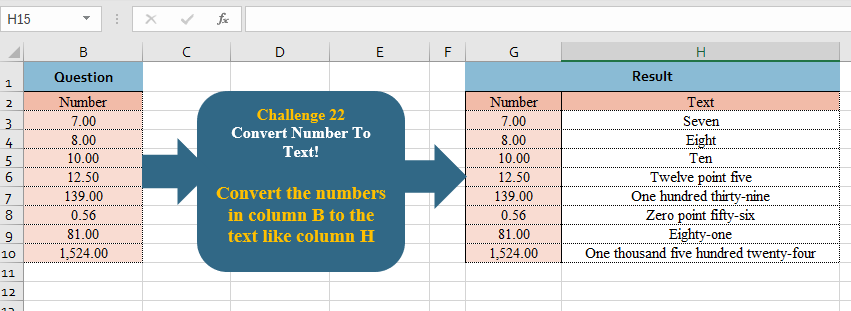
Convert Number To Text!
Challenge No. 22: Convert the numbers in column B to the text like column H
.
Solved using:Excel, Power Query, and R.
Table Transformation! Part 3
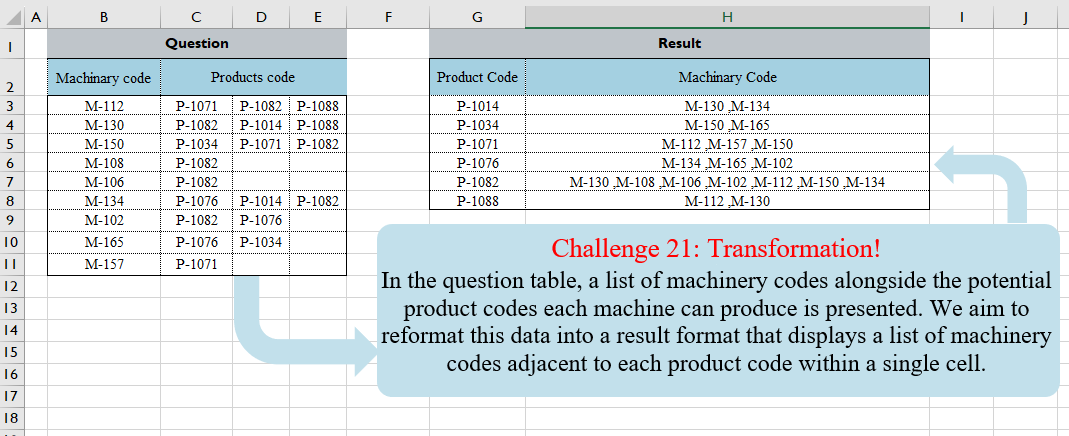
Challenge No. 21: In the question table, a list of machinery codes alongside the potential product codes each machine can produce is presented.
Solved using:Excel (FILTER, HSTACK, LAMBDA), Power Query (Text.Combine, Table.Group, Table.Sort), and R.
Hierarchy Transformation
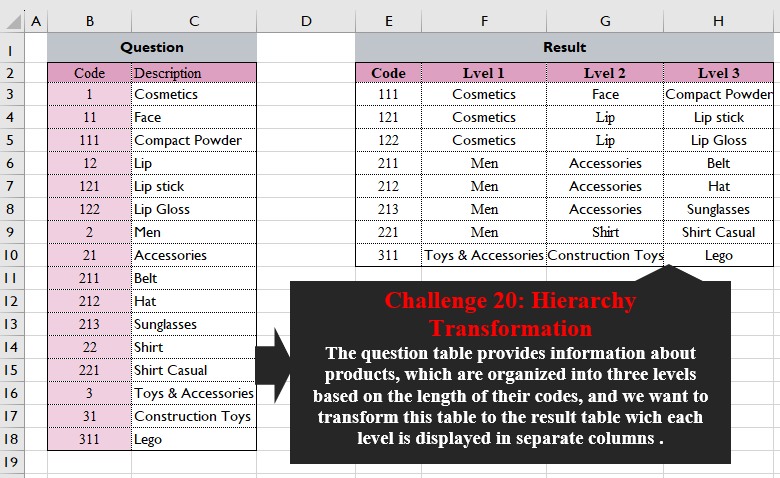
Challenge No. 20: The question table provides information about products, which are organized into three levels based on the length of their codes, and we want to transform this table into the result table wich each level is displayed in separate columns.
Solved using:Excel (FILTER, HSTACK, LEFT), Power Query (List.Transform), Python, and R.
Sudoku In Excel
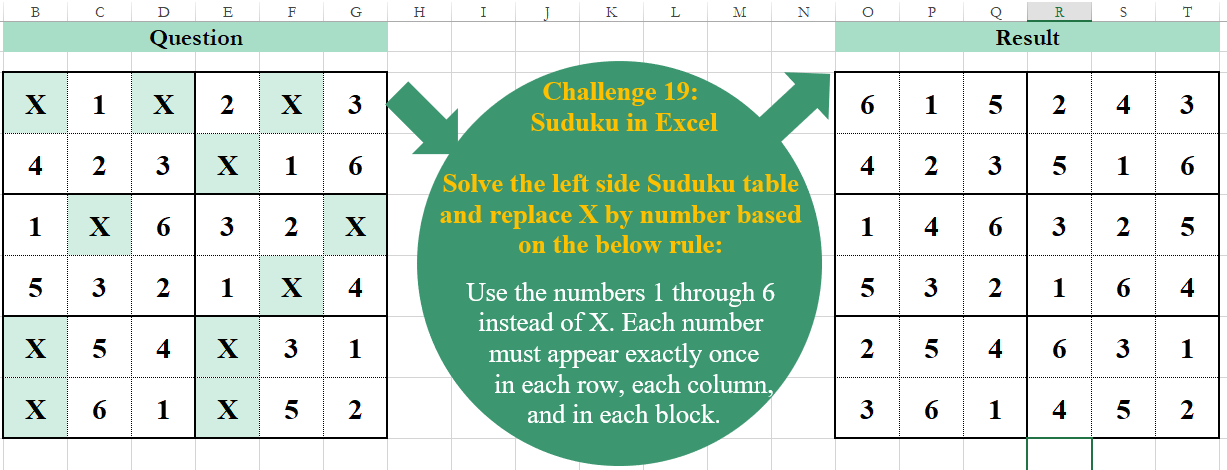
Challenge No. 19: Solve the left side Sudoku table and replace X by a number based on the below rule:
Use the numbers 1 through 6 instead of X.
Solved using:Excel, Power Query, and VBA.
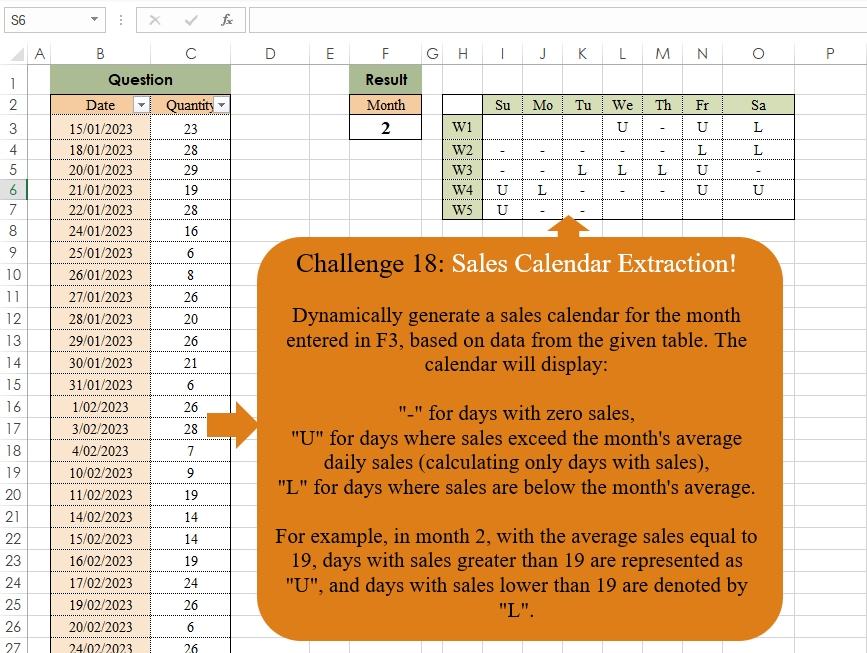
Sales Calendar Extraction!
Challenge No. 18: Dynamically generate a sales calendar for the month entered in F3, based on data from the given table.
Solved using:Excel, Power Query, and R.
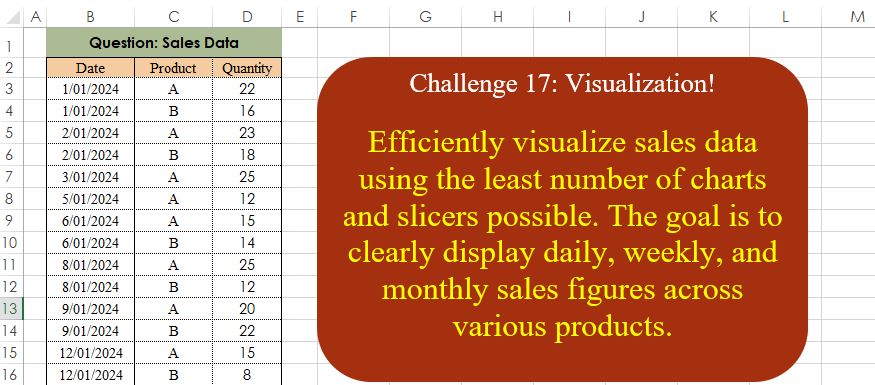
Visualization!
Challenge No. 17: Efficiently visualize sales data using the least number of charts and slicers possible.
Solved using: Excel.
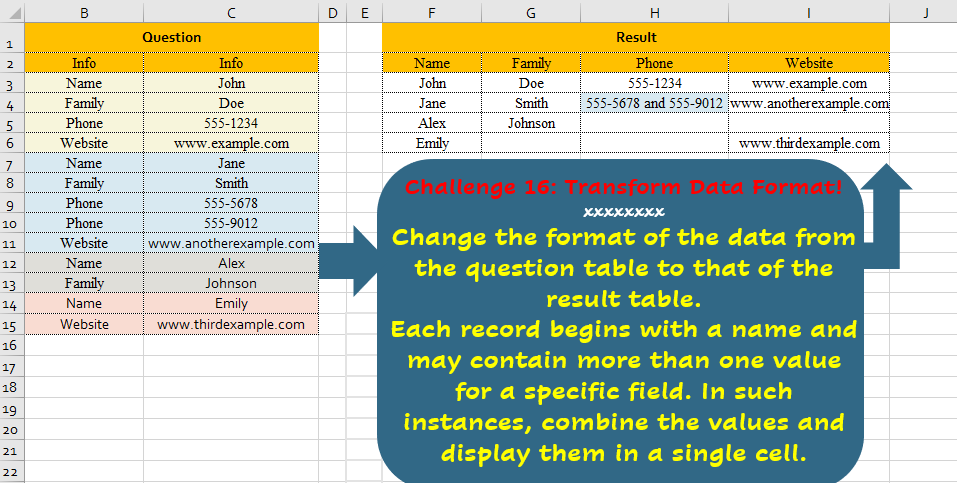
Transform Data Format!
Challenge No. 16: Change the format of the data from the question table to that of the result table.
Solved using:Excel, Power Query, and R.
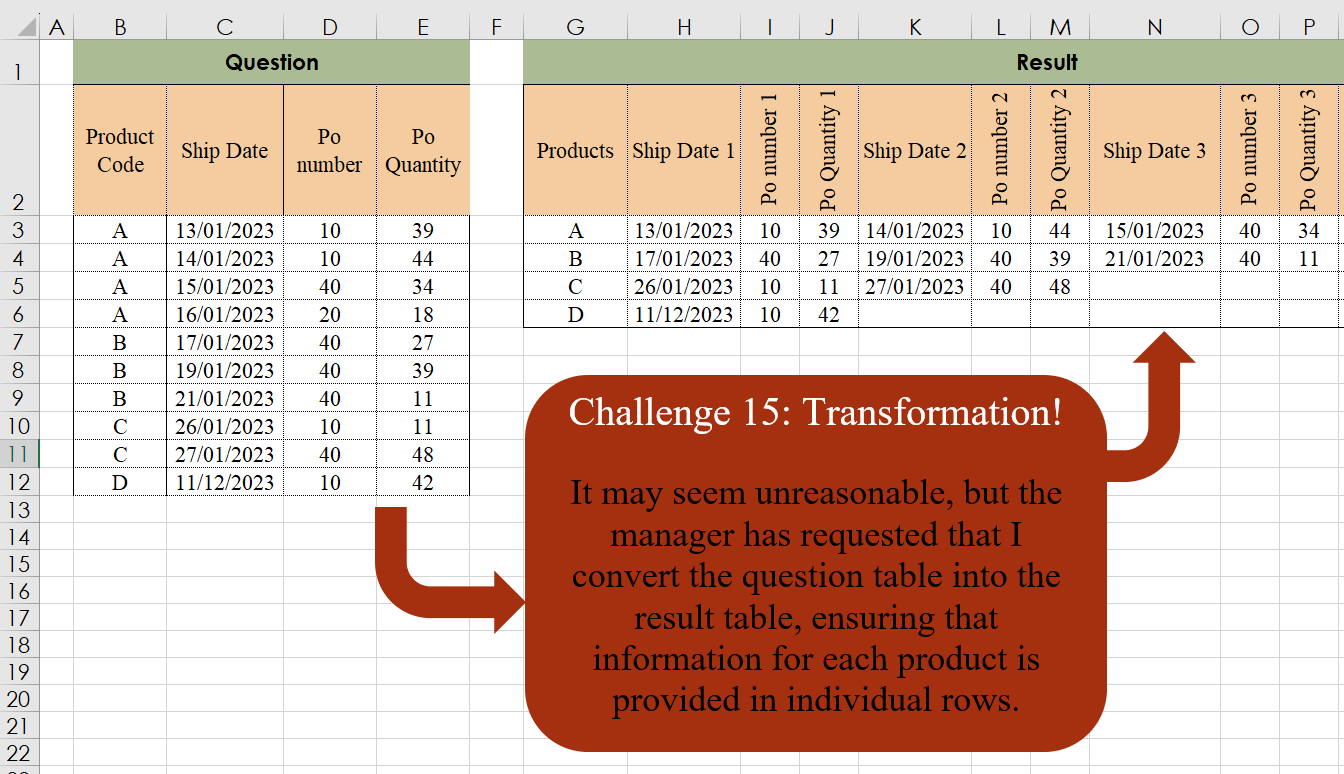
Table Transformation! Part 2
Challenge No. 15: It may seem unreasonable, but the manager has requested that I convert the question table into the result table, ensuring that information for each product is provided in individual rows.
Solved using:Excel, Power Query, and R.
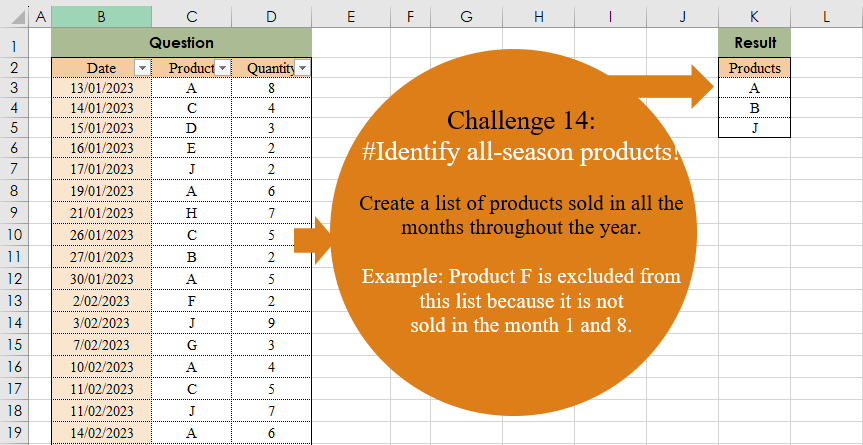
Identify All-Season Products!
Challenge No. 14: Create a list of products sold in all the months throughout the year.
Solved using:Excel (COUNT, FILTER, LAMBDA), Power Query (Date.Month, List.Distinct, List.Transform), and R.