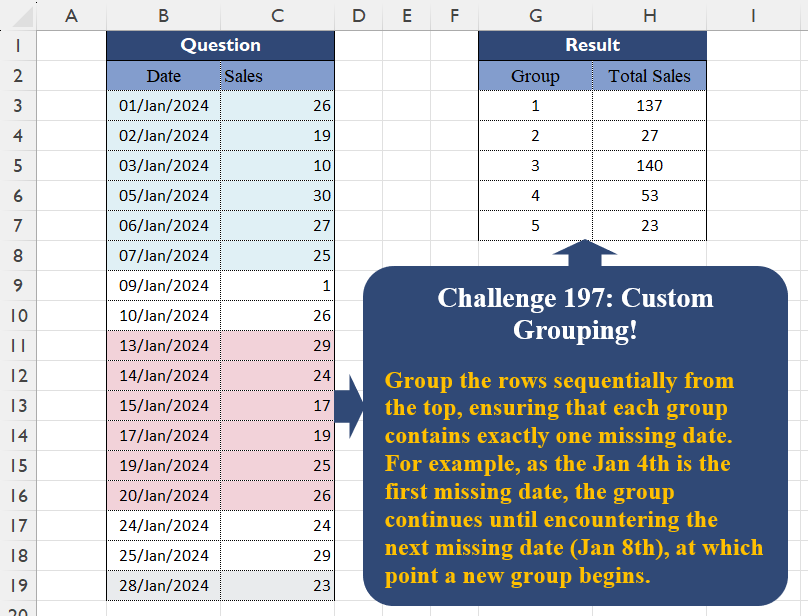
Group the rows sequentially from the top, ensuring that each group contains exactly one missing date. For example, as the Jan 4th is the first missing date, the group continues until encountering the next missing date (Jan 8th), at which point a new group begins.
📌 Challenge Details and Links
Challenge Number: 197
Challenge Difficulty: ⭐⭐⭐
📥Download Sample File
📥Link to the solutions on LinkedIn
Solving the challenge of Custom Grouping! Part 19 with Power Query
Power Query solution 1 for Custom Grouping! Part 19, proposed by Zoran Milokanović:
let
  Source = Excel.CurrentWorkbook(){[Name = "Input"]}[Content],
  _ = Table.Group(
    Source,
    "Date",
    {"T", each List.Sum([Sales])},
    0,
    (b, n) =>
      let
        p = each List.PositionOf(Source[Date], _)
      in
        Byte.From(Number.From(n - b) - p(n) + p(b) > 1)
  ),
  S = Table.FromColumns({{1 .. List.Count([T])}, [T]}, {"Group", "Total Sales"})
in
  S
Power Query solution 2 for Custom Grouping! Part 19, proposed by Alejandro Simón 🇵🇦 🇪🇸:
let
  Origen = Excel.CurrentWorkbook(){[Name = "Tabla1"]}[Content],
  Grp = Table.Group(
    Origen,
    "Date",
    {{"Total Sales", each List.Sum([Sales])}},
    0,
    (x, y) =>
      Number.From(
        let
          a = {Number.From(x) .. Number.From(y)},
          b = List.Select(
            Origen[Date],
            each Number.From(_) >= a{0} and Number.From(_) <= List.Last(a)
          ),
          c = List.Transform(b, Number.From),
          d = List.Count(List.Difference(a, c)) > 1
        in
          d
      )
  ),
  Sol = Table.AddIndexColumn(Grp, "Group", 1, 1)[[Group], [Total Sales]]
in
  Sol
Power Query solution 3 for Custom Grouping! Part 19, proposed by Seokho MOON:
let
  Source = Excel.CurrentWorkbook(){[Name = "Table1"]}[Content],
  Idx = Table.AddIndexColumn(Source, "Idx", 0),
  Group = Table.Group(
    Idx,
    {"Date", "Idx"},
    {"Total Sales", each List.Sum([Sales])},
    0,
    (x, y) => Number.From(Number.From(y[Date] - x[Date]) > y[Idx] - x[Idx] + 1)
  )[[Total Sales]],
  Res = Table.AddIndexColumn(Group, "Group", 1)[[Group], [Total Sales]]
in
  Res
Power Query solution 4 for Custom Grouping! Part 19, proposed by S. Jalal Armioun:
let's call it Group- for grouping using the following formula:
if Data.Day([Date]) <= 7 then 1
else if Data.Day([Date]) <= 10 then 2
else if Data.Day([Date]) <= 20 then 3
else if Data.Day([Date]) <= 25 then 4
else 5
Next: we can go to the home tab and click on the Group By bottom, group the "Group" column and sum the sales column. Done! ✅
Power Query solution 5 for Custom Grouping! Part 19, proposed by Sahan Jayasuriya:
let
  Source = Excel.CurrentWorkbook(){[Name = "Data"]}[Content],
  AddedIndex = Table.AddIndexColumn(Source, "Index", 0, 1, Int64.Type),
  CustomGrouping = Table.Group(
    AddedIndex,
    {"Date", "Index"},
    {{"Total Sales", each List.Sum(_[Sales])}},
    GroupKind.Local,
    (x, y) =>
      [
        a = {Number.From(x[Date]) .. Number.From(y[Date])},
        b = List.Transform(
          Table.SelectRows(AddedIndex, (k) => k[Index] >= x[Index] and k[Index] <= y[Index])[Date],
          Number.From
        ),
        c = List.Count(List.Difference(a, b)),
        d = if c <= 1 then 0 else 1
      ][d]
  ),
  Final = Table.AddIndexColumn(CustomGrouping, "Group", 1, 1, Int64.Type)[[Group], [Total Sales]]
in
  Final
Power Query solution 6 for Custom Grouping! Part 19, proposed by Vida Vaitkunaite:
let
  Source = Excel.CurrentWorkbook(){[Name = "Table1"]}[Content],
  Index = Table.AddIndexColumn(Source, "Index", 0, 1),
  Custom = Table.AddColumn(Index, "Custom", each Number.From([Date]) - [Index]),
  Group = Table.Group(
    Custom,
    "Custom",
    {{"Total Sales", each List.Sum([Sales])}},
    0,
    (x, y) => Number.From(y - x > 1)
  ),
  Final = Table.AddIndexColumn(Group, "Group", 1, 1)[[Group], [Total Sales]]
in
  Final
Solving the challenge of Custom Grouping! Part 19 with Excel
Excel solution 1 for Custom Grouping! Part 19, proposed by 🇰🇷 Taeyong Shin:
=LET(
    d,
    B3:B19,
    n,
    ODD(
        SCAN(
            ,
            1-VSTACK(
                1,
                COUNTIF(
                    d,
                    DROP(
                        d,
                        1
                    )-1
                )
            ),
            SUM
        )
    ),
    GROUPBY(
        XMATCH(
            n,
            UNIQUE(
                n
            )
        ),
        C3:C19,
        SUM,
        ,
        0
    )
)
Excel solution 2 for Custom Grouping! Part 19, proposed by Oscar Mendez Roca Farell:
=LET(
    d,
    B3:B19,
    s,
    SEQUENCE(
        MAX(
            d
        )-@+d+1,
        ,
        @+d
    ),
    c,
     SCAN(
         1,
          ISNA(
              XMATCH(
                  s,
                  d
              )
          ),
         SUM
     ),
    GROUPBY(
        BYROW(
            N(
                d>=TOROW(
                    XLOOKUP(
                         UNIQUE(
                             FILTER(
                                 c,
                                 ISEVEN(
                                     c
                                 )
                             )
                         ),
                        c,
                        s,
                        ,
                        ,
                        -1
                    )+1
                )
            ),
            SUM
        )+1,
        C3:C19,
        SUM,
        ,
        0
    )
)
Excel solution 3 for Custom Grouping! Part 19, proposed by Hamidi Hamid:
=LET(av,
    VSTACK,
    as,
    HSTACK,
    q,
    LAMBDA(
        d,
        j,
        TAKE(
            d,
            ,
            j
        )
    ),
    bt,
    B3:B19,
    x,
    DROP(
        av(
            TAKE(
                bt,
                1
            )-1,
            bt
        )-av(
            bt,
            TAKE(
                bt,
                -1
            )
        ),
        -1
    )*1,
    w,
    (x<-1)*1,
    v,
    SCAN(
        0,
        w,
        SUM
    ),
    h,
    IFERROR((DROP(
        IF(
            w=1,
            v,
            ""
        ),
        1
    )*1>1)*1,
    ""),
    r,
    IF(
        h=1,
        "x",
        1/0
    ),
    u,
    IF(
        r=DROP(
            r,
            1
        ),
        0,
        1/0
    ),
    P,
    as(
        r,
        u
    ),
    s,
    TOCOL(
        as(
            C3:C19,
            IFERROR(
                q(
                    P,
                    -1
                ),
                q(
                    P,
                    1
                )
            )
        ),
        3
    ),
    f,
    SCAN(
        0,
        s,
        LAMBDA(
            a,
            b,
            IF(
                b="x",
                0,
                a+b
            )
        )
    ),
    o,
    as(
        av(
            DROP(
                s,
                1
            ),
            "x"
        ),
        f
    ),
    k,
    FILTER(
        o,
        q(
            o,
            1
        )="x"
    ),
    as(
        SEQUENCE(
            ROWS(
                k
            )
        ),
        q(
            k,
            -1
        )
    ))
Excel solution 4 for Custom Grouping! Part 19, proposed by Hussein SATOUR:
=LET(
    a,
    IFERROR(
        B3:B19-B2:B18-1,
        0
    ),
    b,
    SCAN(
        ,
        IF(
            a>2,
            2,
            a
        ),
        SUM
    ),
    c,
    SEQUENCE(
        MAX(
            b
        ),
        ,
        0,
        2
    ),
    d,
    GROUPBY(
        XLOOKUP(
            b,
            c,
            c,
            ,
            -1
        ),
        C3:C19,
        SUM,
        ,
        0
    ),
    HSTACK(
        SEQUENCE(
            ROWS(
                d
            )
        ),
        TAKE(
            d,
            ,
            -1
        )
    )
)
Excel solution 5 for Custom Grouping! Part 19, proposed by Pieter de B.:
=LET(
    b,
    B3:B19,
    s,
    SCAN(
        ,
        ABS(
            B4:B20-b-1
        ),
        SUM
    ),
    L,
    LAMBDA(
        z,
        XLOOKUP(
            TRUE,
            s>=z,
            s
        )
    ),
    g,
    TOCOL(
        SCAN(
            L(
                0
            ),
            B3:B19,
            LAMBDA(
                x,
                _,
                L(
                    x+2
                )
            )
        ),
        2
    ),
    GROUPBY(
        XMATCH(
            b,
            XLOOKUP(
                g,
                s,
                b
            ),
            1
        ),
        C3:C19,
        SUM,
        ,
        0
    )
)
Excel solution 6 for Custom Grouping! Part 19, proposed by Rayan Saud:
=LET(
    max,
    MAX(
        B3:B19
    ),
    min,
    MIN(
        B3:B19
    ),
    s,
    SEQUENCE(
        max-min+1,
        ,
        min,
        1
    ),
    n,
    SUMIF(
        B3:B19,
        s,
        C3:C19
    ),
    j,
    IF(
        n=0,
        "x",
        n
    ),
    sales,
    BYROW(
        WRAPROWS(
            MAP(
                TEXTSPLIT(
                    TEXTJOIN(
                        ",",
                        ,
                        j
                    ),
                    ,
                    "x"
                ),
                LAMBDA(
                    x,
                    SUM(
                        IFERROR(
                            TEXTSPLIT(
                                x,
                                ","
                            )+0,
                            0
                        )
                    )
                )
            ),
            2
        ),
        SUM
    ),
    HSTACK(
        SEQUENCE(
            COUNTA(
                sales
            )
        ),
        sales
    )
)
Solving the challenge of Custom Grouping! Part 19 with Python
Python solution 1 for Custom Grouping! Part 19, proposed by Konrad Gryczan, PhD:
import pandas as pd
import numpy as np

path = "CH-197 Custom Grouping.xlsx"
input = pd.read_excel(path, usecols="B:C", skiprows=1, nrows=17)
test = pd.read_excel(path, usecols="G:H", skiprows=1, nrows=6)

input['Date'] = pd.to_datetime(input['Date'], format='%Y-%m-%d')
input = input.set_index('Date').reindex(pd.date_range(input['Date'].min(), input['Date'].max(), freq='D')).fillna(0).rename_axis('Date').reset_index()

input['Group'] = np.where(input['Sales'] == 0, (input['Sales'] == 0).cumsum() % 2, np.nan)
input['Group'] = input.groupby('Group').cumcount() + 1
input['Group'] = input['Group'].replace(0, np.nan).fillna(method='bfill').fillna(input['Group'].max() + 1)

result = input.groupby('Group').agg({'Sales': 'sum'}).reset_index().rename(columns={'Sales': 'Total Sales'})

#    Group  Total Sales
# 0    1.0        137.0
# 1    2.0         27.0
# 2    3.0         89.0
# 3    4.0         51.0
# 4    5.0         53.0
# 5    6.0          0.0
# 6    7.0         23.0
Solving the challenge of Custom Grouping! Part 19 with Python in Excel
Python in Excel solution 1 for Custom Grouping! Part 19, proposed by Alejandro Campos:
df = xl("B2:C19", headers=True)
df["Group"] = (pd.to_datetime(df["Date"].replace({"ene": "01"}, regex=True), format="%d/%m/%Y", dayfirst=True)
 .diff().dt.days.ne(1)).cumsum().replace({2: 1, 4: 4, 5: 4, 6: 4})
df["Group"] = df["Group"].rank(method="dense").astype(int)
df.groupby("Group", as_index=False)["Sales"].sum()
Solving the challenge of Custom Grouping! Part 19 with R
R solution 1 for Custom Grouping! Part 19, proposed by Konrad Gryczan, PhD:
library(tidyverse)
library(readxl)

path = "files/CH-197 Custom Grouping.xlsx"
input = read_excel(path, range = "B2:C19")
test = read_excel(path, range = "G2:H7")

result = input %>%
 mutate(Date = as.Date(Date, format = "%Y-%m-%d")) %>%
 complete(Date = seq.Date(min(Date), max(Date), by = "day")) %>%
 replace_na(list(Sales = 0)) %>%
 mutate(group_ends = ifelse(Sales == 0, cumsum(Sales == 0) %% 2, NA)) %>%
 group_by(group_ends) %>%
 mutate(Group = cumsum(group_ends == 0)) %>%
 ungroup() %>%
 mutate(Group = ifelse(Group == 0, NA, Group)) %>%
 fill(Group, .direction = "up") %>%
 mutate(Group = ifelse(is.na(Group), max(Group, na.rm = TRUE) + 1, Group)) %>%
 summarise(`Total Sales` = sum(Sales, na.rm = TRUE), .by = Group)

# # A tibble: 6 × 2
# Group `Total Sales`
#
# 1   1      137
# 2   2      27
# 3   3      89
# 4   4      51
# 5   5      53
# 6   6      23
Solving the challenge of Custom Grouping! Part 19 with Google Sheets
Google Sheets solution 1 for Custom Grouping! Part 19, proposed by Peter Krkos:
PowerQuery solution:
https://docs.google.com/spreadsheets/d/1zR5IZLz8OT76vhaPEHfsPrw8-RDKnLyyqS49IJjdhFk/edit?pli=1&gid=1006984037#gid=1006984037