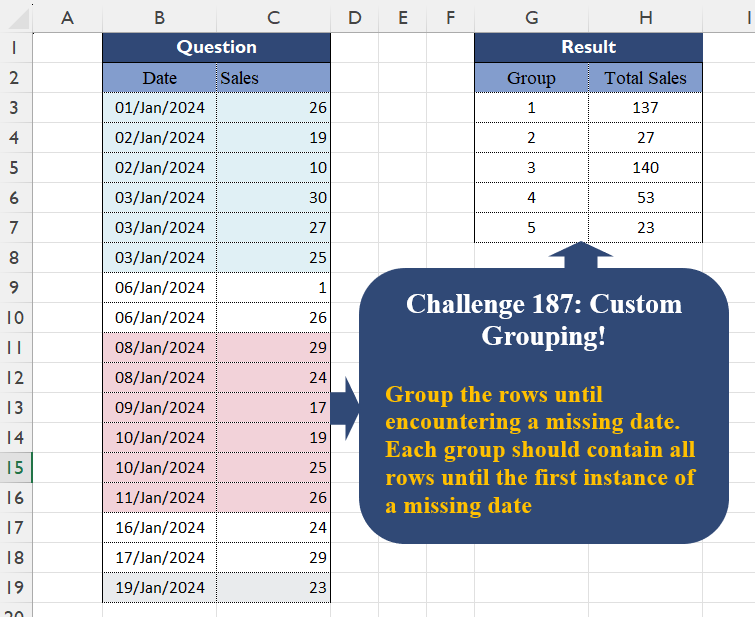
Group the rows until encountering a missing date. Each group should contain all rows until the first instance of a missing date
📌 Challenge Details and Links
Challenge Number: 187
Challenge Difficulty: ⭐⭐⭐
📥Download Sample File
📥Link to the solutions on LinkedIn
Solving the challenge of Custom Grouping! Part 17 with Power Query
Power Query solution 1 for Custom Grouping! Part 17, proposed by Zoran Milokanović:
let
  Source = Excel.CurrentWorkbook(){[Name = "Input"]}[Content],
  G = Table.ToRows(
    Table.Group(
      Source,
      "Date",
      {"_", each [Sales]},
      0,
      (b, n) =>
        let
          d = Source[Date],
          p = each List.PositionOf(d, _)
        in
          Byte.From(
            Number.From(n - b) <> List.Count(List.Distinct(List.Range(d, p(b), p(n) - p(b))))
          )
    )
  ),
  _ = Table.FromRows(
    List.TransformMany(G, each {List.PositionOf(G, _) + 1}, (i, _) => {_, List.Sum(i{1})}),
    {"Group", "Total Sales"}
  )
in
  _
Power Query solution 2 for Custom Grouping! Part 17, proposed by Brian Julius:
let
  Source = Excel.CurrentWorkbook(){[Name = "Table1"]}[Content],
  ReType = Table.TransformColumnTypes(Source, {"Date", type date}),
  AddIdx = Table.AddIndexColumn(ReType, "Index"),
  AddPrev = Table.AddColumn(
    AddIdx,
    "PrevDate",
    each if [Index] = 0 then [Date] else ReType[Date]{[Index] - 1},
    type date
  ),
  AddDeviate = Table.FillDown(
    Table.AddColumn(
      AddPrev,
      "Deviate",
      each
        if [Index] = 0 then
          1
        else if Number.From([Date]) - 1 <= Number.From([PrevDate]) then
          null
        else
          [Index]
    ),
    {"Deviate"}
  ),
  GroupTotal = Table.Group(
    AddDeviate,
    {"Deviate"},
    {{"Total Sales", each List.Sum([Sales]), type number}}
  ),
  AddGpNum = Table.SelectColumns(
    Table.AddIndexColumn(GroupTotal, "Group", 1, 1, Int64.Type),
    {"Group", "Total Sales"}
  )
in
  AddGpNum
Power Query solution 3 for Custom Grouping! Part 17, proposed by Alejandro Simón 🇵🇦 🇪🇸:
let
Source = Excel.CurrentWorkbook(){[Name="Table1"]}[Content],
Idx = Table.AddIndexColumn(Source, "Idx", 0),
Grp = Table.Group(Idx, "Idx", {{"A", each
 let
 a = _,
 b = List.Sum([Sales])
 in b}},0,
 (x,y)=> Number.From(Number.From(Idx[Date]{y}-Idx[Date]{y-1})>1)),
Sol = Table.FromColumns({{1..List.Count(Grp[A])},Grp[A]},{"Group", "Total Sales"})
in
Sol
Power Query solution 4 for Custom Grouping! Part 17, proposed by Krzysztof Kominiak:
let
  Source = Excel.CurrentWorkbook(){[Name = "Table1"]}[Content],
  Base = Table.TransformColumns(Source, {"Date", Number.From}),
  Diff = Table.FromColumns(
    Table.ToColumns(Base)
      & {
        List.Accumulate(
          {0 .. List.Count(Base[Date]) - 1},
          {},
          (s, c) => s & {try Base[Date]{c} - Base[Date]{c - 1} otherwise 0}
        )
      },
    Table.ColumnNames(Source) & {"Diff"}
  ),
  Sum = Table.Group(
    Diff,
    "Diff",
    {{"Total Sales", each List.Sum([Sales])}},
    0,
    (x, y) => Byte.From(y > 1)
  ),
  Result = Table.AddIndexColumn(Sum, "Group", 1, 1)[[Group], [Total Sales]]
in
  Result
Power Query solution 5 for Custom Grouping! Part 17, proposed by Kris Jaganah:
let
  A = Excel.CurrentWorkbook(){[Name = "Table1"]}[Content],
  B = Table.ToRows(A),
  C = List.Generate(
    () => [a = 0, b = B{a}{0}, c = 1, d = B{a}{1}],
    each [a] < List.Count(B),
    each [
      a = [a] + 1,
      b = B{a}{0},
      c = if Number.From(b - [b]) > 1 then [c] + 1 else [c],
      d = B{a}{1}
    ],
    each {[c], [d]}
  ),
  D = List.Transform(
    List.Distinct(List.Zip(C){0}),
    (v) => {v, List.Sum(List.Zip(List.Select(C, each _{0} = v)){1})}
  ),
  E = Table.FromRows(D, {"Group", "Total Sales"})
in
  E
Power Query solution 6 for Custom Grouping! Part 17, proposed by Abdallah Ally:
let
  Source = Excel.CurrentWorkbook(){[Name = "Table1"]}[Content],
  AddCol = Table.AddColumn(
    Source,
    "Data",
    each [
      a = Table.PositionOf(Source, _),
      b = if a = 0 or Date.AddDays(Source[Date]{a - 1}, 1) < Source[Date]{a} then 1 else 0
    ][b]
  ),
  Group = Table.Group(AddCol, "Data", {"Total Sales", each List.Sum([Sales])}, 0, (x, y) => y),
  Result = Table.AddIndexColumn(Group, "Group", 1)[[Group], [Total Sales]]
in
  Result
Power Query solution 7 for Custom Grouping! Part 17, proposed by Kris Jaganah:
let
  A = Excel.CurrentWorkbook(){[Name = "Table1"]}[Content],
  B = Table.TransformColumnTypes(A, {{"Date", Int64.Type}}),
  C = Table.Group(B, "Date", {"Sum", each List.Sum([Sales])}),
  D = Table.Group(
    C,
    "Date",
    {"Total Sales", each List.Sum([Sum])},
    0,
    (x, y) => Number.From(y - 1 <> List.Last(List.Select(C[Date], (v) => v < y), y + 1))
  ),
  E = Table.AddIndexColumn(D, "Group", 1)[[Group], [Total Sales]]
in
  E
Power Query solution 8 for Custom Grouping! Part 17, proposed by CA Raghunath Gundi:
let
  Source = Excel.CurrentWorkbook(){[Name = "Table1"]}[Content],
  Grp1 = Table.Group(Source, {"Date"}, {{"Sum", each List.Sum([Sales]), type number}}),
  Ind = Table.AddIndexColumn(Grp1, "Index", 0, 1, Int64.Type),
  PrevDay = Table.AddColumn(Ind, "PrevDay", each ({null} & Ind[Date]){[Index]}),
  Gap = Table.FillUp(
    Table.AddColumn(PrevDay, "Gap", each Duration.Days([Date] - [PrevDay]) - 1, Int64.Type),
    {"Gap"}
  ),
  Replace = Table.ReplaceValue(Gap, 0, 1, Replacer.ReplaceValue, {"Gap"}),
  Grp2 = Table.Group(Replace, {"Gap"}, {{"Total Sales", each List.Sum([Sum]), type number}}, 0),
  #"Added Index" = Table.SelectColumns(
    Table.AddIndexColumn(Grp2, "Group", 1, 1, Int64.Type),
    {"Group", "Total Sales"}
  )
in
  #"Added Index"
Power Query solution 9 for Custom Grouping! Part 17, proposed by Meganathan Elumalai:
let
  Source = Excel.CurrentWorkbook(){[Name = "Table1"]}[Content],
  Result = Table.Group(
    Table.FromColumns(
      {
        [
          Lst = List.Skip(Source[Date]),
          fin = List.Accumulate(
            List.Positions(Lst),
            {1},
            (s, c) =>
              s
                & {
                  if Duration.Days(Lst{c} - Source[Date]{c}) <= 1 then
                    List.Max(s)
                  else
                    List.Max(s) + 1
                }
          )
        ][fin]
      }
        & {Source[Sales]},
      {"Group", "Sales"}
    ),
    "Group",
    {{"Total sales", each List.Sum([Sales])}}
  )
in
  Result
Power Query solution 10 for Custom Grouping! Part 17, proposed by Seokho MOON:
let
  Source = Excel.CurrentWorkbook(){[Name = "Table1"]}[Content],
  Rows = Table.ToRows(Source),
  Recs = List.Accumulate(
    List.Skip(Rows),
    {[Date = Rows{0}{0}, Group = 1, Total Sales = Rows{0}{1}]},
    (a, v) =>
      if v{0} > Date.AddDays(List.Last(a)[Date], 1) then
        a & {[Date = v{0}, Group = List.Last(a)[Group] + 1, Total Sales = v{1}]}
      else
        List.RemoveLastN(a)
          & {
            [
              Date        = v{0},
              Group       = List.Last(a)[Group],
              Total Sales = List.Last(a)[Total Sales] + v{1}
            ]
          }
  ),
  Res = Table.FromRecords(Recs)[[Group], [Total Sales]]
in
  Res
Power Query solution 11 for Custom Grouping! Part 17, proposed by Seokho MOON:
let
  Source = Excel.CurrentWorkbook(){[Name = "Table1"]}[Content],
  AddIdx = Table.AddIndexColumn(Source, "Idx", - 1),
  Group = Table.Group(
    AddIdx,
    {"Date", "Idx"},
    {"Total Sales", each List.Sum([Sales])},
    0,
    (x, y) => Number.From(y[Date] > Date.AddDays(AddIdx[Date]{y[Idx]}, 1))
  ),
  Res = Table.AddIndexColumn(Group, "Group", 1)[[Group], [Total Sales]]
in
  Res
Power Query solution 12 for Custom Grouping! Part 17, proposed by Alexandre Garcia:
let
H = Excel.CurrentWorkbook(){[Name="Table1"]}[Content],
P = List.Generate( ()=> [a = 0, b = H[Date]{0}, c = 1], each [a] < List.Count(H[Date]), each [ a = [a] + 1, b = Number.From(H[Date]{a}) - Number.From(H[Date]{[a]}) > 1, c = if b then [c] + 1 else [c]], each [c]),
L = Table.FromColumns({P} & List.Skip (Table.ToColumns(H)), {"Group","x"}),
C = Table.Group(L, "Group", {"Total Sales", each List.Sum([x])})
in C
Power Query solution 13 for Custom Grouping! Part 17, proposed by Vida Vaitkunaite:
let
  Source = Excel.CurrentWorkbook(){[Name = "Table1"]}[Content],
  Custom = Table.FromColumns(
    {Source[Date], Source[Sales], {null} & List.RemoveLastN(Source[Date], 1)},
    {"Date", "Sales", "Prev"}
  ),
  Diff = Table.AddColumn(Custom, "Days", each Duration.Days([Date] - [Prev])),
  Group = Table.Group(
    Diff,
    "Days",
    {{"Total Sales", each List.Sum([Sales])}},
    0,
    (x, y) => Number.From(y > 1)
  ),
  Final = Table.AddIndexColumn(Group, "Group", 1, 1)[[Group], [Total Sales]]
in
  Final
Solving the challenge of Custom Grouping! Part 17 with Excel
Excel solution 1 for Custom Grouping! Part 17, proposed by 🇰🇷 Taeyong Shin:
=LET(
    d,
    N(
        +B:.B
    ),
    g,
    GROUPBY(
        SCAN(
            0,
            DROP(
                d,
                1
            )-DROP(
                d,
                -1
            )>1,
            SUM
        ),
        N(
            +DROP(
                C:.C,
                1
            )
        ),
        SUM,
        ,
        0
    ),
    IF(
        g,
        g,
        {"Group",
        "TotalSales"}
    )
)
Excel solution 2 for Custom Grouping! Part 17, proposed by Oscar Mendez Roca Farell:
=GROUPBY(
    SCAN(
        0,
        B3:B19-N(
            +B2:B18
        )>1,
        SUM
    ),
    C3:C19,
    SUM,
    ,
    0
)
Excel solution 3 for Custom Grouping! Part 17, proposed by Kris Jaganah:
=GROUPBY(SCAN(,
    N((B3:B19-VSTACK(
        0,
        DROP(
            B3:B19,
            -1
        )
    ))>1),
    SUM),
    C3:C19,
    SUM,
    ,
    0)
Excel solution 4 for Custom Grouping! Part 17, proposed by Imam Hambali:
=LET(    ud,
     UNIQUE(
         B3:B19
     ),    d,
     ud-VSTACK(
         0,
         DROP(
             ud,
             -1
         )
     ),    g,
     SCAN(
         0,
          IF(
              d>1,
              1,
              0
          ),
         SUM
     ),    VSTACK(
        {"Group",
        "Total Sales"},
         GROUPBY(
             XLOOKUP(
                 B3:B19,
                 ud,
                 g
             ),
             C3:C19,
             SUM,
             0,
             0
         )
    ))
Excel solution 5 for Custom Grouping! Part 17, proposed by Ivan William:
=LET(
    d,
    B3:B19,
    GROUPBY(
        XMATCH(
            d,
            UNIQUE(
                TOCOL(
                    d/ISNA(
                        XMATCH(
                            d,
                            d+1
                        )
                    ),
                    2
                )
            ),
            -1
        ),
        C3:C19,
        SUM,
        ,
        0
    )
)
Excel solution 6 for Custom Grouping! Part 17, proposed by Sunny Baggu:
=LET(
 _a,
     SCAN(          1,          N(
              VSTACK(
                  1,
                   B4:B19 - B3:B18
              ) > 1
          ),          LAMBDA(
              a,
               v,
               a + v
          )     ), _g,
     UNIQUE(
         _a
     ), _s,
     MAP(_g,
     LAMBDA(a,
     SUM(C3:C19 * (_a = a)))), HSTACK(
     _g,
      _s
 )
)
Excel solution 7 for Custom Grouping! Part 17, proposed by Bilal Mahmoud kh.:
=LET(a,
    DROP(REDUCE(,
    DAY(
        B3:B19
    ),
    LAMBDA(x,
    y,
    LET(n,
    IF(
        COUNT(
            x
        )>1,
        DROP(
            x,
            -1
        ),
        x
    ),
    m,
    INDEX(
        x,
        COUNT(
            x
        ),
        1
    ),
    i,
    INDEX(
        n,
        COUNT(
            n
        ),
        1
    ),
    IF((y-m)>1,
    VSTACK(
        n,
        i+1,
        y
    ),
    VSTACK(
        n,
        i,
        y
    ))))),
    -1),
    REDUCE(
        {"Group",
        "Total sales"},
        UNIQUE(
            a
        ),
        LAMBDA(
            v,
            w,
            VSTACK(
                v,
                HSTACK(
                    w,
                    SUM(
                        FILTER(
                            C3:C19,
                            a=w
                        )
                    )
                )
            )
        )
    ))
Excel solution 8 for Custom Grouping! Part 17, proposed by ferhat CK:
=LET(b,
    SCAN(1,
    VSTACK(
        B3,
        B3:B18
    )-B3:B19,
    LAMBDA(a,
    v,
    IF((v=0)+(v=-1),
    a,
    a+1))),
    GROUPBY(
        VSTACK(
            "Group",
            b
        ),
        VSTACK(
            "Total Sales",
            C3:C19
        ),
        SUM,
        3,
        0
    ))
Excel solution 9 for Custom Grouping! Part 17, proposed by Hamidi Hamid:
=LET(j,DAY(B3:B19),jd,VSTACK(DROP(j,1),0),w,j-jd,k,IF(w<-1,w,""),g,TOCOL(HSTACK(C3:C19,IF(k="",1/0,"")),3),z,GROUPBY(" "&SCAN(1,g="",SUM),g,SUM,0,0),z)Excel solution 10 for Custom Grouping! Part 17, proposed by Henk-Jan van Well:
= LET(
 d,
     tData[Date], g,
     VSTACK(0,
    SCAN(0,
    (DROP(
        d,
        1
    )-DROP(
        d,
        -1
    ))>1,
    LAMBDA(
        a,
        b,
        a+b
    ))), u,
     UNIQUE(
         g
     ), HSTACK(
     u,
     MMULT(
         N(
             u=TRANSPOSE(
         g
     )
         ),
         tData[Sales]
     )
 )
 )
Excel solution 11 for Custom Grouping! Part 17, proposed by Hussein SATOUR:
=LET(
    d,
    B3:B19,
    GROUPBY(
        SCAN(
            0,
            d-VSTACK(
                0,
                DROP(
                    d,
                    -1
                )
            )>1,
            SUM
        ),
        C3:C19,
        SUM
    )
)
Excel solution 12 for Custom Grouping! Part 17, proposed by Md. Zohurul Islam:
=LET(
    u,
    B3:B19,
    v,
    C3:C19,    hdr,
    HSTACK(
        "Group",
        "Total Sales"
    ),    a,
    DROP(
        u,
        1
    )-DROP(
        u,
        -1
    ),    b,
    IF(
        a<=1,
        0,
        1
    ),    c,
    SCAN(
        0,
        VSTACK(
            1,
            b
        ),
        SUM
    ),    d,
    GROUPBY(
        c,
        v,
        SUM,
        0,
        0
    ),    e,
    VSTACK(
        hdr,
        d
    ),    e
)
Excel solution 13 for Custom Grouping! Part 17, proposed by Meganathan Elumalai:
=LET(
    dt,
    B3:B19,
    GROUPBY(
        VSTACK(
            "Group",
            REDUCE(
                1,
                DROP(
                    dt,
                    1
                )-DROP(
                    dt,
                    -1
                )<=1,
                LAMBDA(
                    a,
                    v,
                    VSTACK(
                        a,
                        IF(
                            v,
                            MAX(
                                a
                            ),
                            MAX(
                                a
                            )+1
                        )
                    )
                )
            )
        ),
        C2:C19,
        SUM,
        3,
        0
    )
)
Excel solution 14 for Custom Grouping! Part 17, proposed by Nicolas Micot:
=LET(_groups;
    ASSEMB.V(
        1;
        SCAN(
            1;
            B4:B19-B3:B18;
            LAMBDA(
                l_valeurInit;
                l_difDates;
                l_valeurInit+SI(
                    l_difDates>1;
                    1;
                    0
                )
            )
        )
    );_uniqueGroups;
    UNIQUE(
        _groups
    );_totalSalesByGroup;
    MAP(_uniqueGroups;
    LAMBDA(l_group;
    SOMME(C3:C19*(_groups=l_group))));ASSEMB.H(
    _uniqueGroups;
    _totalSalesByGroup
))
Excel solution 15 for Custom Grouping! Part 17, proposed by Pieter de B.:
=GROUPBY(
    SCAN(
        1,
        B3:B19,
        LAMBDA(
            a,
            b,
            IF(
                b>@+TAKE(
                    B3:b,
                    -2
                )+1,
                a+1,
                a
            )
        )
    ),
    C3:C19,
    SUM,
    ,
    0
)
Solving the challenge of Custom Grouping! Part 17 with Python
Python solution 1 for Custom Grouping! Part 17, proposed by Konrad Gryczan, PhD:
import pandas as pd

path = "CH-187 Custom Grouping.xlsx"
input = pd.read_excel(path, usecols="B:C", skiprows=1, nrows=17)
test = pd.read_excel(path, usecols="G:H", skiprows=1, nrows=5).astype('int32')

input['Group'] = (input['Date'].diff().dt.days.fillna(0).astype(int) > 1).cumsum() + 1
result = input.groupby('Group', as_index=False)['Sales'].sum().rename(columns={'Sales': 'Total Sales'}).astype({'Total Sales': 'int32'})

print(result.equals(test)) # True
Python solution 2 for Custom Grouping! Part 17, proposed by Abdallah Ally:
import pandas as pd
from datetime import timedelta

# Load the Excel file
file_path = 'CH-187 Custom Grouping.xlsx'
df = pd.read_excel(io=file_path, usecols='B:C', skiprows=1)

# Perform data transformation
df['Group'] = (
 df['Date'] > df['Date'].shift(1).map(lambda x: x + timedelta(days=1))
).cumsum() + 1

df = (
 df
 .groupby('Group')['Sales'].sum()
 .reset_index()
 .rename(columns={'Sales': 'Total Sales'})
)

# Display the final results
df
Solving the challenge of Custom Grouping! Part 17 with Python in Excel
Python in Excel solution 1 for Custom Grouping! Part 17, proposed by Alejandro Campos:
df = xl("B2:C19", headers=True)
df['Date'] = pd.to_datetime(df["Date"], format="%d/%m/%Y")
df["Group"] = (df["Date"].diff().dt.days > 1).cumsum() + 1
df = df.groupby("Group")["Sales"].sum().reset_index(name="Total Sales")
Solving the challenge of Custom Grouping! Part 17 with R
R solution 1 for Custom Grouping! Part 17, proposed by Konrad Gryczan, PhD:
library(tidyverse)
library(readxl)

path = "files/CH-187 Custom Grouping.xlsx"
input = read_excel(path, range = "B2:C19")
test = read_excel(path, range = "G2:H7")

result = input %>%
 mutate(diff = difftime(lead(Date), Date, units = "days") %>% as.numeric()) %>%
 mutate(Group = cumsum(lag(diff, default = 0) > 1) + 1) %>%
 summarise(`Total Sales` = sum(Sales, na.rm = T), .by = Group)

all.equal(result, test)
#> [1] TRUE
Solving the challenge of Custom Grouping! Part 17 with Google Sheets
Google Sheets solution 1 for Custom Grouping! Part 17, proposed by Peter Krkos:
PowerQuery solution:
https://docs.google.com/spreadsheets/d/1zR5IZLz8OT76vhaPEHfsPrw8-RDKnLyyqS49IJjdhFk/edit?pli=1&gid=2008052562#gid=2008052562