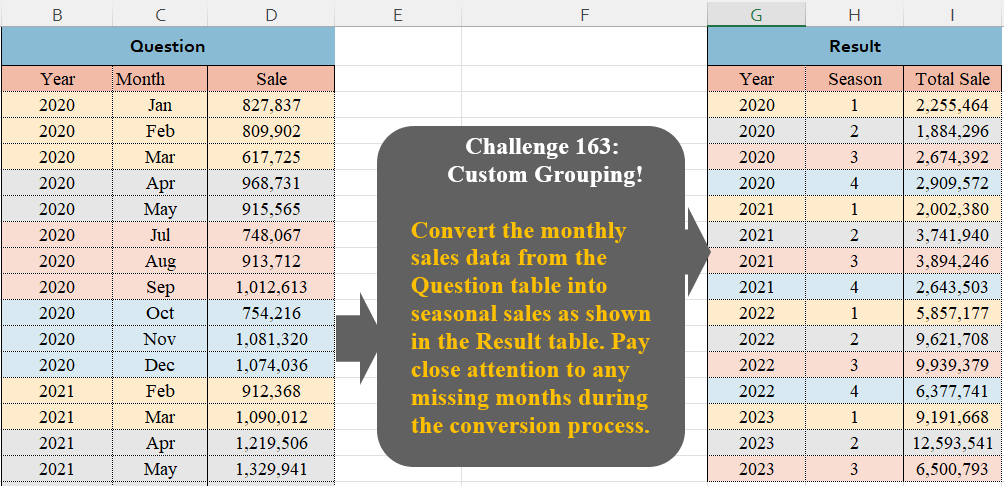
Convert the monthly sales data from the Question table into seasonal sales as shown in the Result table. Pay close attention to any missing months during the conversion process.
📌 Challenge Details and Links
Challenge Number: 163
Challenge Difficulty: ⭐⭐
📥Download Sample File
📥Link to the solutions on LinkedIn
Solving the challenge of Custom Grouping! Part 12 with Power Query
Power Query solution 1 for Custom Grouping! Part 12, proposed by Brian Julius:
let
  Source = Excel.CurrentWorkbook(){[Name = "Table1"]}[Content],
  AddSeason = Table.AddColumn(
    Source,
    "Season",
    each Date.QuarterOfYear(Date.FromText("1 " & [Month] & " " & Text.From([Year])))
  ),
  Group = Table.Group(AddSeason, {"Year", "Season"}, {{"Total Sale", each List.Sum([Sale])}})
in
  Group
Power Query solution 2 for Custom Grouping! Part 12, proposed by Alejandro Simón 🇵🇦 🇪🇸:
let
Source = Excel.CurrentWorkbook(){[Name="Table1"]}[Content],
Q = Table.AddColumn(Source, "Season", each Date.QuarterOfYear(Date.From(Text.From([Year])&[Month]))),
Sol = Table.Group(Q, {"Year", "Season"}, {{"Total Sale", each List.Sum([Sale])}})
in
Sol
Power Query solution 3 for Custom Grouping! Part 12, proposed by Alejandro Simón 🇵🇦 🇪🇸:
let
Source = Excel.CurrentWorkbook(){[Name="Table1"]}[Content],
Q = List.Transform({1..12}, each {Date.ToText(
hashtag
#date(2024, _, 1), "MMM", "en-US"),
 Date.QuarterOfYear(
hashtag
#date(2024, _, 1))}),
Replace = Table.TransformColumns(Source, {"Month", each List.Select(Q, (x)=> x{0} = _){0}{1}}),
Sol = Table.Group(Replace, {"Year", "Month"}, {{"A", each List.Sum([Sale])}})
in
Sol
Power Query solution 4 for Custom Grouping! Part 12, proposed by Krzysztof Kominiak:
let
  Source = Excel.CurrentWorkbook(){[Name = "Tabela1"]}[Content],
  AddSeason = Table.AddColumn(
    Source,
    "Season",
    each Date.QuarterOfYear(Date.From(Text.From([Year]) & "-" & [Month] & "-" & "1"))
  ),
  Result = Table.Group(AddSeason, {"Year", "Season"}, {{"Sum", each List.Sum([Sale]), type number}})
in
  Result
Power Query solution 5 for Custom Grouping! Part 12, proposed by Kris Jaganah:
let
  A = Excel.CurrentWorkbook(){[Name = "Table1"]}[Content],
  B = Table.AddColumn(A, "Season", each Date.QuarterOfYear(Date.From([Month] & Text.From([Year])))),
  C = Table.Group(B, {"Year", "Season"}, {"Total Sale", each List.Sum([Sale])})
in
  C
Power Query solution 6 for Custom Grouping! Part 12, proposed by Yaroslav Drohomyretskyi:
let
  Source = Excel.CurrentWorkbook(){[Name = "Table1"]}[Content],
  Season = Table.AddColumn(
    Source,
    "Season",
    each Date.QuarterOfYear(Date.From([Month] & "-" & Text.From([Year])))
  ),
  Group = Table.Group(
    Season,
    {"Year", "Season"},
    {{"Total Sales", each List.Sum([Sale]), type number}}
  )
in
  Group
Power Query solution 7 for Custom Grouping! Part 12, proposed by 🇮🇷 Navid Esmaeilzadeh اسماعیل زاده:
let
S = Excel.CurrentWorkbook(){[Name="Table1"]}[Content],
A = Table.AddColumn(S, "Season", each Date.QuarterOfYear(Date.FromText(Text.From([Year])&"/"&[Month]&"/"&"01",[Format="yyyy/MMM/dd"]))),
B = Table.Group(A, {"Year", "Season"}, {{"Total Sales", each List.Sum([Sale]), type number}})
in
B
Power Query solution 8 for Custom Grouping! Part 12, proposed by CA Raghunath Gundi:
let
  Source = Excel.CurrentWorkbook(){[Name = "Table1"]}[Content],
  Date = Table.AddColumn(
    Source,
    "Date",
    each Date.From([Month] & "," & Text.From([Year])),
    type date
  ),
  Season = Table.AddColumn(Date, "Season", each Date.QuarterOfYear([Date]), Int64.Type),
  Group = Table.Group(Season, {"Year", "Season"}, {{"Sales", each List.Sum([Sale]), type number}})
in
  Group
Power Query solution 9 for Custom Grouping! Part 12, proposed by Md. Zohurul Islam:
let
  Source = Excel.CurrentWorkbook(){[Name = "Table1"]}[Content],
  a = Table.AddColumn(
    Source,
    "Merged",
    each Text.Combine({Text.From([Year], "en-US"), "-", [Month], "-1"}),
    type text
  ),
  b = Table.RenameColumns(a, {{"Merged", "Season"}}),
  c = Table.TransformColumnTypes(b, {{"Season", type date}}),
  d = Table.TransformColumns(c, {{"Season", Date.QuarterOfYear, Int64.Type}}),
  e = Table.RemoveColumns(d, {"Month"}),
  f = Table.ReorderColumns(e, {"Year", "Season", "Sale"}),
  result = Table.Group(f, {"Year", "Season"}, {{"Total Sales", each List.Sum([Sale]), type number}})
in
  result
Power Query solution 10 for Custom Grouping! Part 12, proposed by Meganathan Elumalai:
let
  Source = Excel.CurrentWorkbook(){[Name = "Table2"]}[Content],
  Transform = Table.TransformColumns(
    Source,
    {{"Month", (f) => Date.QuarterOfYear(Date.FromText(f & "01"))}}
  ),
  Result = Table.Group(Transform, {"Year", "Month"}, {{"Sum of Sales", each List.Sum(_[Sale])}})
in
  Result
Power Query solution 11 for Custom Grouping! Part 12, proposed by Meganathan Elumalai:
let
  Source = Excel.CurrentWorkbook(){[Name = "Table2"]}[Content],
  Transform = Table.ReplaceValue(
    Source,
    each [Month],
    each [Year],
    (x, y, z) => Date.QuarterOfYear(Date.From(y & Text.From(z))),
    {"Month"}
  ),
  Result = Table.Group(Transform, {"Year", "Month"}, {{"Sum of Sales", each List.Sum(_[Sale])}})
in
  Result
Power Query solution 12 for Custom Grouping! Part 12, proposed by Seokho MOON:
let
  Source = Excel.CurrentWorkbook(){[Name = "Table1"]}[Content],
  Season = Table.AddColumn(Source, "Season", each Date.QuarterOfYear(Date.From([Month] & "1"))),
  Res    = Table.Group(Season, {"Year", "Season"}, {"Total Sale", each List.Sum([Sale])})
in
  Res
Power Query solution 13 for Custom Grouping! Part 12, proposed by Glyn Willis:
let
  m = List.Buffer(
    {"Jan", "Feb", "Mar", "Apr", "May", "Jun", "Jul", "Aug", "Sep", "Oct", "Nov", "Dec"}
  ),
  Source = Excel.CurrentWorkbook(){[Name = "Table1"]}[Content],
  #"Changed Type" = Table.TransformColumnTypes(
    Source,
    {{"Year", Int64.Type}, {"Month", type text}, {"Sale", Int64.Type}}
  ),
  #"Grouped Rows" = Table.Group(
    #"Changed Type",
    {"Year", "Month"},
    {
      {
        "Season",
        each Number.IntegerDivide(List.PositionOf(m, List.First([Month])), 3) + 1,
        Int64.Type
      },
      {"Total Sale", each List.Sum([Sale]), type number}
    },
    GroupKind.Local,
    (currentGroup, nextItem) =>
      Number.From(
        not (
          currentGroup[Year]
            * 4 + Number.IntegerDivide(List.PositionOf(m, currentGroup[Month]), 3) = nextItem[Year]
            * 4 + Number.IntegerDivide(List.PositionOf(m, nextItem[Month]), 3)
        )
      )
  )[[Year], [Season], [Total Sale]]
in
  #"Grouped Rows"
Power Query solution 14 for Custom Grouping! Part 12, proposed by Vida Vaitkunaite:
let
  Source = Excel.CurrentWorkbook(){[Name = "Table1"]}[Content],
  Custom = Table.AddColumn(
    Source,
    "Season",
    each Number.RoundUp(Date.Month(Date.FromText("1/" & [Month] & "/" & Text.From([Year]))) / 3)
  ),
  Groups = Table.Group(
    Custom,
    {"Year", "Season"},
    {{"Total Sale", each List.Sum([Sale]), type number}}
  )
in
  Groups
Solving the challenge of Custom Grouping! Part 12 with Excel
Excel solution 1 for Custom Grouping! Part 12, proposed by Oscar Mendez Roca Farell:
=GROUPBY(
    HSTACK(
        B3:B39,
        MONTH(
            10*MONTH(
                C3:C39&1
            )
        )
    ),
    D3:D39,
    SUM,
    ,
    0
)
Excel solution 2 for Custom Grouping! Part 12, proposed by Julian Poeltl:
=LET(Y,
    B3:B39,
    M,
    C3:C39,
    S,
    D3:D39,
    Q,
    MONTH(10*MONTH(("01."&M)*1)),
    C,
    Y&"|"&Q,
    U,
    UNIQUE(
        C
    ),
    REDUCE(
        HSTACK(
            "Year",
            "Season",
            "Total Sale"
        ),
        U,
        LAMBDA(
            A,
            B,
            VSTACK(
                A,
                HSTACK(
                    --TEXTSPLIT(
                        B,
                        "|"
                    ),
                    SUM(
                        FILTER(
                            S,
                            C=B
                        )
                    )
                )
            )
        )
    ))
Excel solution 3 for Custom Grouping! Part 12, proposed by Kris Jaganah:
=VSTACK(
    {"Year",
    "Season",
    "Total Sale"},
    GROUPBY(
        HSTACK(
            B3:B39,
            INT(
                MONTH(
                    --1&C3:C39&B3:B39
                )/3.01
            )+1
        ),
        D3:D39,
        SUM,
        ,
        0
    )
)
Excel solution 4 for Custom Grouping! Part 12, proposed by Imam Hambali:
=VSTACK(
    {"Year",
    "Season",
    "Total Sale"},
     GROUPBY(
         HSTACK(
             B3:B39,
              ROUNDUP(
                  MONTH(
                      C3:C39&"-01"
                  )/3,
                  0
              )
         ),
         D3:D39,
         SUM,
         0,
         0
     )
)
Excel solution 5 for Custom Grouping! Part 12, proposed by Ivan William:
=VSTACK({"Year",
    "Season",
    "Total Sale"},
    GROUPBY(HSTACK(B3:B39,
    INT((MONTH(
        DATEVALUE(
            C3:C39&" 1"
        )
    )-1)/3)+1),
    D3:D39,
    SUM,
    ,
    0))
Excel solution 6 for Custom Grouping! Part 12, proposed by Sunny Baggu:
=LET(
 _m,
     ROUNDUP(
         MONTH(
             DATEVALUE(
                 C3:C39 & "1"
             )
         ) / 3,
          0
     ), _um,
     UNIQUE(
         _m
     ), _uy,
     UNIQUE(
         B3:B39
     ), _f,
     REDUCE(
 {"Year",
     "Season",
     "Total Sale"}, _uy, LAMBDA(x,
     y, VSTACK(
 x, IFNA(
 HSTACK(
 y, _um, MAP(_um,
     LAMBDA(a,
     SUM((B3:B39 = y) * (_m = a) * D3:D39)))
 ), y
 )
 )
 )
 ), FILTER(
     _f,
      TAKE(
          _f,
           ,
           -1
      ) <> 0
 )
)
Excel solution 7 for Custom Grouping! Part 12, proposed by Asheesh Pahwa:
=LET(
    yr,
    B3:B39,
    u,
    UNIQUE(
        yr
    ),
    r,
    REDUCE(
        G2:I2,
        u,
        LAMBDA(
            x,
            y,
            VSTACK(
                x,
                LET(
                    f,
                    FILTER(
                        C3:D39,
                        yr=y
                    ),
                    t,
                    TAKE(
                        f,
                        ,
                        1
                    ),
                    d,
                    MONTH(
                        DATEVALUE(
                            t&1
                        )
                    ),
                    xl,
                    XLOOKUP(
                        SEQUENCE(
                            12
                        ),
                        d,
                        TAKE(
                            f,
                            ,
                            -1
                        ),
                        ""
                    ),
                    w,
                    WRAPROWS(
                        xl,
                        3
                    ),
                    _s,
                    SEQUENCE(
                        ROWS(
                            w
                        )
                    ),
                    IFNA(
                        HSTACK(
                            y,
                            _s,
                            BYROW(
                                w,
                                LAMBDA(
                                    a,
                                    SUM(
                                        a
                                    )
                                )
                            )
                        ),
                        y
                    )
                )
            )
        )
    ),
    FILTER(
        r,
        TAKE(
            r,
            ,
            -1
        )<>0
    )
)
Excel solution 8 for Custom Grouping! Part 12, proposed by Hamidi Hamid:
=LET(yy,
    HSTACK(
        B3:B39,
        ROUNDUP(
            XLOOKUP(
                C3:C39,
                {"Jan",
                "Feb",
                "Mar",
                "Apr",
                "May",
                "jun",
                "Jul",
                "Aug",
                "Sep",
                "Oct",
                "Nov",
                "Dec"},
                {1,
                2,
                3,
                4,
                5,
                6,
                7,
                8,
                9,
                10,
                11,
                12},
                ""
            )/3,
            -0,
            1
        ),
        D3:D39
    ),
    an,
    TOCOL(
        IF(
            SEQUENCE(
                ,
                4
            ),
            UNIQUE(
                B3:B39
            ),
            ""
        )
    ),
    mm,
    TOCOL(
        IF(
            SEQUENCE(
                4
            ),
            SEQUENCE(
                ,
                4
            ),
            ""
        )
    ),
    t,
    MAP(an,
    mm,
    LAMBDA(a,
    b,
    IFERROR(SUM(FILTER(TAKE(
        yy,
        ,
        -1
    ),
    (TAKE(
        yy,
        ,
        1
    )=a)*(CHOOSECOLS(
        yy,
        2
    )=b))),
    1/0))),
    s,
    FILTER(
        HSTACK(
            an,
            mm,
            t
        ),
        NOT(
            ISERROR(
                t
            )
        )
    ),
    s)
Excel solution 9 for Custom Grouping! Part 12, proposed by Md. Zohurul Islam:
=LET(
a,
    B3:B39,b,
    C3:C39,c,
    D3:D39,d,
    HSTACK(a,
    ROUNDUP(MONTH(--(1&b))/3,
    0)),e,
    GROUPBY(
        d,
        c,
        SUM,
        0,
        0
    ),hdr,
    HSTACK(
        B2,
        "Season",
        "Total "&D2
    ),f,
    VSTACK(
        hdr,
        e
    ),f)
Excel solution 10 for Custom Grouping! Part 12, proposed by Pieter de B.:
=GROUPBY(
    HSTACK(
        B3:B39,
        ROUNDUP(
            MONTH(
                1&C3:C39
            )/3,

        )
    ),
    D3:D39,
    SUM,
    ,
    0
)
Solving the challenge of Custom Grouping! Part 12 with Python
Python solution 1 for Custom Grouping! Part 12, proposed by Konrad Gryczan, PhD:
import pandas as pd

path = "CH-163 Custom Grouping.xlsx"
input = pd.read_excel(path, usecols="B:D", skiprows=1, nrows=38)
test = pd.read_excel(path, usecols="G:I", skiprows=1, nrows=15)

input['Season'] = pd.to_datetime(input['Year'].astype(str) + " " + input['Month'], format='%Y %b').dt.quarter

result = input.groupby(['Year', 'Season'])['Sale'].sum().reset_index()
result.columns = test.columns = ['Year', 'Season', 'Total Sale']

print(all(result ==test)) # True
Python solution 2 for Custom Grouping! Part 12, proposed by Luan Rodrigues:
import pandas as pd

file = "CH-163 Custom Grouping.xlsx"
df = pd.read_excel(file,usecols='B:D',skiprows=1)
df['Season'] = pd.to_datetime("01/" + df['Month'] + "/" + df['Year'].astype(str), format='%d/%b/%Y').dt.quarter
grp = df.groupby(['Year','Season'])['Sale'].sum().reset_index()
print(grp)
Solving the challenge of Custom Grouping! Part 12 with Python in Excel
Python in Excel solution 1 for Custom Grouping! Part 12, proposed by Alejandro Campos:
xl("B2:D39", headers=True).assign(Season=lambda d: pd.to_datetime("01/"+d.Month+"/"+d.Year.astype(str)).dt.quarter).groupby(['Year','Season']).Sale.sum().reset_index()Solving the challenge of Custom Grouping! Part 12 with R
R solution 1 for Custom Grouping! Part 12, proposed by Konrad Gryczan, PhD:
library(tidyverse)
library(readxl)

path = "files/CH-163 Custom Grouping.xlsx"
input = read_excel(path, range = "B2:D39")
test = read_excel(path, range = "G2:I17")

result = input %>%
 unite("ym", Year, Month , sep = " ", remove = F) %>%
 mutate(ym = ym(ym),
 Season = quarter(ym)) %>%
 summarise(`Total Sale` = sum(Sale), .by = c(Year, Season))

all.equal(result, test)
# TRUE
Solving the challenge of Custom Grouping! Part 12 with Google Sheets
Google Sheets solution 1 for Custom Grouping! Part 12, proposed by Peter Krkos:
PowerQuery solution:
https://docs.google.com/spreadsheets/d/1zR5IZLz8OT76vhaPEHfsPrw8-RDKnLyyqS49IJjdhFk/edit?pli=1&gid=1066998434#gid=1066998434