
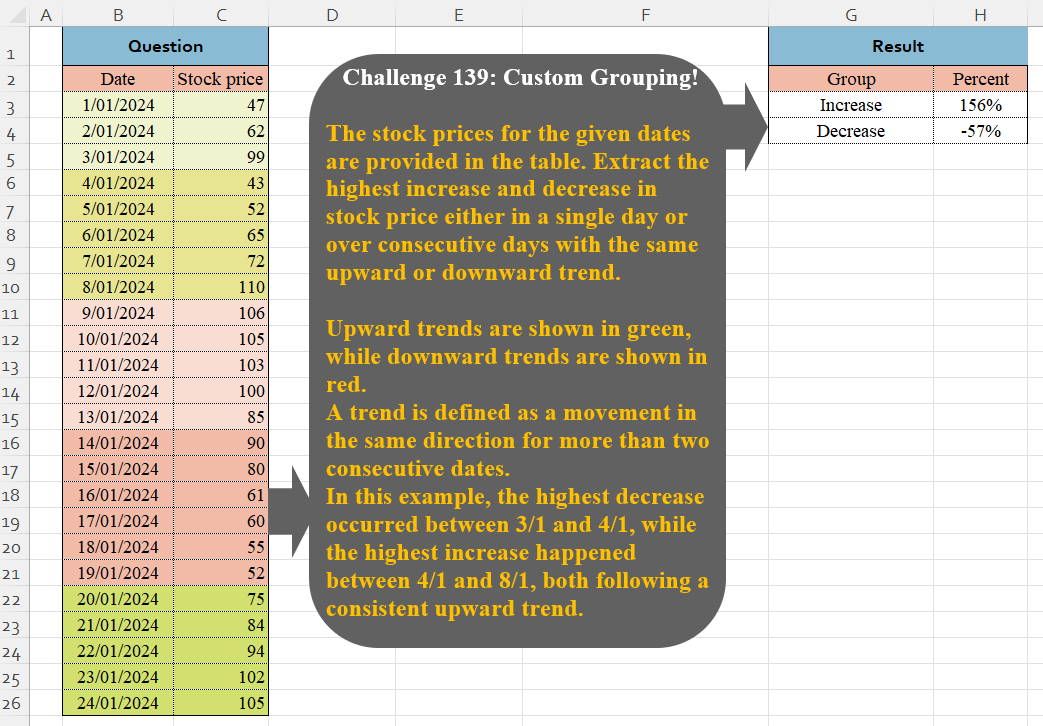
The stock prices for the given dates are provided in the table. Extract the highest increase and decrease in stock price either in a single day or over consecutive days with the same upward or downward trend. Upward trends are shown in green, while downward trends are shown in red. A trend is defined as a movement in the same direction for more than two consecutive dates. In this example, the highest decrease occurred between 3/1 and 4/1, while the highest increase happened between 4/1 and 8/1, both following a consistent upward trend.
📌 Challenge Details and Links
Challenge Number: 139
Challenge Difficulty: ⭐⭐⭐⭐
📥Download Sample File
📥Link to the solutions on LinkedIn
Solving the challenge of Custom Grouping! Part 8 with Power Query
Power Query solution 1 for Custom Grouping! Part 8, proposed by Omid Motamedisedeh:
let
  S0 = Excel.CurrentWorkbook(){[Name = "Table1"]}[Content][Stock price],
  S1 = List.Accumulate(
    S0,
    [m = {}, i = 0, s = {}],
    (a, b) =>
      if (a[i] < 2 or ((b > List.Last(a[s])) = (a[s]{1} > a[s]{0}))) then
        [m = a[m], s = a[s] & {b}, i = a[i] + 1]
      else
        [m = a[m] & {a[s]}, s = {b}, i = 0]
  ),
  S2 = List.Transform(S1[m] & {S1[s]}, each (List.Last(_) - _{0}) / _{0})
    & List.Transform(List.Skip(List.Positions(S0)), each S0{_} / S0{_ - 1} - 1),
  Custom1 = #table({"Group", "Percent"}, {{"Increase", List.Max(S2)}, {"Decrease", List.Min(S2)}})
in
  Custom1
Power Query solution 2 for Custom Grouping! Part 8, proposed by Zoran Milokanović:
let
  Source = Excel.CurrentWorkbook(){[Name = "Input"]}[Content][Stock price],
  R = List.Transform(
    List.Accumulate(
      Source,
      {},
      (b, n) =>
        let
          l = List.Last(b),
          d = if n > l{0} then "U" else "D"
        in
          {b & {{n, null, {n}}}, List.RemoveLastN(b) & {{n, d, l{2} & {n}}}}{
            Byte.From(b <> {} and (l{1} = null or l{1} = d))
          }
    ),
    each {_{2}{0}, List.Last(_{2})}
  ),
  T = List.Transform(
    List.Split(List.RemoveLastN(List.Skip(List.Combine(R))), 2) & R,
    each _{1} / _{0} - 1
  ),
  S = Table.FromColumns(
    {{"Increase", "Decrease"}, {List.Max(T), List.Min(T)}},
    {"Group", "Percent"}
  )
in
  S
Power Query solution 3 for Custom Grouping! Part 8, proposed by Ramiro Ayala Chávez:
let
S = Excel.CurrentWorkbook(){[Name="Table1"]}[Content],
a = Table.AddIndexColumn(S,"I"),
b = Table.RemoveRowsWithErrors(Table.AddColumn(a,"N", each a{[I]+1}[Stock price])),
c = Table.AddColumn(b,"D", each [Stock price]-[N]),
d = Table.AddColumn(c,"B", each if[D]<=0 then 1 else 0),
e = Table.Group(d,{"B"},{"G", each _},GroupKind.Local)[G],
f = List.Transform(e, each Table.FirstN(_,1)&Table.LastN(_,1)),
g = List.Transform(f, each List.Combine({[Stock price]}&{[N]})),
h = Table.FromRows(List.Transform(g, each {_{0}}&{_{3}}),{"V1","V2"}),
i = Table.AddColumn(h,"Percent", each Number.Round(([V2]-[V1])/[V1],2)),
j = Table.MaxN(i,"Percent",1)&Table.MinN(i,"Percent",1),
Sol = Table.AddColumn(j,"Group", each if[Percent]>=1 then "Increase" else "Decrease")[[V1],[V2],[Group],[Percent]]
in
Sol
Power Query solution 4 for Custom Grouping! Part 8, proposed by Alejandro Simón 🇵🇦 🇪🇸:
let
Source = Excel.CurrentWorkbook(){[Name="Table1"]}[Content],
Custom1 = Source[Stock price],
Calc = List.Transform({0,1}, (k)=>
 List.Generate(()=> [x = {Custom1{0}}, y = 1],
 each [y]<=List.Count(Custom1),
 each [y = [y]+1,
 z = {Custom1{[y]}>List.Last([x]),Custom1{[y]} Number.ToText(a{k}(List.Transform(List.Select(Calc{k}, each List.Count(_)>1),
 each (List.Last(_)-_{0})/_{0})), "p0"))
in b,
Sol = Table.FromColumns({{"Increase", "Decrease"}, Calc2}, {"Group", "Percent"})
in
Sol
Power Query solution 5 for Custom Grouping! Part 8, proposed by Kris Jaganah:
let
  A = Excel.CurrentWorkbook(){[Name = "Table1"]}[Content],
  B = Table.TransformColumnTypes(A, {{"Date", Int64.Type}}),
  C = Table.AddColumn(
    B,
    "Ans",
    each
      let
        a = [Stock price],
        b = Table.SelectRows(B, (x) => x[Date] < [Date])[Stock price],
        c = List.Transform(b, each a / _ - 1)
      in
        c
  ),
  D = List.Combine(C[Ans]),
  E = #table(
    type table [Group = Text.Type, Percent = Percentage.Type],
    {{"Increase", List.Max(D)}, {"Decrease", List.Min(D)}}
  )
in
  E
Power Query solution 6 for Custom Grouping! Part 8, proposed by 🇮🇷 Navid Esmaeilzadeh اسماعیل زاده:
let
S = Excel.CurrentWorkbook(){[Name="Table1"]}[Content],
 A = Table.AddIndexColumn(S, "Index", 0, 1, Int64.Type),
 B = Table.AddColumn(A, "Diff", each List.Skip(List.Accumulate(List.FirstN(A[Stock price],[Index]),{0},(S,C)=>S&{([Stock price]-C)/C}),1)),
 C = Table.FromColumns({{Number.Round(List.Max(List.Combine(B[Diff])),2),Number.Round(List.Min(List.Combine(B[Diff])),2)},{"Increase","Dacrease"}},{"Percent","Group"}),
 D = Table.TransformColumnTypes(C,{{"Percent", Percentage.Type}})
in
 D
Power Query solution 7 for Custom Grouping! Part 8, proposed by Luke Jarych:
let
 // Load source data from the table
 Source = Excel.CurrentWorkbook(){[Name="Table1"]}[Content],
 StockPrices = Source[Stock price],
 CumulativeTrends = List.Combine(List.Transform({0..List.Count(StockPrices) - 1}, (i) =>
 let
 currentPrice = StockPrices{i},
 previousPrices = List.FirstN(StockPrices, i),
 trendValues = List.Transform(previousPrices, each currentPrice / _ - 1)
 in
 trendValues
 )),
 Result =
hashtag
#table(
 type table[Group = Text.Type, Percent = Percentage.Type],
 {
 {"Increase", List.Max(CumulativeTrends)}, // Max cumulative trend value
 {"Decrease", List.Min(CumulativeTrends)}  // Min cumulative trend value
 }
 )
in
 Result
Power Query solution 8 for Custom Grouping! Part 8, proposed by Szabolcs Phraner:
let
Source = ...,
 //To evaluate previous or next row
 Index = Table.AddIndexColumn(Source, "Index", 0, 1, Int64.Type),
//Save table to memory as it will be resused several times
 Buffer = Table.Buffer( Index ),
 Trend = Table.AddColumn(Buffer, "Group", each [
 isFirst = [Index] = 0,
 ComparedTo = if isFirst then Buffer{1}[Stock price] else Buffer{[Index] -1}[Stock price],
 Group = if (isFirst and [Stock price] < ComparedTo) or [Stock price] > ComparedTo then "Increase" else "Decrease"][Group],Text.Type),
/
 Percentages = Table.Group(Trend, {"Group"}, {{"Percent", each
[
 tbl =_,
 start =try Buffer{ tbl{0}[Index] -1 }[Stock price] otherwise Table.First(tbl)[Stock price] ,
 end = Table.Max(tbl,"Index")[Stock price],
 diff = end-start,
 percent = Number.Round( diff / start, 2)
] [percent]
, Percentage.Type
}},
0
),
 Min_Max_Calc = Table.Group(Percentages, {"Group"}, {{"Percent", each if Table.FirstValue(_) = "Increase" then List.Max([Percent]) else List.Min([Percent]) , Percentage.Type}})
in
 Min_Max_Calc
Solving the challenge of Custom Grouping! Part 8 with Excel
Excel solution 1 for Custom Grouping! Part 8, proposed by Bo Rydobon 🇹🇭:
=LET(
    s,
    C3:C26,
    DROP(
        GROUPBY(
            SCAN(
                0,
                TOCOL(
                    s
Excel solution 2 for Custom Grouping! Part 8, proposed by Kris Jaganah:
=LET(
    a,
    DAY(
        B3:B26
    ),
    b,
    C3:C26,
    c,
    b/IFNA(
        XLOOKUP(
            a-TOROW(
                a
            ),
            a,
            b
        ),
        b
    )-1,
    HSTACK(
        {"Inc";"Dec"}&"rease",
        VSTACK(
            MAX(
                c
            ),
            MIN(
                c
            )
        )
    )
)
Excel solution 3 for Custom Grouping! Part 8, proposed by Mark Biegert:
=LET(d,
    VSTACK(
        C3,
        C3:C26
    ),q,
    DROP(1+(DROP(
        d,
        1
    )-d)/d,
    -1),z,
     MAX(
         SCAN(
             1,
             q,
             LAMBDA(
                 a,
                 v,
                 IF(
                     v>1,
                     IFNA(
                         a*v,
                         1
                     ),
                     1
                 )
             )
         )
     )-1,zz,
     MIN(
         SCAN(
             1,
             q,
             LAMBDA(
                 a,
                 v,
                 IF(
                     v<1,
                     IFNA(
                         a*v,
                         1
                     ),
                     1
                 )
             )
         )
     )-1,VSTACK(
    {"Group",
    "Percent"},
    HSTACK(
        VSTACK(
            "Increase",
            "Decrease"
        ),
        VSTACK(
            z,
            zz
        )
    )
)
)
Solving the challenge of Custom Grouping! Part 8 with Python
Python solution 1 for Custom Grouping! Part 8, proposed by Luke Jarych:
import pandas as pd
import xlwings as xw
import re

# Import workbook range as DataFrame
wb = xw.Book(r'CH-139 Custom Grouping.xlsx')
sh = wb.sheets[0]
table1 = sh.tables['Table1']
rng1 = sh.range(table1.range.address)
df = rng1.options(pd.DataFrame, header=True, index=False, numbers=float).value

def cumulative_percentage_changes(series):
 percentage_changes = [[]] # Initialize with an empty list for the first row

 for i in range(1, len(series)):
 current_value = series.iloc[i]
 previous_values = series.iloc[:i]
 changes = [(current_value - prev) / prev * 100 for prev in previous_values]
 percentage_changes.append(changes)

 return percentage_changes

df['Cumulative Percentage Changes'] = cumulative_percentage_changes(df['Stock price'])
flattened_changes = [item for sublist in df['Cumulative Percentage Changes'] for item in sublist]

max_change = round(max(flattened_changes))
min_change = round(min(flattened_changes))

# Print the results as percentages
print(f"Increase: {max_change}%")
print(f"Decrease: {min_change}%")
Solving the challenge of Custom Grouping! Part 8 with Python in Excel
Python in Excel solution 1 for Custom Grouping! Part 8, proposed by Alejandro Campos:
df = xl("B2:C26", headers=True)
df['dI'], df['dD'] = (df['Stock price'].shift() > df['Stock price'])
 .cumsum(), (df['Stock price'].shift() < df['Stock price']).cumsum()
df['gI'], df['gD'] = [df.groupby(g)[g].transform(
 lambda x: x if len(x) > 2 else pd.NA) for g in ['dI', 'dD']]
df['chk'] = df.apply(lambda r: r['gI'] if pd.notna(r['gI']) and pd.isna(r['gD'])
 else r['gD'] if pd.notna(r['gD']) and pd.isna(r['gI'])
 else min(r['gI'], r['gD']) if pd.notna(r['gI']) and pd.notna(r['gD'])
 else pd.NA, axis=1)
df['dSP'] = df['Stock price'].diff().fillna(0)
df['mChk'] = df.groupby('chk')['dSP'].transform(
 lambda x: 1 if x.gt(0).sum() > x.lt(0).sum() else -1)
df['Grp'] = df['mChk'].map({1: 'Upward', -1: 'Downward'})
df['pct'] = df['Stock price'].pct_change().fillna(0)
df['fVal'], df['cSum'] = df.groupby('chk')['Stock price'].transform(
 'first'), df.groupby('chk')['dSP'].transform(lambda x: x.shift(-1).cumsum())
df['rtPct'] = (df['cSum'] / df['fVal']).fillna(0)
rsm = df.groupby('Grp').agg({'pct': ['min', 'max'], 'rtPct': ['min', 'max']})
res = pd.DataFrame({'Grp': ['Increase', 'Decrease'],
 'Pct': [rsm.values.max(), rsm.values.min()]})
Solving the challenge of Custom Grouping! Part 8 with Google Sheets
Google Sheets solution 1 for Custom Grouping! Part 8, proposed by Peter Krkos:
PowerQuery solution:
https://docs.google.com/spreadsheets/d/1zR5IZLz8OT76vhaPEHfsPrw8-RDKnLyyqS49IJjdhFk/edit?gid=1817375489#gid=1817375489