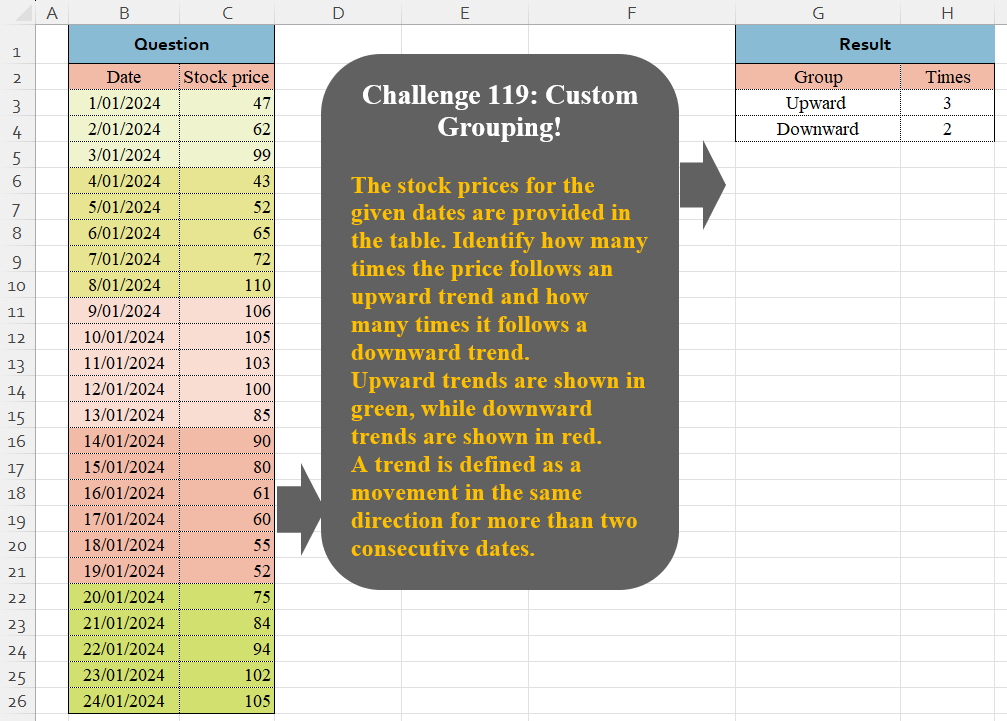
The stock prices for the given dates are provided in the table. Identify how many times the price follows an upward trend and how many times it follows a downward trend. Upward trends are shown in green, while downward trends are shown in red. A trend is defined as a movement in the same direction for more than two consecutive dates.
📌 Challenge Details and Links
Challenge Number: 119
Challenge Difficulty: ⭐⭐⭐⭐
📥Download Sample File
📥Link to the solutions on LinkedIn
Solving the challenge of Custom Grouping! Part 4 with Power Query
Power Query solution 1 for Custom Grouping! Part 4, proposed by Zoran Milokanović:
let
  Source = Excel.CurrentWorkbook(){[Name = "Input"]}[Content][Stock price],
  S = Table.Group(
    Table.FromList(
      List.Accumulate(
        Source,
        {},
        (b, n) =>
          let
            l = List.Last(b),
            d = if n > l{0} then "Upward" else "Downward"
          in
            {b & {{n, null}}, List.RemoveLastN(b) & {{n, d}}}{
              Number.From(b <> {} and (l{1} = null or l{1} = d))
            }
      ),
      each {_{1}},
      {"Group"}
    ),
    "Group",
    {"Times", Table.RowCount}
  )
in
  S
Power Query solution 2 for Custom Grouping! Part 4, proposed by Brian Julius:
let
  Source = Excel.CurrentWorkbook(){[Name = "Table1"]}[Content],
  AddIdx = Table.AddIndexColumn(Source, "Index"),
  AddPrev = Table.AddColumn(
    AddIdx,
    "PrevPrice",
    each try Source[Stock price]{[Index] - 1} otherwise null
  ),
  AddGrp = Table.AddColumn(
    AddPrev,
    "Grp",
    each try

        if [Stock price] > [PrevPrice] then
          "Upward"
        else if [Stock price] < [PrevPrice] then
          "Downward"
        else
          "Same"
    otherwise
      null
  ),
  FillUp = Table.FillUp(AddGrp, {"Grp"}),
  Add1stOrd = Table.AddColumn(
    FillUp,
    "FirstOrd",
    each try if [Grp] = FillUp[Grp]{[Index] - 1} then null else [Index] otherwise [Index]
  ),
  Add2ndOrd = Table.AddColumn(
    Add1stOrd,
    "SecondOrd",
    each try
      if Add1stOrd[FirstOrd]{[Index] - 1} = null then [FirstOrd] else null
    otherwise
      [FirstOrd]
  ),
  AddGroup = Table.AddColumn(Add2ndOrd, "Group", each if [SecondOrd] = null then [Grp] else null),
  FillDown = Table.FillDown(AddGroup, {"SecondOrd"}),
  FillUp2 = Table.FillUp(FillDown, {"Group"}),
  RemOther = Table.Distinct(Table.SelectColumns(FillUp2, {"SecondOrd", "Group"})),
  GpCount = Table.Group(RemOther, {"Group"}, {{"Times", each Table.RowCount(_)}})
in
  GpCount
Power Query solution 3 for Custom Grouping! Part 4, proposed by Alejandro Simón 🇵🇦 🇪🇸:
let
  Source = Excel.CurrentWorkbook(){[Name = "Table1"]}[Content],
  UpDown = Table.FromColumns(
    {
      List.Transform(
        {0 .. Table.RowCount(Source) - 1},
        each
          if ({0} & Source[Stock price]){_ + 1} > ({0} & Source[Stock price]){_} then
            "Upward"
          else
            "Downward"
      )
    },
    {"A"}
  ),
  Sol = Table.FromRows(
    List.Transform(
      {"Upward", "Downward"},
      each {
        _,
        List.Count(
          List.Select(
            Table.SelectRows(
              Table.Group(UpDown, {"A"}, {{"B", each List.Count([A])}}, 0),
              each [B] > 1
            )[A],
            (x) => x = _
          )
        )
      }
    ),
    {"Group", "Times"}
  )
in
  Sol
Power Query solution 4 for Custom Grouping! Part 4, proposed by Kris Jaganah:
let
  A = Excel.CurrentWorkbook(){[Name = "Table1"]}[Content],
  B = Table.AddColumn(
    A,
    "Diff",
    each [Stock price] - (try A[Stock price]{List.PositionOf(A[Date], [Date]) - 1} otherwise 0)
  ),
  C = Table.AddIndexColumn(B, "Id", 1),
  D = Table.AddColumn(
    C,
    "Group",
    each List.Accumulate(
      List.Range(B[Diff], 0, [Id]),
      0,
      (x, y) =>
        if y > 0 and x > 0 then
          x + 1
        else if y > 0 and x <= 0 then
          1
        else if y < 0 and x > 0 then
          - 1
        else
          x - 1
    )
  ),
  E = Table.Group(D, {"Group"}, {"Times", each Table.RowCount(_)}),
  F = Table.SelectRows(E, each Number.Abs([Group]) = 2),
  G = Table.TransformColumns(F, {"Group", each if _ > 0 then "Upwards" else "Downwards"})
in
  G
Power Query solution 5 for Custom Grouping! Part 4, proposed by 🇮🇷 Navid Esmaeilzadeh اسماعیل زاده:
let
  S = Excel.CurrentWorkbook(){[Name = "Table1"]}[Content],
  A = Table.AddIndexColumn(S, "i", 0, 1),
  B = Table.AddColumn(
    A,
    "d",
    each
      if (try [Stock price] - A[Stock price]{[i] - 1} otherwise [Stock price]) >= 0 then
        "Up"
      else
        "Down"
  ),
  C = Table.AddColumn(B, "d2", each if [d] = B[d]{[i] - 1} then "T" else "N"),
  D = Table.AddColumn(
    C,
    "d3",
    each try if [d2] = "N" and C[d2]{[i] - 1} <> "N" then [i] else null otherwise [i]
  ),
  E = Table.FillDown(D, {"d3"}),
  F = Table.Group(E, {"d", "d3"}, {{"Count", each Table.RowCount(_), Int64.Type}}),
  G = Table.SelectRows(F, each [Count] <> 1),
  H = Table.Group(G, {"d"}, {{"Count", each Table.RowCount(_), Int64.Type}}),
  #"Renamed Columns" = Table.RenameColumns(H, {{"d", "Group"}, {"Count", "Time"}})
in
  #"Renamed Columns"
Solving the challenge of Custom Grouping! Part 4 with Excel
Excel solution 1 for Custom Grouping! Part 4, proposed by Bo Rydobon 🇹🇭:
=LET(z,N(C4:C26>C3:C25),L,LAMBDA(i,IF({1,0},IF(i,"Up","Down")&"ward",SUM(N(SCAN(1,z=i,LAMBDA(a,v,a*v+v))=3)))),VSTACK(L(1),L(0)))Excel solution 2 for Custom Grouping! Part 4, proposed by Oscar Mendez Roca Farell:
=LET(
    d,
     N(
         C3:C26>C2:C25
     ),
     r,
     ROW(
         B3:B26
     ),
     F,
     LAMBDA(
         i,
          SUM(
              N(
                  FREQUENCY(
                      IF(
                          i,
                           r
                      ),
                       IF(
                           1-i,
                            r
                       )
                  )>1
              )
          )
     ),
     HSTACK(
         VSTACK(
             "Up",
              "Down"
         )&"ward",
          VSTACK(
              F(
                  d
              ),
               F(
                   1-d
               )
          )
     )
)
Excel solution 3 for Custom Grouping! Part 4, proposed by Julian Poeltl:
=LET(A,
    C3:C26,
    D,
    DROP(
        A>DROP(
            A,
            1
        ),
        -1
    ),
    C,
    DROP((D=TRUE)*(DROP(
        D,
        1
    )=FALSE),
    -1),
    S,
    SUM(
        C
    ),
    HSTACK(
        VSTACK(
            "Upward",
            "Downward"
        ),
        VSTACK(
            IF(
                INDEX(
            A,
            1
        )
Excel solution 4 for Custom Grouping! Part 4, proposed by Kris Jaganah:
=LET(a,
    C3:C26,
    b,
    a-VSTACK(
        0,
        DROP(
            a,
            -1
        )
    ),
    c,
    SCAN(0,
    b,
    LAMBDA(x,
    y,
    IFS((y>0)*(x>0),
    1+x,
    (y>0)*(x<=0),
    1,
    (y<0)*(x>0),
    -1,
    1,
    x-1))),
    VSTACK(
        SUM(
            N(
                c=2
            )
        ),
        SUM(
            N(
                c=-2
            )
        )
    ))
Excel solution 5 for Custom Grouping! Part 4, proposed by JvdV -:
=LET(
    x,
    IF(
        TOCOL(
            -REGEXEXTRACT(
                CONCAT(
                    0,
                    N(
                        C4:C26
Excel solution 6 for Custom Grouping! Part 4, proposed by Imam Hambali:
=LET(
a,
     C3:C26,c,
     IF(
         a-VSTACK(
             0,
              DROP(
                  a,
                  -1
              )
         )>0,
         1,
         -1
     ),f,
     SCAN(
         0,
          IF(
              c=VSTACK(
                  0,
                   DROP(
                       c,
                       -1
                   )
              ),
              c,
              0
          ),
          LAMBDA(
              x,
              y,
               IF(
                   y=0,
                   0,
                   x+y
               )
          )
     ),g,
     IF(FILTER(f,
    (f=-2)+(f=2))>0,
    "Upward",
    "Downward"),GROUPBY(
    g,
    g,
    COUNTA,
    0,
    0
)
)
Excel solution 7 for Custom Grouping! Part 4, proposed by Sunny Baggu:
=LET(     _i,
     {101; 100; 11},     _d,
     {110; 10},     _t,
     CONCAT(
         N(
             C4:C26 > C3:C25
         )
     ),     l,
     LAMBDA(
         arr,          ROWS(

               MAP(

                    arr,

                    LAMBDA(
                        a,

                         ROWS(
                             UNIQUE(
                                 TOCOL(
                                     SEARCH(
                                         a,
                                          _t,
                                          SEQUENCE(
                                              LEN(
                                                  _t
                                              )
                                          )
                                     ),
                                      3
                                 )
                             )
                         )

                    )

               )

          )     ),     HSTACK(
         {"Upward "; "Downward"},
          VSTACK(
              l(
                  _i
              ),
               l(
                   _d
               )
          )
     ))
Excel solution 8 for Custom Grouping! Part 4, proposed by Bilal Mahmoud kh.:
=LET(
    a,
    MAP(
        C3:C26,
        LAMBDA(
            x,
            IF(
                x-INDEX(
                    C3:x,
                    COUNT(
                        C3:x
                    )-1,
                    1
                )>=0,
                1,
                0
            )
        )
    ),
    b,
    TEXTSPLIT(
        CONCAT(
            a
        ),
        "0",
        ,
        TRUE
    ),
    c,
    TEXTSPLIT(
        CONCAT(
            a
        ),
        "1",
        ,
        TRUE
    ),
    HSTACK(
        {"Upward";"Downward"},
        VSTACK(
            COUNTA(
                b
            )-1,
            COUNTA(
                c
            )-1
        )
    )
)
Excel solution 9 for Custom Grouping! Part 4, proposed by David-Olivier Tarac:
= LAMBDA(data; LET(
 seq;
    SEQUENCE(
        ROWS(
            data
        )
    ); updown;
    IFERROR(
        data/VSTACK(
            {0};
            TAKE(
                data;
                ROWS(
            data
        )-1
            )
        );
        ""
    ); ups;
    IF(
        updown>1;
        seq
    ); downs;
    IF(
        updown<1;
        seq
    ); frequps;
    FREQUENCY(
        ups;
        downs
    ); freqdowns;
    FREQUENCY(
        downs;
        ups
    ); nbclustersup;
    SUM(1*(frequps>1)); nbclustersdown;
    SUM(1*(freqdowns>1)); VSTACK(
     nbclustersup;
     nbclustersdown
 )
 )
)
Excel solution 10 for Custom Grouping! Part 4, proposed by Eddy Wijaya:
=LET(    d,
    C3:C26,    up,
    SCAN(
        0,
        d,
        LAMBDA(
            a,
            v,
            IF(
                v>OFFSET(
                    v,
                    -1,

                ),
                a+1,
                a*0
            )
        )
    ),    dw,
    SCAN(
        0,
        d,
        LAMBDA(
            a,
            v,
            IF(
                v
Excel solution 11 for Custom Grouping! Part 4, proposed by Hussein SATOUR:
=LET(s,
    C2:C26,
    a,
    DROP(
        s,
        -2
    ),
    b,
    DROP(
        DROP(
            s,
            1
        ),
        -1
    ),
    e,
    VSTACK({1;0},
    ((DROP(
        s,
        2
    )-b)*IFERROR(
        b-a,
        0
    )>=0)*1),
    x,
    TOCOL(IFS(e<>0,
    1/0,
    VSTACK(
        0,
        DROP(
            e,
            -1
        )
    )=0,
    1/0,
    (e=0)*((VSTACK(
        b,
        TAKE(
            s,
            -1
        ),
        0
    )-IFNA(
        a,
        s
    ))>0),
    "Upward",
    1,
    "Downward"),
    2),
    GROUPBY(
        x,
        x,
        COUNTA
    ))
Excel solution 12 for Custom Grouping! Part 4, proposed by Talia Cao, CPA:
=LET(p,
    C3:C26,
    c,
    SIGN(
        p-N(
            +OFFSET(
                p,
                -1,

            )
        )
    ),
    MAP(IF(
        G3:G4=G3,
        1,
        -1
    ),
    LAMBDA(m,
    SUM(--(SCAN(
        0,
        c,
        LAMBDA(
            a,
            v,
            IF(
                v=m,
                a+1
            )
        )
    )=3)))))
Solving the challenge of Custom Grouping! Part 4 with Python in Excel
Python in Excel solution 1 for Custom Grouping! Part 4, proposed by Alejandro Campos:
df = xl("B2:C26", headers=True)
df['Date'] = pd.to_datetime(df['Date'], format='%d/%m/%Y')
df['Price Change'] = df['Stock price'].diff()
df['Trend'] = df['Price Change'].apply(lambda x: 'Up' if x > 0 else ('Down' if x < 0 else 'No Change'))
counts = df['Trend'].groupby((df['Trend'] != df['Trend'].shift()).cumsum()).agg(['first', 'size'])
result = counts[counts['size'] >= 2].groupby('first').size().reindex(['Up', 'Down'], fill_value=0).reset_index()
result.columns = ['Group', 'Times']
result
Python in Excel solution 2 for Custom Grouping! Part 4, proposed by Ümit Barış Köse, MSc:
df = xl("B2:C26", headers=True)
def count_trends(prices):
 upward_count = 0
 downward_count = 0
 upward_streak = 0
 downward_streak = 0
 for i in range(1, len(prices)):
 if prices[i] > prices[i - 1]:
 upward_streak += 1
 downward_streak = 0
 elif prices[i] < prices[i - 1]:
 downward_streak += 1
 upward_streak = 0
 upward_count += upward_streak == 2
 downward_count += downward_streak == 2
 return upward_count, downward_count
upward_count, downward_count = count_trends(df['Stock price'].values)
result = pd.DataFrame({
 'Group': ['Upward', 'Downward'],
 'Times': [upward_count, downward_count]
})
result
Python in Excel solution 3 for Custom Grouping! Part 4, proposed by George Mount:
xlsx
# Data import
df = xl("B2:C26", headers=True)
# Calculate the daily price difference and its sign
df['Diff'] = df['Stock price'].diff()
df['Sign'] = df['Diff'].apply(lambda x: 1 if x > 0 else (-1 if x < 0 else 0))
# Drop the first row with NaN values
df = df.dropna(subset=['Sign'])
# Identify sequences where the sign changes
df['Group'] = (df['Sign'] != df['Sign'].shift()).cumsum()
# Group by sequences and filter trends lasting more than two dates
grouped = df.groupby('Group')['Sign'].agg(['size', 'first']).reset_index()
trends = grouped[grouped['size'] >= 2]
# Count upward and downward trends
upward_trends = trends[trends['first'] == 1]['Group'].count()
downward_trends = trends[trends['first'] == -1]['Group'].count()
# Prepare the result
result = pd.DataFrame({
 'Group': ['Upward', 'Downward'],
 'Times': [upward_trends, downward_trends]
})
result
Solving the challenge of Custom Grouping! Part 4 with R
R solution 1 for Custom Grouping! Part 4, proposed by Konrad Gryczan, PhD:
library(tidyverse)
library(readxl)
path = "files/CH-119 Custom Grouping.xlsx"
input = read_excel(path, range = "B2:C26") %>% janitor::clean_names()
test = read_excel(path, range = "G2:H4")
result = input %>%
 mutate(a = cumsum(lag(stock_price, default = 0) > stock_price),
 d = cumsum(lag(stock_price, default = 0) < stock_price)) %>%
 mutate(a_n = ifelse(n() > 2, a, NA), .by = a) %>%
 mutate(d_n = ifelse(n() > 2, d, NA), .by = d) %>%
 mutate(check = case_when(
 !is.na(a_n) & is.na(d_n) ~ a_n,
 !is.na(d_n) & is.na(a_n) ~ d_n,
 !is.na(a_n) & !is.na(d_n) ~ pmin(a_n, d_n),
 TRUE ~ NA_real_
 )) %>%
 mutate(diff = stock_price - lag(stock_price, default = 0)) %>%
 mutate(sign = sign(median(diff)),
 Group = ifelse(sign == 1, "Upward", "Downward"),
 .by = check) %>%
 summarise(Times = n_distinct(check), .by = Group)
all.equal(result, test)
#> [1] TRUE
Solving the challenge of Custom Grouping! Part 4 with Google Sheets
Google Sheets solution 1 for Custom Grouping! Part 4, proposed by Peter Krkos:
PowerQuery solution:
https://docs.google.com/spreadsheets/d/1zR5IZLz8OT76vhaPEHfsPrw8-RDKnLyyqS49IJjdhFk/edit?usp=sharing