
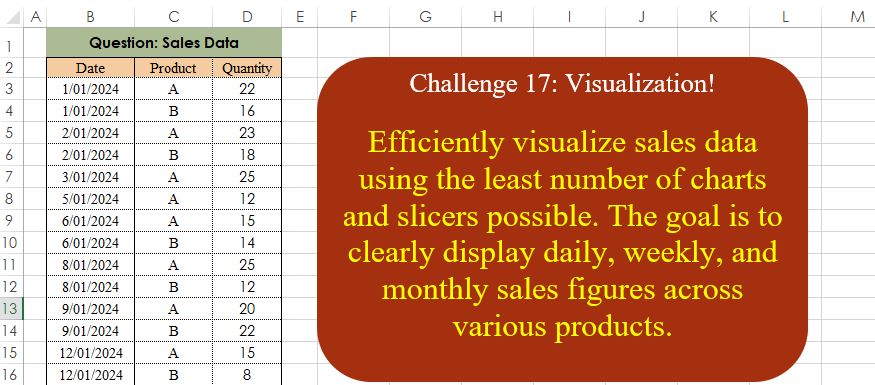
Challenge No. 17: Efficiently visualize sales data using the least number of charts and slicers possible.
Solved using: Excel.
Moderate difficulty level.
Challenge No. 17: Efficiently visualize sales data using the least number of charts and slicers possible.
Solved using: Excel.
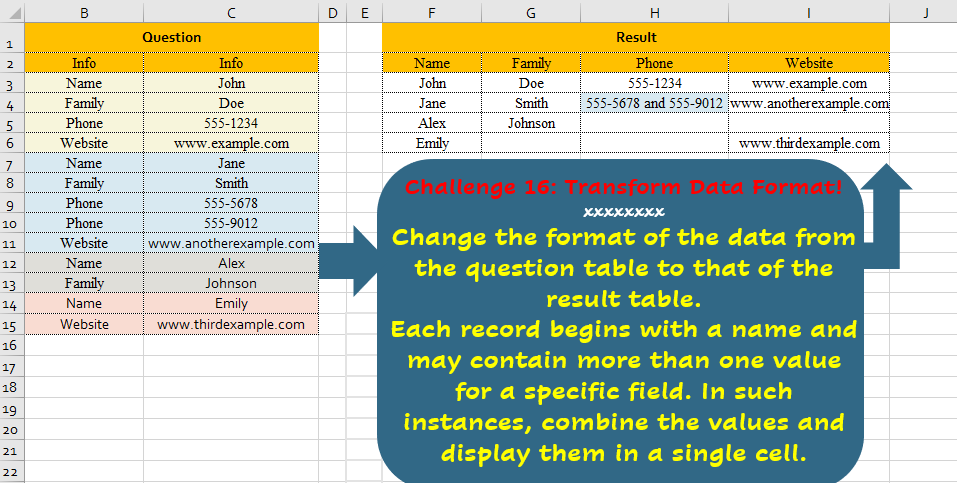
Challenge No. 16: Change the format of the data from the question table to that of the result table.
Solved using:Excel, Power Query, and R.
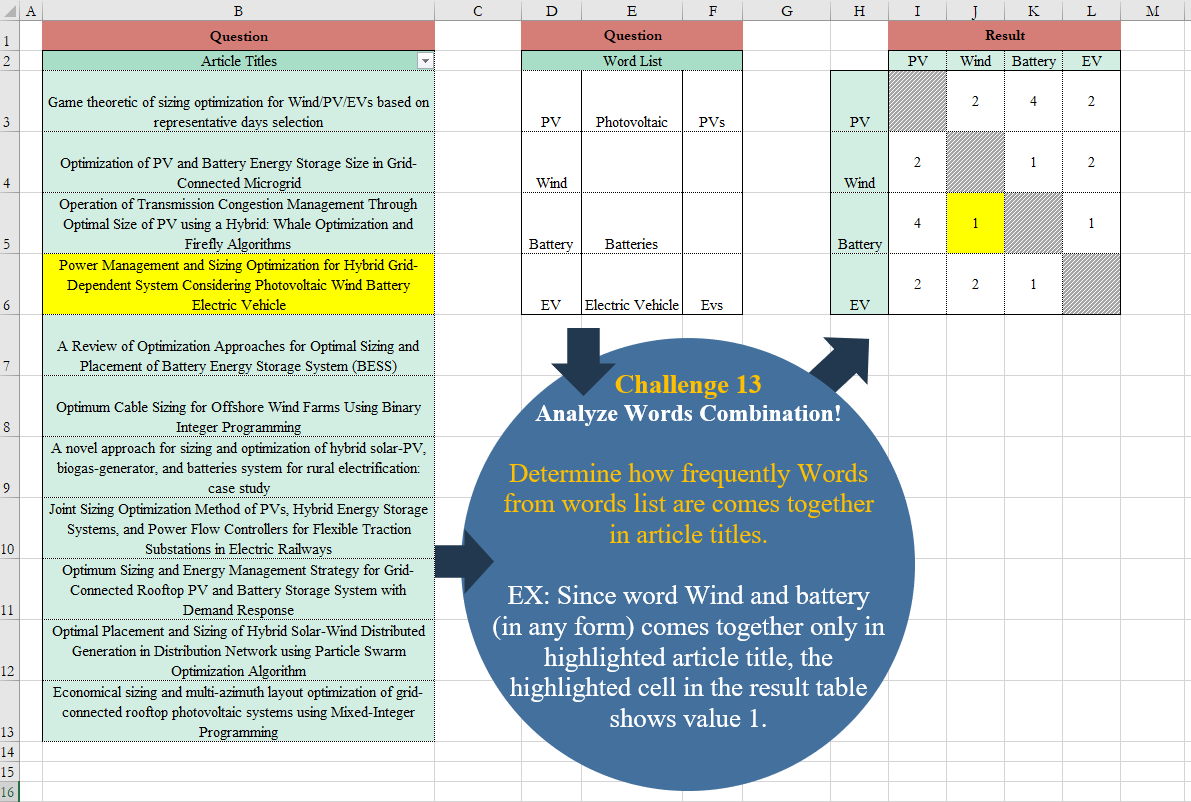
Challenge No. 13: Determine how frequently Words from words list are comes together in article titles.
Solved using:Excel (CHOOSEROWS, IF, LAMBDA), Power Query (Table.AddColumn), and R.

Challenge No. 8: The Question’s table outlines warehouse transactions with records for Initial value (warehouse product count), Add (purchased and incoming products), and Reduce (sold and outgoing products).
Solved using:Excel, and Power Query.

Challenge No. 7: Filter rows with quantity equal to 9 and display the entire result in unhidden cells.
Solved using:Excel, and Power Query.
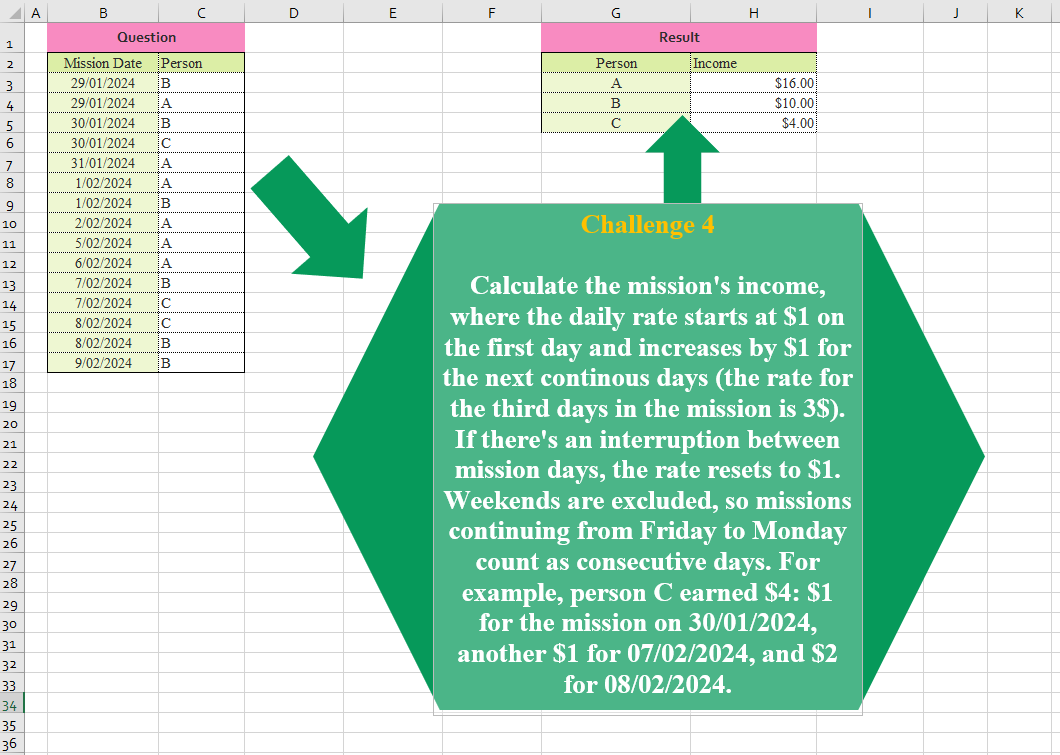
Challenge No. 4: Calculate the mission’s income, where the daily rate starts at $1 on the first day and increases by $1 for the next continuous days (the rate for the third day in the mission is 3$).
Solved using: Excel.
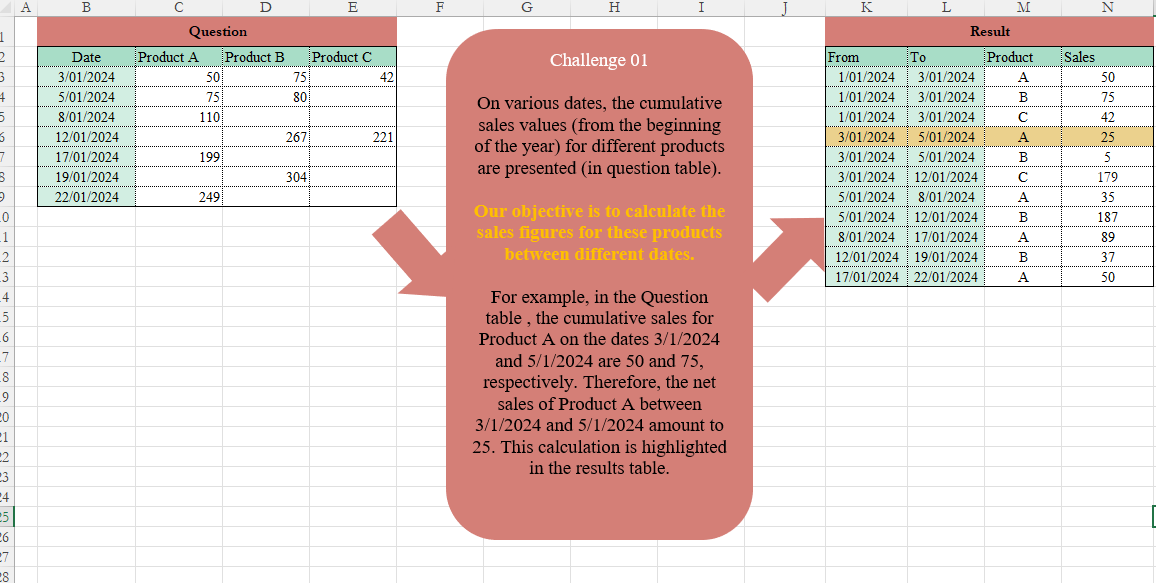
Challenge No. 1: On various dates, the cumulative sales values (from the beginning of the year) for different products are presented (in the Question table).
Solved using:Excel (DROP, FILTER, HSTACK), and Power Query (Table.AddColumn, Table.TransformColumnTypes).