Challenge No. 16: (Excel formulas also welcome)
Generate the Result table shown.
Solved using: Power Query (List.Distinct, Table.Pivot, Table.PromoteHeaders).
Transforms a table by pivoting column values into new columns in Power Query.
Challenge No. 16: (Excel formulas also welcome)
Generate the Result table shown.
Solved using: Power Query (List.Distinct, Table.Pivot, Table.PromoteHeaders).

Challenge No. 11: (Excel formulas also welcome)
Generate Result table as shown.
Solved using: Power Query (List.Distinct, Table.AddColumn, Table.Pivot).

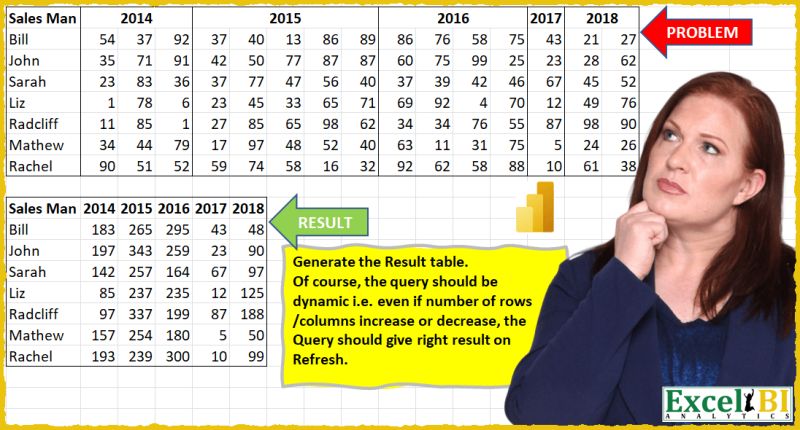
Challenge No. 66: Convert the Question table with the merge headers into the result table.
Solved using:Excel (DROP, HSTACK, IF), Power Query (List.Distinct, List.PositionOf, Table.Pivot), Python, R, and VBA.
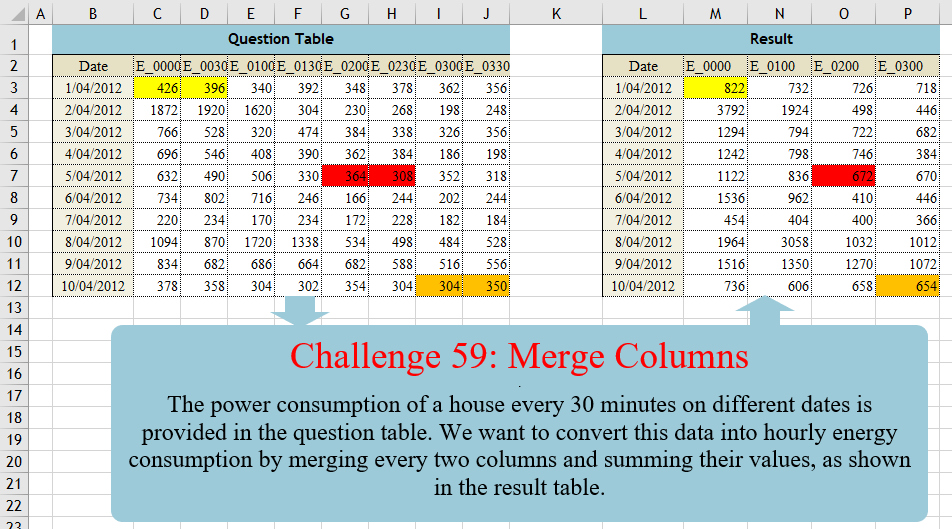
Challenge No. 59: The power consumption of a house every 30 minutes on different dates is provided in the question table.
Solved using:Excel (CHOOSECOLS, FILTER, HSTACK), Power Query (List.Distinct, List.Skip, List.Split), Python, Python in Excel, and R.
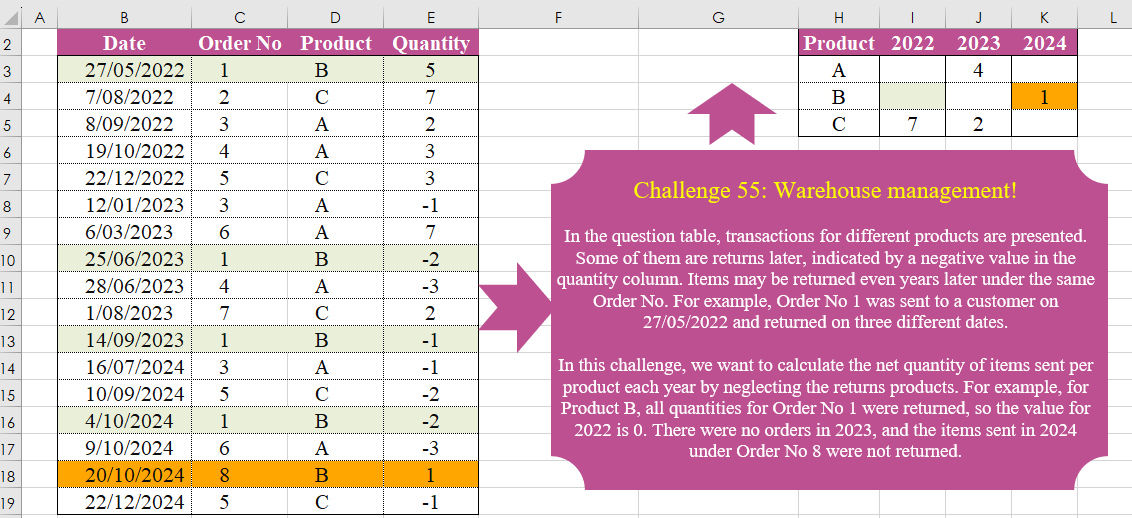
Challenge No. 55: In the question table, transactions for different products are presented.
Solved using:Excel (FILTER, HSTACK, INDEX), Power Query (List.Distinct, Table.Group, Table.Pivot), Python, and R.
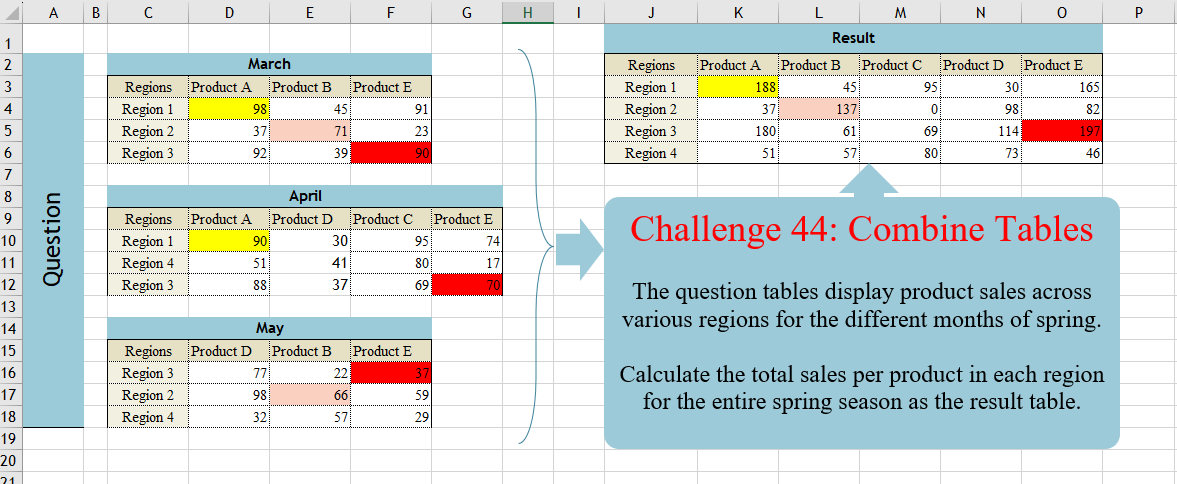
Challenge No. 44: The question tables display product sales across various regions for the different months of spring.
Solved using:Excel (DROP, FILTER, HSTACK), Power Query (List.Distinct, Table.Column, Table.ColumnNames), Python, and R.