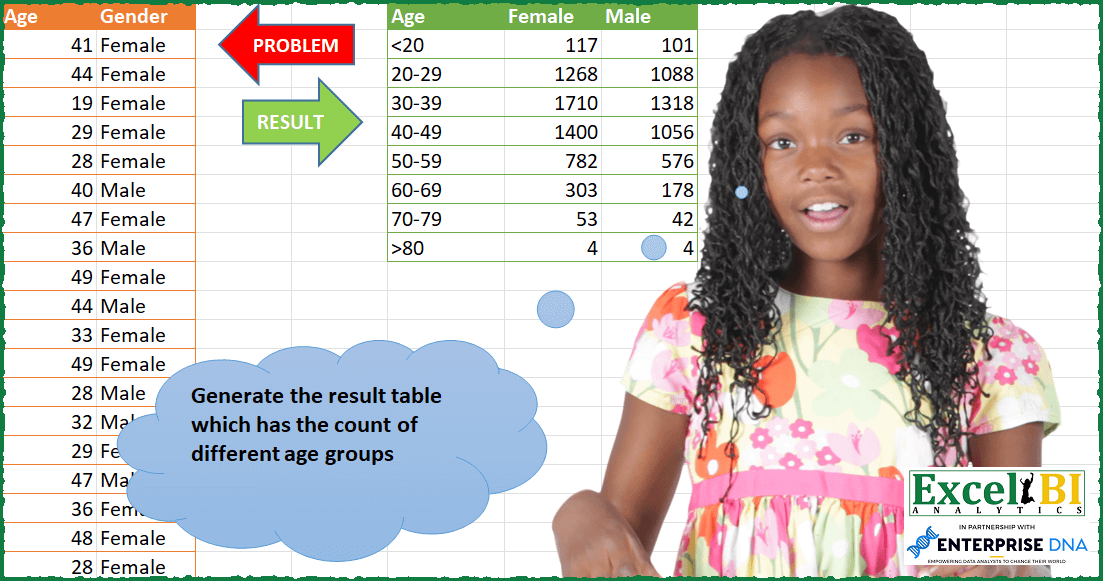
Generate the result table which has the count of different age groups.
📌 Challenge Details and Links
ExcelBI Power Query Challenge Number: 87
Challenge Difficulty: ⭐️⭐️
📥Download Sample File
📥Link to the solutions on LinkedIn
Solving the challenge of Count of People by Age Group with Power Query
Power Query solution 1 for Count of People by Age Group, proposed by Bo Rydobon 🇹🇭:
let
  Source = Excel.CurrentWorkbook(){[Name = "Table1"]}[Content],
  Grouped = Table.Group(
    Table.TransformColumns(Source, {"Age", each Number.IntegerDivide(_, 10) * 10}),
    {"Age", "Gender"},
    {"Count", each Table.RowCount(_)}
  ),
  Pivot = Table.Pivot(Grouped, List.Distinct(Grouped[Gender]), "Gender", "Count"),
  Ans = Table.TransformColumns(
    Pivot,
    {
      "Age",
      each
        if _ = List.Min(Pivot[Age]) then
          "<" & Text.From(_ + 10)
        else if _ = List.Max(Pivot[Age]) then
          ">" & Text.From(_)
        else
          Text.From(_) & "-" & Text.From(_ + 9)
    }
  )
in
  Ans
Power Query solution 2 for Count of People by Age Group, proposed by Zoran Milokanović:
let
  Source = Excel.CurrentWorkbook(){[Name = "Input"]}[Content],
  Brackets = Table.TransformColumns(
    Source,
    {
      "Age",
      each
        let
          a = _ - Number.Mod(_, 10)
        in
          if a < 20 then "<20" else if a >= 80 then ">80" else Text.From(a) & "-" & Text.From(a + 9)
    }
  ),
  Solution = Table.Sort(
    Table.Pivot(Brackets, List.Distinct(Brackets[Gender]), "Gender", "Gender", each List.Count(_)),
    {
      each
        let
          p = Character.ToNumber(Text.Start([Age], 1))
        in
          if p = 60 then 0 else p
    }
  )
in
  Solution
Power Query solution 3 for Count of People by Age Group, proposed by Kris Jaganah:
let
  Source = Excel.CurrentWorkbook(){[Name = "Table1"]}[Content],
  Bracket = Table.AddColumn(
    Source,
    "Age.1",
    each
      if [Age] < 20 then
        "1"
      else if [Age] > 19 and [Age] < 30 then
        "20-29"
      else if [Age] > 29 and [Age] < 40 then
        "30-39"
      else if [Age] > 39 and [Age] < 50 then
        "40-49"
      else if [Age] > 49 and [Age] < 60 then
        "50-59"
      else if [Age] > 59 and [Age] < 70 then
        "60-69"
      else if [Age] > 69 and [Age] < 80 then
        "70-79"
      else
        ">80"
  ),
  Group = Table.Group(Bracket, {"Age.1", "Gender"}, {{"Count", each Table.RowCount(_), Int64.Type}}),
  Pivot = Table.Pivot(Group, List.Distinct(Group[Gender]), "Gender", "Count", List.Sum),
  Replace = Table.ReplaceValue(Pivot, "1", "<20", Replacer.ReplaceText, {"Age.1"}),
  Rename = Table.RenameColumns(Replace, {{"Age.1", "Age"}})
in
  Rename
Power Query solution 4 for Count of People by Age Group, proposed by Alejandro Simón 🇵🇦 🇪🇸:
let
  Source = Excel.CurrentWorkbook(){[Name = "Table1"]}[Content],
  Rango = Table.TransformColumns(
    Source,
    {
      "Age",
      each
        let
          a = Text.Start(Text.From(_), 1) & "0" & "-" & Text.Start(Text.From(_), 1) & "9",
          b =
            if Text.Start(a, 2) = "10" then
              " <20"
            else if Text.Start(a, 2) = "80" then
              ">80"
            else
              a
        in
          b
    }
  ),
  Group = Table.Group(Rango, {"Age", "Gender"}, {{"Count", each Table.RowCount(_)}}),
  Sol = List.Accumulate(
    List.Distinct(Group[Gender]),
    Table.Sort(Table.Distinct(Group[[Age]]), "Age"),
    (s, c) => Table.AddColumn(s, c, each Group{[Gender = c, Age = [Age]]}[Count])
  )
in
  Sol
Power Query solution 5 for Count of People by Age Group, proposed by Alejandro Simón 🇵🇦 🇪🇸:
let
  Source = Excel.CurrentWorkbook(){[Name = "Table1"]}[Content],
  Deca = Table.TransformColumns(Source, {"Age", each Number.RoundDown(_ / 10)}),
  Group = Table.Group(Deca, {"Age", "Gender"}, {{"Count", each Table.RowCount(_)}}),
  Pivot = Table.Pivot(Group, List.Distinct(Group[Gender]), "Gender", "Count"),
  Sol = Table.TransformColumns(
    Pivot,
    {
      "Age",
      each
        if _ = 1 then
          "<20"
        else if _ >= 2 and _ < 8 then
          Text.From(_ * 10) & "-" & Text.From(_) & "9"
        else
          ">80"
    }
  )
in
  Sol
Power Query solution 6 for Count of People by Age Group, proposed by Luan Rodrigues:
let
  Fonte = Tabela1,
  list = {"<20", "20-29", "30-39", "40-49", "50-59", "60-69", "70-79", ">80"},
  add = Table.AddColumn(
    Fonte,
    "Age ",
    each [
      a = [Age],
      b =
        if a < 20 then
          list{0}
        else if a >= 20 and a <= 29 then
          list{1}
        else if a >= 30 and a <= 39 then
          list{2}
        else if a >= 40 and a <= 49 then
          list{3}
        else if a >= 50 and a <= 59 then
          list{4}
        else if a >= 60 and a <= 69 then
          list{5}
        else if a >= 70 and a <= 79 then
          list{6}
        else
          list{7}
    ][b]
  ),
  pv = Table.Pivot(add, List.Distinct(add[Gender]), "Gender", "Age", List.Count),
  res = Table.Sort(pv, each List.PositionOf(list, [#"Age "]))
in
  res
Power Query solution 7 for Count of People by Age Group, proposed by Eric Laforce:
let
  Source = Excel.CurrentWorkbook(){[Name = "tData87"]}[Content],
  Transform_Age = Table.TransformColumns(
    Source,
    {
      "Age",
      each
        let
          _N = Number.IntegerDivide(_, 10)
        in
          if (_N < 2) then 1 else if (_N >= 8) then 8 else _N,
      Int64.Type
    }
  ),
  Group = Table.Group(Transform_Age, {"Age", "Gender"}, {"Count", each Table.RowCount(_)}),
  Pivot = Table.Pivot(Group, List.Distinct(Group[Gender]), "Gender", "Count", List.Sum),
  Set_AgeGrpName = Table.TransformColumns(
    Pivot,
    {
      "Age",
      each
        if (_ = 1) then
          "<20"
        else if (_ = 8) then
          ">=80"
        else
          Text.From(_ * 10) & "-" & Text.From(_ * 10 + 9)
    }
  )
in
  Set_AgeGrpName
Power Query solution 8 for Count of People by Age Group, proposed by Rafael González B.:
let
 Source = Excel.CurrentWorkbook(){[Name="Table1"]}[Content],
 ChT = Table.TransformColumnTypes(Source,{{"Age", Int64.Type}, {"Gender", type text}}),
 TC = Table.Sort(ChT,{{"Age", Order.Ascending}}),
 FxAge = (Ages) => Number.RoundDown(Ages/10),
 TP = Table.FromList(Table.Partition(TC, "Age", 8, FxAge), Splitter.SplitByNothing(), {"TBL"}),
 Range = Table.AddColumn(TP, "Range", each let
 a = Number.From( Text.Start(
 Text.From(Record.Field([TBL][[Age]]{0},"Age")),1)),
 b =   if a <= 1 then "<20"
 else if a >= 8 then ">80"
 else Text.From(a * 10) & "-" & Text.From((a * 10) + 9)
 in
 b
),
Power Query solution 9 for Count of People by Age Group, proposed by Victor Wang:
let
  Source = Excel.CurrentWorkbook(){[Name = "Table1"]}[Content],
  addAgeGroup = Table.AddColumn(
    Source,
    "Custom",
    each
      if [Age] < 20 then
        "<20"
      else if [Age] < 30 then
        "20-29"
      else if [Age] < 40 then
        "30-39"
      else if [Age] < 50 then
        "40-49"
      else if [Age] < 60 then
        "50-59"
      else if [Age] < 70 then
        "60-69"
      else if [Age] < 80 then
        "70-79"
      else
        ">80"
  ),
  Pivot = Table.Pivot(addAgeGroup, {"Female", "Male"}, "Gender", "Age", List.Count),
  Sort = Table.Sort(Pivot, {each List.PositionOf({"<", "0" .. "9", ">"}, Text.Start([Custom], 1))}),
  Rename = Table.RenameColumns(Sort, {{"Custom", "Age"}})
in
  Rename
Power Query solution 10 for Count of People by Age Group, proposed by Roy Wilson:
let
Source=Excel.CurrentWorkbook(){[Name="Table1"]}[Content],ChgTp=Table.TransformColumnTypes(Source,{{"Age",Int64.Type},{"Gender",type text}}),BucketAges=Table.AddColumn(ChgTp,"Bucket",each if[Age]<20then"0-20"elseif[Age]<=29then"20-29"elseif[Age]<=39then"30-39"elseif[Age]=49then"40-49"elseif[Age]=59then"50-59"elseif[Age]=69then"60-69"elseif[Age]=79then"70-79"elseif[Age]>=80then"80-and over"else"Out of range"),GpByGender=Table.Group(BucketAges,{"Bucket","Gender"},{{"Count",eachTable.RowCount(_),Int64.Type}}),SortedRows=Table.Sort(GpByGender,{{"Bucket",Order.Ascending}}),TabSplitOut=let Female=Table.SelectRows(SortedRows,each [Gender]="Female"),GendFemRem=Table.RemoveColumns(Female,"Gender"),
RemFem=Table.RenameColumns(GendFemRem,{"Count","Female"}),Male=Table.SelectRows(SortedRows,each [Gender]="Male"),GendMaleRem=Table.RemoveColumns(Male,"Gender"),RemMale=Table.RenameColumns(GendMaleRem,{"Count","Male"}),JoinTabs= Table.NestedJoin(RemFem,{"Bucket"},RemMale,{"Bucket"},"Male",JoinKind.LeftOuter),Fin=Table.ExpandTableColumn(JoinTabs,"Male",{"Male"},{"Male"}) in Fin,Rep=Table.ReplaceValue(TabSplitOut,"0-20","<20",Replacer.ReplaceText,{"Bucket"}),Rep2=Table.ReplaceValue(Rep"80-and over",">80",Replacer.ReplaceText,{"Bucket"})in Rep2
Power Query solution 11 for Count of People by Age Group, proposed by Alejandra Horvath CPA, CGA:
let
  Source = Excel.CurrentWorkbook(){[Name = "Table1"]}[Content],
  DuplicatedCol = Table.DuplicateColumn(Source, "Age", "Copy"),
  AgedDividedByTen = Table.TransformColumns(
    DuplicatedCol,
    {"Age", each Number.RoundDown(_ / 10), Int64.Type}
  ),
  Pivoted = Table.Pivot(
    AgedDividedByTen,
    List.Distinct(AgedDividedByTen[Gender]),
    "Gender",
    "Copy",
    List.Count
  ),
  Result = Table.TransformColumns(
    Pivoted,
    {
      "Age",
      each
        if _ < 2 then
          "<20"
        else if _ >= 8 then
          ">80"
        else
          Text.From(_ * 10) & "-" & Text.From(_ * 10 + 9)
    }
  )
in
  Result
Solving the challenge of Count of People by Age Group with Excel
Excel solution 1 for Count of People by Age Group, proposed by Bo Rydobon 🇹🇭:
=LET(a,A2:A10001,b,B2:B10001,c,INT(a/10),m,MIN(c),s,SEQUENCE(MAX(c)-m+1,,m)*10,
f,TOROW(UNIQUE(b)),VSTACK(HSTACK(A1,f),
HSTACK(SWITCH(s,MIN(s),"<"&s+10,MAX(s),">"&s,s&"-"&s+9),COUNTIFS(a,">="&s,a,"<="&s+9,b,f))))
Excel solution 2 for Count of People by Age Group, proposed by Bo Rydobon 🇹🇭:
=LET(a,A2:A10001,b,B2:B10001,c,INT(a/10),m,MIN(c),s,SEQUENCE(MAX(c)-m+1,,m)*10,n,MAX(s),
L,LAMBDA(f,FREQUENCY(FILTER(-a,b=f),-s)),
VSTACK(HSTACK(A1,{"Female","Male"}),DROP(HSTACK(SUBSTITUTE(VSTACK("<"&INDEX(s,2),DROP(s&"-"&s+9,1)),n&"-"&n+9,">"&n),L("Female"),L("Male")),-1)))
Excel solution 3 for Count of People by Age Group, proposed by محمد حلمي:
=LET(
a,A2:A112,
u,{"Female","Male"},
e,VSTACK(0,DROP(SEQUENCE(8,,20,10),-1)),
r,VSTACK(19,DROP(DROP(e+9,1),-1),99),
VSTACK(HSTACK(A1,u),HSTACK(e&"-"&r,
COUNTIFS(a,">="&e,a,"<="&r,B2:B112,u))))
Excel solution 4 for Count of People by Age Group, proposed by محمد حلمي:
=LET(u,{"Age","Female","Male"},a,A2:A112,
e,DROP(VSTACK(0,SEQUENCE(8,,20,10)),-1)
,r,VSTACK(19,DROP(DROP(e+9,1),-1),100),VSTACK(u,
HSTACK(e&"-"&r,COUNTIFS(a,">="&e,a,"<="&VSTACK(19,
DROP(DROP(e+9,1),-1),99),B2:B112,DROP(u,,1)))))
Excel solution 5 for Count of People by Age Group, proposed by محمد حلمي:
=LET(a,A2:A112,u,{"Female","Male"},
e,VSTACK(0,DROP(SEQUENCE(8,,20,10),-1)),
r,VSTACK(19,DROP(DROP(e+9,1),-1),99),SUBSTITUTE(SUBSTITUTE(VSTACK(HSTACK(A1,u),HSTACK(e&"-"&r,COUNTIFS(a,">="&e,a,"<="&r,B2:B112,u))),"0-19","<20"),"80-99",">80"))
Excel solution 6 for Count of People by Age Group, proposed by محمد حلمي:
=LET(a,A2:A112,e,DROP(VSTACK(0,SEQUENCE(8,,20,10)),-1),
COUNTIFS(a,">="&e,a,"<="&VSTACK(19,
DROP(DROP(e+9,1),-1),100),B2:B112,E1:F1))
Excel solution 7 for Count of People by Age Group, proposed by 🇰🇷 Taeyong Shin:
=LET(a,DROP(A:.A,1),g,DROP(B:.B,1),f,FLOOR(a,10),m,MIN(f),mx,MAX(f),p,PIVOTBY(f&-(f+9),g,g,ROWS,,0,,0),HSTACK(REGEXREPLACE(TAKE(p,,1),"(^$)|("&m&"-.*)|("&mx&"-.*)","${1:+Age}${2:+<"&m&"}${3:+>"&mx&"}"),DROP(p,,1)))Excel solution 8 for Count of People by Age Group, proposed by 🇰🇷 Taeyong Shin:
=LET(
 age, A2:A10001,
 gen, B2:B10001,
 n, SORT(UNIQUE(QUOTIENT(+age, 10))) * 10,
 Rng, VSTACK(
 "<" & INDEX(n, 2),
 DROP(DROP(n & "-" & n + 9, 1), -1),
 ">" & LOOKUP(100, n)
 ),
 Fx, LAMBDA(x, FREQUENCY(FILTER(age, gen = x), DROP(n + 9, -1))),
 HSTACK(Rng, Fx("Female"), Fx("Male"))
)
Excel solution 9 for Count of People by Age Group, proposed by Kris Jaganah:
=LET(a,A2:A10001,b,B2:B10001,c,FLOOR(a,10),d,IFS(c<20,"<20",c=80,">80",1,c&"-"&c+9),e,UNIQUE(d),f,SORTBY(e,IF(LEFT(e)=">",MID(e,2,1),e)),HSTACK(VSTACK("Age",f),REDUCE({"Female","Male"},f,LAMBDA(x,y,VSTACK(x,HSTACK(SUM((d=y)*(b="Female")),SUM((d=y)*(b="Male"))))))))Excel solution 10 for Count of People by Age Group, proposed by Oscar Mendez Roca Farell:
=LET(_e, A2:A10001,_b, B2:B10001,_u, TOROW(UNIQUE(_b)),_n, MOD(MAX(_e), 10),_i, 10*SEQUENCE(,_n,1,1),_s,_i+9, VSTACK(HSTACK(A1,_u), REDUCE( TOCOL(_i&"-"&_s),_u, LAMBDA(i, x ,LET(_f, FILTER(_e,_b=x), HSTACK(i, TOCOL(BYCOL((_f>=_i)*(_f<=_s), LAMBDA(c, SUM(c))))))))))Excel solution 11 for Count of People by Age Group, proposed by Sunny Baggu:
=LET(
 _age, VSTACK(0, SEQUENCE((80 - 20) / 10 + 1, , 20, 10), 1000),
 _c1, DROP(_age, -1),
 _c2, DROP(_age, 1) - 1,
 HSTACK(
 VSTACK(
 "<" & CHOOSEROWS(_c1, 2),
 DROP(DROP(_c1, 1), -1) & "-" & DROP(DROP(_c1, 1), 1) - 1,
 ">" & TAKE(_c1, -1)
 ),
 DROP(
 REDUCE(
 "",
 UNIQUE(B2:B10001),
 LAMBDA(a, v,
 HSTACK(
 a,
 MAP(_c1, _c2, LAMBDA(a, b, SUM((A2:A10001 <= b) * (A2:A10001 >= a) * (B2:B10001 = v))))
 )
 )
 ),
 ,
 1
 )
 )
)
Excel solution 12 for Count of People by Age Group, proposed by Sunny Baggu:
=LET(_age,VSTACK(0,SEQUENCE((80-20)/10+1,,20,10)),_gender,B2:B10001,
HSTACK(VSTACK("<"&CHOOSEROWS(_age,2),DROP(DROP(_age,1),-1)&"-"&DROP(DROP(_age,1),1)-1,">"&TAKE(_age,-1)),DROP(REDUCE("",UNIQUE(_gender),LAMBDA(x,y,HSTACK(x,DROP(REDUCE("",SEQUENCE(ROWS(_age)),LAMBDA(a,v,VSTACK(a,SUM((A2:A10001>=CHOOSEROWS(_age,v))*IFERROR(A&2:A10001<=(CHOOSEROWS(_age,v+1)-1),1)*(_gender=y))))),1)))),,1)))
Excel solution 13 for Count of People by Age Group, proposed by LEONARD OCHEA 🇷🇴:
=LET(m,COUNTIFS(A:A,"<"&10*SEQUENCE(8,,2),B:B,{"Female";"Male"}),m-VSTACK({0;0},DROP(m,-1)))Excel solution 14 for Count of People by Age Group, proposed by Tolga Demirci, PMP, PMI-ACP, MOS-Expert:
=VSTACK(TEXTSPLIT(TEXTJOIN(" ";;"Age";"Female";"Male");" ");HSTACK(VSTACK("<"&20;SEQUENCE(6;;20;10)&"-"&SEQUENCE(6;;29;10);">"&80);MAP(E2:E9;LAMBDA(a;LET(x;TAKE(TEXTSPLIT(a;{"<";"-";">"});;-1);y;A2:A10001;z;B2:B10001;IF(ISNUMBER(FIND("<";a;1));COUNTIFS(z;"Female";y;"<"&x);IF(ISNUMBER(FIND(">";a;1));COUNTIFS(z;"Female";y;">"&x);COUNTIFS(z;"Female";y;">"&"="&TAKE(TEXTSPLIT(a;{"<";"-";">"});;1);y;"<"&"="&x))))));MAP(E2:E9;LAMBDA(a;LET(x;TAKE(TEXTSPLIT(a;{"<";"-";">"});;-1);y;A2:A10001;z;B2:B10001;IF(ISNUMBER(FIND("<";a;1));COUNTIFS(z;"Male";y;"<"&x);IF(ISNUMBER(FIND(">";a;1));COUNTIFS(z;"Male";y;">"&x);COUNTIFS(z;"Male";y;">"&"="&TAKE(TEXTSPLIT(a;{"<";"-";">"});;1);y;"<"&"="&x))))))))Excel solution 15 for Count of People by Age Group, proposed by Stefan Olsson:
=LET(data, A1:B10001,
female, QUERY({data}, "Where Col2='Female'", 1),
male, QUERY({data}, "Where Col2<>'Female'", 1),
ages, {19;29;39;49;59;69;79},
agelabels, {MAP(ages, LAMBDA(age, IFS(age=MIN(ages),"<"&age+1,TRUE, (age-9)&"-"&age)));">"&MAX(ages)+1},
ffem, FREQUENCY(female, ages),
fmen, FREQUENCY(male, ages),
{{"Age"; agelabels}, {"Female"; ffem}, {"Male"; fmen}}
)
Excel solution 16 for Count of People by Age Group, proposed by Chetan Saini:
=IF(LEN([@[Age Group]])=3,COUNTIFS(Table2[Gender],Table3[[hashtag#Headers],[Female]],Table2[Age],[@[Age Group]]),COUNTIFS(Table2[Gender],Table3[[hashtag#Headers],[Female]],Table2[Age],CONCAT(">=",LEFT([@[Age Group]],2)),Table2[Age],CONCAT("<=",RIGHT([@[Age Group]],2))))Solving the challenge of Count of People by Age Group with Python in Excel
Python in Excel solution 1 for Count of People by Age Group, proposed by Alejandro Campos:
df = xl("A1:B10001", headers=True)
bins = [0] + list(range(20, 81, 10)) + [float('inf')]
labels = ['<20'] + [f'{i}-{i+9}' for i in range(20, 80, 10)] + ['>80']
df['AgeGroup'] = pd.cut(df['Age'], bins=bins, labels=labels, right=False)
result_df = df.groupby(['AgeGroup', 'Gender']).size().unstack(fill_value=0)
 .rename(columns={0: 'Female', 1: 'Male'}).reset_index().rename(columns={'AgeGroup': 'Age'})
result_df.columns.name = None
result_df
&&