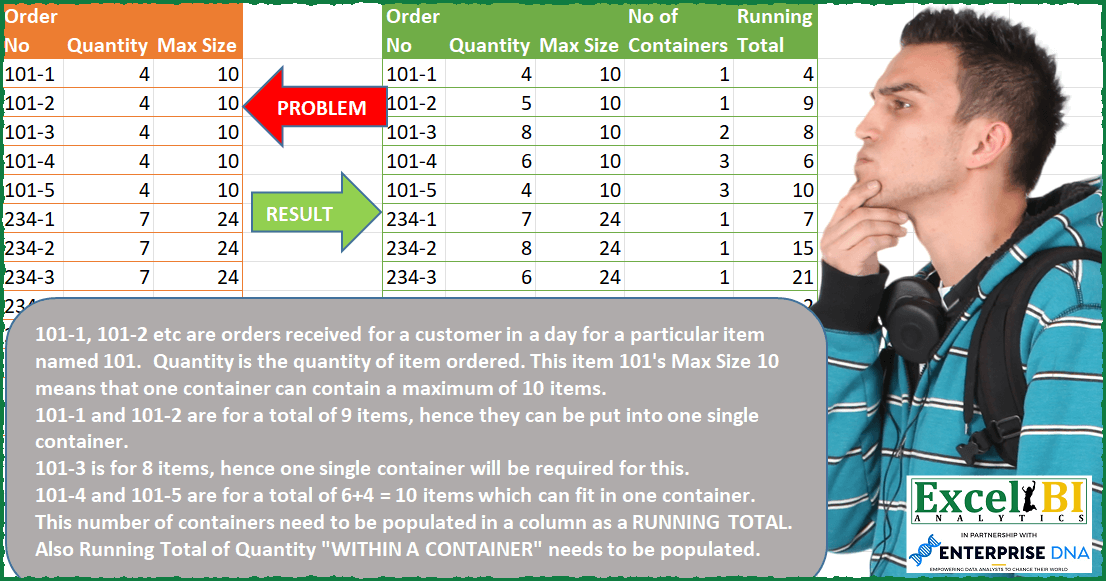
— Input table Quantity data is wrong in picture. I updated Excel file with correct data — 101-1, 101-2 etc. are orders received for a customer in a day for a particular item named 101. Quantity is the quantity of item ordered. This item 101’s Max Size 10 means that one container can contain a maximum of 10 items. 101-1 and 101-2 are for a total of 9 items, hence they can be put into one single container. 101-3 is for 8 items, hence one single container will be required for this. 101-4 and 101-5 are for a total of 6+4 = 10 items which can fit in one container. This number of containers need to be populated in a column as a RUNNING TOTAL. Also Running Total of Quantity “WITHIN A CONTAINER” needs to be populated.
📌 Challenge Details and Links
ExcelBI Power Query Challenge Number: 48
Challenge Difficulty: ⭐️⭐️⭐️⭐️⭐️⭐️
📥Download Sample File
📥Link to the solutions on LinkedIn
Solving the challenge of List Sales Figures Across Dates with Power Query
Power Query solution 1 for List Sales Figures Across Dates, proposed by Bo Rydobon 🇹🇭:
let
  Source = Excel.CurrentWorkbook(){[Name = "Table1"]}[Content],
  Run = Table.FromRows(
    List.RemoveFirstN(
      List.Accumulate(
        {0 .. Table.RowCount(Source) - 1},
        {{0, 0, 0, 0, 0}},
        (s, n) =>
          let
            c = List.Last(s){4},
            v = Source[Quantity]{n},
            d =
              if n = 0 then
                false
              else
                Text.BeforeDelimiter(Source[Order No]{n}, "-")
                  = Text.BeforeDelimiter(Source[Order No]{n - 1}, "-"),
            e = d and c + v <= Source[Max Size]{n}
          in
            s
              & {
                Record.ToList(Source{n})
                  & {if d then List.Last(s){3} + Number.From(not e) else 1, v + Number.From(e) * c}
              }
      ),
      1
    ),
    Table.ColumnNames(Source) & {"No of Containers", "Running Total"}
  )
in
  Run
Power Query solution 2 for List Sales Figures Across Dates, proposed by Aditya Kumar Darak 🇮🇳:
https://gist.github.com/Hermione-Granger-1176/771cd3f26414a3eeb41a51343e44b011Power Query solution 3 for List Sales Figures Across Dates, proposed by Owen Price:
https://gist.github.com/ncalm/93b17f4aafa2d748b93f3760b57040e4Power Query solution 4 for List Sales Figures Across Dates, proposed by Victor Wang:
let
  Source = Excel.CurrentWorkbook(){[Name = "Table1"]}[Content],
  Accum = List.Accumulate(
    Table.ToRecords(Source),
    [Order = "", Nc = {}, Rt = {}],
    (state, current) =>
      if Text.Start(current[Order No], 3) <> state[Order] then
        [
          Order = Text.Start(current[Order No], 3),
          Nc    = state[Nc] & {Number.RoundUp(current[Quantity] / current[Max Size], 0)},
          Rt    = state[Rt] & {current[Quantity]}
        ]
      else if List.Sum({List.Last(state[Rt]), current[Quantity]}) > current[Max Size] then
        [
          Order = Text.Start(current[Order No], 3),
          Nc = state[Nc]
            & {
              List.Sum(
                {List.Last(state[Nc]), Number.RoundUp(current[Quantity] / current[Max Size], 0)}
              )
            },
          Rt = state[Rt] & {current[Quantity]}
        ]
      else
        [
          Order = Text.Start(current[Order No], 3),
          Nc    = state[Nc] & {List.Last(state[Nc])},
          Rt    = state[Rt] & {List.Sum({current[Quantity], List.Last(state[Rt])})}
        ]
  ),
  ToTable = Table.FromColumns(
    Table.ToColumns(Source) & {Accum[Nc]} & {Accum[Rt]},
    Table.ColumnNames(Source) & {"No of Containers", "Running Total"}
  )
in
  ToTable
Solving the challenge of List Sales Figures Across Dates with Excel
Excel solution 1 for List Sales Figures Across Dates, proposed by محمد حلمي:
=LET(
Running_Total,
SCAN(0,B2:B14,LAMBDA(a,d,
IF((a+d>OFFSET(d,,1))+(LEFT(OFFSET(d,,-1),3)<>LEFT(OFFSET(d,-1,-1),3)), d ,  a+d  ))),

seq,SEQUENCE(ROWS(Running_Total)),
Containers,
SCAN(0,seq,LAMBDA(a,d,
IF(LEFT(INDEX(A2:A14,d),3)<>LEFT(INDEX(A1:A13,d),3),1,
IF(INDEX(Running_Total,d)>
INDEX(Running_Total,d-1),a,a+1)))),
HSTACK(Containers,Running_Total))
Excel solution 2 for List Sales Figures Across Dates, proposed by Aditya Kumar Darak 🇮🇳:
=LET(
 _d, A2:C14,
 _seq, SEQUENCE(ROWS(_d)),
 _ord, TEXTBEFORE(TAKE(_d, , 1), "-"),
 _c1, VSTACK(1, DROP(_ord, 1) = DROP(_ord, -1)),
 _e1, LAMBDA(x, y, INDEX(_d, x, y)),
 _e2, LAMBDA(a, b,
 IF(
 AND(INDEX(_c1, b), a + _e1(b, 2) <= _e1(b, 3)),
 a + _e1(b, 2),
 _e1(b, 2)
 )
 ),
 _rt, SCAN(0, _seq, _e2),
 _e3, LAMBDA(a, b,
 IF(INDEX(_c1, b), a + (_e1(b, 2) = INDEX(_rt, b)), 1)
 ),
 _rc, SCAN(0, _seq, _e3),
 _r, HSTACK(_d, _rc, _rt),
 _r
)
Solving the challenge of List Sales Figures Across Dates with SQL
SQL solution 1 for List Sales Figures Across Dates, proposed by Zoran Milokanović:
1/2
WITH /* Microsoft SQL Server 2019 */
DATA_PREP
AS
(
 SELECT
 F.ORDERING
 ,F.ORDER_NO
 ,F."ORDER"
 , F.NO
 ,F.QUANTITY
 ,F.MAX_SIZE
 ,MIN(F.NO) OVER (PARTITION BY F."ORDER") AS MIN_NO
 ,MAX(F.NO) OVER (PARTITION BY F."ORDER") AS MAX_NO
 ,1 AS NO_OF_CONTAINERS
 ,F.QUANTITY AS RUNNING_TOTAL
 FROM
 (
 SELECT
 ROW_NUMBER() OVER (ORDER BY (SELECT 1)) AS ORDERING
 ,D.ORDER_NO
 ,SUBSTRING(D.ORDER_NO, 1, PATINDEX('%-%', D.ORDER_NO) - 1) AS "ORDER"
 ,CAST(SUBSTRING(D.ORDER_NO, PATINDEX('%-%', D.ORDER_NO) + 1, LEN(D.ORDER_NO)) AS DECIMAL) AS NO
 ,D.QUANTITY
 ,D.MAX_SIZE
 FROM DATA D
 ) F
),
&&&