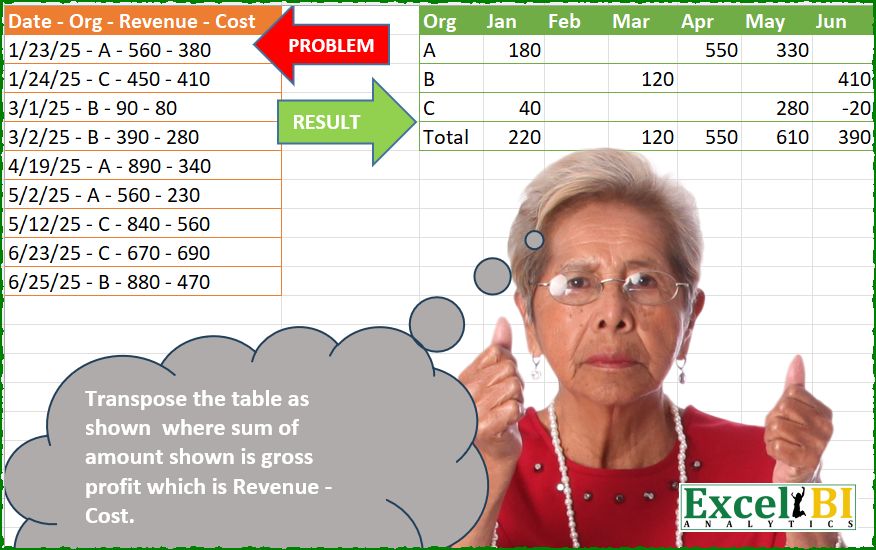
Transpose the table as shown where sum of amount shown is gross profit which is Revenue – Cost.
📌 Challenge Details and Links
ExcelBI Power Query Challenge Number: 278
Challenge Difficulty: ⭐️⭐️
📥Download Sample File
📥Link to the solutions on LinkedIn
Solving the challenge of Transpose table, compute gross profit with Power Query
Power Query solution 1 for Transpose table, compute gross profit, proposed by Kris Jaganah:
let
 A = Excel.CurrentWorkbook(){[Name="Table1"]}[Content],
 B = Table.ColumnNames( A){0},
 C = Table.SplitColumn(A, B, each Text.Split(_," - "),Text.Split( B ," - ")),
 D = List.Transform( C[Date] , each Number.From( Text.Split(_,"/"){0})),
 E = List.Transform( {List.Min(D)..List.Max(D)} ,each Text.Start( Date.MonthName( hashtag#date(2025,_,1)),3)),
 F = Table.TransformColumns( C , {"Date" , each  Text.Start ( Date.MonthName ( Date.FromText(_ ,[Format = "M/d/yy"] )),3)}),
 G = Table.CombineColumns(F,{"Revenue", "Cost"},each Number.From( _{0}) - Number.From( _{1}) ,"Profit"),
 H = Table.Pivot(G, E, "Date", "Profit", List.Sum),
 I = H & Table.AddColumn( Table.Pivot(G[[Date],[Profit]],E, "Date", "Profit", List.Sum), "Org" , each "Total")
in
 I
Power Query solution 2 for Transpose table, compute gross profit, proposed by Luan Rodrigues:
let
 Fonte = Table.TransformColumns(Tabela1,{"Date - Org - Revenue - Cost", each
 let
 a = Text.Split(_," - "),
 b = List.LastN(a,2),
 c = Number.From(b{0}) -Number.From(b{1})
 in
 Table.FromRows({List.FirstN(a,2) & {c}},{"Mes","Org","Valor"})
 })[#"Date - Org - Revenue - Cost"],
 cmb = Table.Combine(Fonte),
 trf = Table.TransformColumns(cmb,{{"Mes", each Date.ToText(Date.From(_,"en-us"),"MMM","en-us") }}),
 pvt = Table.Pivot(trf, List.Distinct(trf[Mes]), "Mes", "Valor", List.Sum),
 res = pvt & hashtag#table(Table.ColumnNames(pvt),{{"Total"} & List.Transform(List.RemoveFirstN(Table.ToColumns(pvt)),List.Sum)})
in
 res
Power Query solution 3 for Transpose table, compute gross profit, proposed by Abdallah Ally:
let
  Source = Excel.CurrentWorkbook(){[Name = "Table1"]}[Content],
  Transform1 = Table.TransformColumns(
    Table.DemoteHeaders(Source),
    {"Column1", each Text.Split(_, " - ")}
  ),
  FromRows = Table.PromoteHeaders(Table.FromRows(Transform1[Column1])),
  Transform2 = Table.TransformColumns(
    FromRows,
    {"Date", each Date.From(_, "en-US"), type date},
    each if Text.Length(_) = 1 then Text.From(_) else Number.From(_)
  ),
  Months = List.Distinct(
    List.Transform(
      List.Dates(
        List.Min(Transform2[Date]),
        Duration.Days(List.Max(Transform2[Date]) - List.Min(Transform2[Date])) + 1,
        Duration.From(1)
      ),
      each Date.ToText(_, "MMM")
    )
  ),
  Transform3 = Table.TransformColumns(Transform2, {"Date", each Date.ToText(_, "MMM")}),
  AddCol = Table.AddColumn(Transform3, "Profit", each [Revenue] - [Cost])[[Date], [Org], [Profit]],
  Pivot = Table.Pivot(AddCol, Months, "Date", "Profit", List.Sum),
  Result = Table.FromRows(
    Table.ToRows(Pivot)
      & [a = Table.ToColumns(Pivot), b = {{"Total"} & List.Transform(List.Skip(a), List.Sum)}][b],
    Table.ColumnNames(Pivot)
  )
in
  Result
Power Query solution 4 for Transpose table, compute gross profit, proposed by Eric Laforce:
let
  Source = Excel.CurrentWorkbook(){[Name = "tData278"]}[Content],
  Transform = Table.FromRecords(
    Table.TransformRows(
      Source,
      each
        let
          a = Text.Split(Record.FieldValues(_){0}, " - ")
        in
          [
            Org = a{1},
            M   = Date.ToText(Date.FromText(a{0}, [Culture = "en-US"]), "MMM"),
            V   = Number.From(a{2}) - Number.From(a{3})
          ]
    )
  ),
  Pivot = Table.Pivot(Transform, List.Distinct(Transform[M]), "M", "V", List.Sum),
  Total = Table.FromRows(
    {{"Total"} & List.Transform(List.Skip(Table.ToColumns(Pivot)), List.Sum)},
    Table.ColumnNames(Pivot)
  ),
  Combine = Pivot & Total
in
  Combine
Power Query solution 5 for Transpose table, compute gross profit, proposed by Antriksh Sharma:
let
 Source = Table.DemoteHeaders ( Table )[Column1],
 A = Table.Combine ( List.TransformMany ( List.Skip ( Source ), (x) => { List.Transform ( Text.Split ( x, " - " ), Value.FromText ) }, (x, y) => let a = List.LastN ( y, 2 ), b = a{0} - a{1} in Table.FromRows ( { List.RemoveLastN ( y, 2 ) & {b} }, {"Date", "Org", "Profit" } ) ) ),
 B = Table.TransformColumns ( A, { "Date", each Text.Start ( Date.MonthName ( _ ), 3 ), type text }),
 C = List.Transform ( { 1.. Date.Month ( List.Max ( A[Date] ) ) }, each Text.Start ( Date.MonthName ( hashtag#date ( 2025, _, 01 ) ), 3 ) ),
 D = Table.FromColumns ( { List.Sort ( List.Distinct ( B[Org] ) ) & { "Total"} }, type table [Org = text] ),
 Acc = List.Accumulate ( C, D, (s, c) => Table.AddColumn ( s, c, (x) => List.Sum ( if x[Org] = "Total" then Table.SelectRows ( B, (y) => y[Date] = c )[Profit] else Table.SelectRows ( B, (y) => y[Date] = c and y[Org] = x[Org] )[Profit] ), type number ) )
in
 Acc
Power Query solution 6 for Transpose table, compute gross profit, proposed by Antriksh Sharma:
let
  Source = Table.DemoteHeaders(Table)[Column1],
  A = Table.Combine(
    List.TransformMany(
      List.Skip(Source),
      (x) => {List.Transform(Text.Split(x, " - "), Value.FromText)},
      (x, y) =>
        let
          a = List.LastN(y, 2),
          b = a{0} - a{1}
        in
          Table.FromRows({List.RemoveLastN(y, 2) & {b}}, {"Date", "Org", "Profit"})
    )
  ),
  B = Table.TransformColumns(A, {"Date", each Date.StartOfMonth(_), type date}),
  C = List.Generate(() => List.Min(B[Date]), each _ <= List.Max(B[Date]), each Date.AddMonths(_, 1)),
  D = Table.FromColumns({List.Sort(List.Distinct(B[Org])) & {"Total"}}, type table [Org = text]),
  E = List.Accumulate(
    C,
    D,
    (s, c) =>
      Table.AddColumn(
        s,
        Date.ToText(c, [Format = "yyyy-MM-dd"]),
        (x) =>
          List.Sum(
            if x[Org] = "Total" then
              Table.SelectRows(B, (y) => y[Date] = c)[Profit]
            else
              Table.SelectRows(B, (y) => y[Date] = c and y[Org] = x[Org])[Profit]
          ),
        type number
      )
  ),
  F = Table.TransformColumnNames(
    E,
    each if _ = "Org" then _ else Text.Start(Date.MonthName(Date.FromText(_)), 3)
  )
in
  F
Power Query solution 7 for Transpose table, compute gross profit, proposed by Antriksh Sharma:
let
 Source = Table.DemoteHeaders ( Table ),
 Split = Table.PromoteHeaders ( Table.SplitColumn ( Source, "Column1", Splitter.SplitTextByDelimiter(" - ", QuoteStyle.Csv), {"Column1.1", "Column1.2", "Column1.3", "Column1.4"} ) ),
 ChangedType = Table.TransformColumnTypes ( Split,{{"Date", type date}, {"Org", type text}, {"Revenue", Int64.Type}, {"Cost", Int64.Type}} ),
 Profit = Table.AddColumn ( ChangedType, "Profit", each [Revenue] - [Cost], Int64.Type )[[Date], [Org], [Profit]],
 MonthName = Table.TransformColumns ( Profit, { "Date", each Text.Start ( Date.MonthName ( _ ), 3 ), type text } ),
 Pivot = Table.Pivot ( MonthName, List.Distinct ( MonthName[Date] ), "Date", "Profit", List.Sum ),
 AllMonths = List.Transform ( { 1.. Date.Month ( List.Max ( ChangedType[Date] ) ) }, each Text.Start ( Date.MonthName ( hashtag#date ( 2025, _, 01 ) ), 3 ) ),
 Total = let a = List.Transform ( AllMonths, each List.Sum ( (try Table.Column ( Pivot, _ ) otherwise {}) ) ), b = Table.FromRows ( { { "Total" } & a }, {"Org"} & AllMonths ) in b,
 Append = Table.SelectColumns ( Pivot & Total, {"Org" } & AllMonths )
in
 Append
Power Query solution 8 for Transpose table, compute gross profit, proposed by Alexandre Garcia:
let
U = Excel.CurrentWorkbook(){[Name="Table1"]}[Content],
H = {Table.ColumnNames, Number.From, List.Transform, (x)=> Date.From(x, "en-US"), (x)=> Date.ToText(x, [Format = "MMM"])},
P = Table.SplitColumn(U, H{0}(U){0}, each ((x)=> {((y)=> H{4}(y) meta [x = Date.Month(y)]) (H{3}(x{0})), x{1}} & {H{1}(x{2}) - H{1}(x{3})}) (Text.Split(_, " - ")), {"x","Org","z"}),
L = ((x)=> H{2}({List.Min(x)..List.Max(x)}, each H{4}(H{3}(Text.From(_) & "/25")))) (H{2}(P[x], each Value.Metadata(_)[x])),
C = ((x)=> x & hashtag#table(H{0}(x), {{"Total"} & List.Accumulate(L, {}, (s,c)=> s & {List.Sum(Table.Column(x,c))})})) (Table.Pivot(P, L, "x", "z", List.Sum))
in C
Power Query solution 9 for Transpose table, compute gross profit, proposed by Maciej Kopczyński:
let
 source = Excel.CurrentWorkbook(){[Name="tblStart"]}[Content],
 A = Table.SplitColumn(source, "Kolumna1", Splitter.SplitTextByDelimiter(" - ")),
 B = Table.PromoteHeaders(A),
 C = Table.TransformColumnTypes(B, {{"Date", type date}, {"Revenue", Int64.Type}, {"Cost", Int64.Type}}, "en-US"),
 D = Table.AddColumn(C, "Value", each [Revenue] - [Cost], Int64.Type),
 E = Table.TransformColumns(D, {{"Date", each Text.Upper(Text.Start(Date.MonthName(_, "en-US"), 3)), type text}}),
 F = E[[Date], [Org], [Value]],
 G = Table.Pivot(F, List.Transform(List.Select(List.Generate(() => hashtag#date(2025,1,1), each _ <= hashtag#date(2025, 12, 1), each Date.AddMonths(_, 1)), each Date.Month(_) <= List.Max(List.Transform(D[Date], each Date.Month(_)))), each Text.Upper(Text.Start(Date.MonthName(_, "en-US"), 3))), "Date", "Value", List.Sum),
 H = Table.ColumnNames(G),
 I = Table.Transpose(Table.AddColumn(Table.Transpose(G), "Total", each try List.Sum(Record.ToList(_)) otherwise "Total"), H)
in
 I
Solving the challenge of Transpose table, compute gross profit with Excel
Excel solution 1 for Transpose table, compute gross profit, proposed by Bo Rydobon 🇹🇭:
=LET(
    a,
    A2:A10,
    R,
    REGEXEXTRACT,
    V,
    VSTACK,
    m,
    --R(
        a,
        "d+"
    ),
    s,
    SEQUENCE(
        MAX(
            m
        )
    ),

    V(
        TOROW(
            V(
                "Org",
                TEXT(
                    s*29,
                    "mmm"
                )
            )
        ),
        DROP(
            PIVOTBY(
                V(
                    R(
                        a,
                        "pl+"
                    ),
                    s*0
                ),
                V(
                    m,
                    s
                ),
                V(
                    R(
                        a,
                        " d+"
                    )-R(
                        a,
                        "d+$"
                    ),
                    s*0
                ),
                SUM
            ),
            2,
            -1
        )
    )
)
Excel solution 2 for Transpose table, compute gross profit, proposed by Kris Jaganah:
=LET(a,
    A2:A10,
    b,
    --TEXTSPLIT(
        a,
        "/"
    ),
    c,
    MMULT(
        --TEXTSPLIT(
            TEXTAFTER(
                a,
                "- ",
                {2,
                3}
            ),
            ,
            "- "
        ),
        {1;-1}
    ),
    d,
    TRIM(
        MID(
            a,
            10,
            2
        )
    ),
    e,
    SEQUENCE(
        ,
        MAX(
            b
        )-MIN(
            b
        )+1
    ),
    f,
    TEXT(
        e*28,
        "mmm"
    ),
    g,
    SORT(
        UNIQUE(
            d
        )
    ),
    h,
    MAKEARRAY(ROWS(
        g
    ),
    MAX(
            b
        ),
    LAMBDA(x,
    y,
    SUM(FILTER(c,
    (b=y)*(CODE(
            d
        )-64=x),
    0)))),
    HSTACK(
        VSTACK(
            "Org",
            g,
            "Total"
        ),
        VSTACK(
            f,
            h,
            BYCOL(
                h,
                SUM
            )
        )
    ))
Excel solution 3 for Transpose table, compute gross profit, proposed by Duy Tùng:
=LET(
    F,
    TEXTBEFORE,
    R,
    TEXTAFTER,
    p,
    " - ",
    a,
    A2:A10,
    b,
    TEXTSPLIT(
        a,
        "/"
    )*1,
    c,
    SEQUENCE(
        ,
        MAX(
            b
        )
    ),
    u,
    GROUPBY(
        F(
            R(
                a,
                p,
                1
            ),
            p
        ),
        IF(
            b=c,
            F(
                R(
                    a,
                    p,
                    2
                ),
                p
            )-R(
                a,
                p,
                -1
            ),
            ""
        ),
        SUM
    ),
    VSTACK(
        HSTACK(
            "Org",
            TEXT(
                c*29,
                "[$-en]mmm"
            )
        ),
        IF(
            u=0,
            "",
            u
        )
    )
)

#2: =LET(
    V,
    VSTACK,
    H,
    HSTACK,
    R,
    TEXTAFTER,
    k,
    "[$-en]mmm",
    p,
    " - ",
    a,
    A2:A10,
    b,
    TEXTSPLIT(
        a,
        "/"
    )*1,
    f,
    LAMBDA(
        v,
        TEXTBEFORE(
            R(
                a,
                p,
                v
            ),
            p
        )
    ),
    c,
    TEXT(
        SEQUENCE(
        ,
        MAX(
            b
        )
    )*29,
        k
    ),
    u,
    REDUCE(
        H(
            "Org",
            c
        ),
        SORT(
            UNIQUE(
                f(
                    1
                )
            )
        ),
        LAMBDA(
            x,
            y,
            IFNA(
                V(
                    x,
                    H(
                        y,
                        VLOOKUP(
                            c,
                            GROUPBY(
                                TEXT(
                                    b*29,
                                    k
                                ),
                                f(
                                    2
                                )-R(
                a,
                p,
                -1
            ),
                                SUM,
                                ,
                                ,
                                ,
                                f(
                    1
                )=y
                            ),
                            2,

                        )
                    )
                ),
                ""
            )
        )
    ),
    V(
        u,
        H(
            "Total",
            DROP(
                BYCOL(
                    u,
                    SUM
                ),
                ,
                1
            )
        )
    )
)
Excel solution 4 for Transpose table, compute gross profit, proposed by Sunny Baggu:
=LET(

     _t,
     TEXTBEFORE(
         TEXTAFTER(
             " - " & A2:A10,
              " - ",
              SEQUENCE(
                  ,
                   4
              )
         ) & " - ",
          " - "
     ),

     _d,
     CHOOSECOLS(
         _t,
          1
     ),

     _m,
     TEXT(
         _d,
          "mmm"
     ),

     _o,
     CHOOSECOLS(
         _t,
          2
     ),

     _uo,
     SORT(
         UNIQUE(
             _o
         )
     ),

     _h,
     TOROW(
         TEXT(
             DATE(
                 2025,
                  SEQUENCE(
                      MAX(
                          MONTH(
                              _d
                          )
                      )
                  ),
                  1
             ),
              "mmm"
         )
     ),

     _v,
     MAP(

          _uo & _h,

          LAMBDA(
              a,
               SUM(
                   FILTER(
                       TAKE(
                           _t,
                            ,
                            -2
                       ),
                        _o & _m = a
                   ) * {1,
           &         -1}
               )
          )

     ),

     _vt,
     BYCOL(
         IFERROR(
             _v,
              0
         ),
          LAMBDA(
              a,
               SUM(
                   a
               )
          )
     ),

     IFERROR(

          VSTACK(
              VSTACK(
                  HSTACK(
                      "Org",
                       _h
                  ),
                   HSTACK(
                       _uo,
                        _v
                   )
              ),
               HSTACK(
                   "Total",
                    _vt
               )
          ),

          ""

     )

)
Excel solution 5 for Transpose table, compute gross profit, proposed by LEONARD OCHEA 🇷🇴:
=LET(
    d,
    TEXTSPLIT(
        CONCAT(
            A2:A10&"|"
        ),
        " - ",
        "|",
        1
    ),
    C,
    CHOOSECOLS,
    V,
    VSTACK,
    E,
    IFERROR,
    m,
    MONTH(
        --C(
            d,
            1
        )
    ),
    s,
    MIN(
        m
    ),
    o,
    C(
        d,
        2
    ),
    n,
    V(
        m,
        E(
            UNIQUE(
                V(
                    m,
                    SEQUENCE(
                        MAX(
        m
    )-s+1,
                        ,
                        s
                    )
                ),
                ,
                1
            ),
            0
        )
    ),
    E(
        DROP(
            PIVOTBY(
                E(
                    IF(
                        n,
                        o
                    ),
                    @o
                ),
                HSTACK(
                    n,
                    TEXT(
                        n*29,
                        "mmm"
                    )
                ),
                IF(
                    n,
                    C(
                        d,
                        3
                    )-C(
                        d,
                        4
                    )
                ),
                SUM,
                ,
                ,
                ,
                0,
                ,
                n
            ),
            1
        ),
        ""
    )
)

Edited for cases where we have all consecutive months (or not) ,
     they start with January (or not)
Excel solution 6 for Transpose table, compute gross profit, proposed by Md. Zohurul Islam:
=LET(
v,
    DROP(
        REDUCE(
            "",
            A2:A10,
            LAMBDA(
                x,
                y,
                VSTACK(
                    x,
                    TEXTSPLIT(
                        y,
                        " - "
                    )
                )
            )
        ),
        1
    ),

w,
    BYROW(
        TAKE(
            v,
            ,
            -2
        )*{1,
        -1},
        SUM
    ),

z,
    MAP(
        TAKE(
            v,
            ,
            1
        ),
        LAMBDA(
            x,
            --TEXTJOIN(
                "/",
                ,
                CHOOSECOLS(
                    TEXTSPLIT(
                        x,
                        "/"
                    ),
                    2,
                    1,
                    3
                )
            )
        )
    ),

a,
    TOROW(
        TEXT(
            DATE(
                YEAR(
                    TODAY()
                ),
                SEQUENCE(
                    MONTH(
                        MAX(
                            z
                        )
                    )
                ),
                1
            ),
            "mmm"
        )
    ),

b,
    CHOOSECOLS(
        v,
        2
    ),

d,
    MAP(UNIQUE(
        SORT(
            b
        )
    )&a,
    LAMBDA(x,
    SUM(IF((b&TEXT(
        z,
        "mmm"
    ))=x,
    w,
    0)))),

e,
    BYCOL(
        d,
        SUM
    ),

f,
    VSTACK(
        "Org",
        UNIQUE(
        SORT(
            b
        )
    ),
        "Total"
    ),

g,
    HSTACK(
        f,
        VSTACK(
            a,
            d,
            e
        )
    ),

IF(
    g=0,
    "",
    g
))
Excel solution 7 for Transpose table, compute gross profit, proposed by Eric Laforce:
=LET(

     x,
     REGEXEXTRACT(
         A2:A10,
          {"^d+",
          "pl",
          " d+(?= )",
          "d+$"}
     ),

     p,
     PIVOTBY(

          INDEX(
              x,
               ,
               2
          ),

          TEXT(
              DATE(
                  1900,
                   TAKE(
                       x,
                        ,
                        1
                   ),
                   1
              ),
               {"m",
               "mmm"}
          ),

          MMULT(
              --DROP(
              x,
               ,
               2
          ),
               {1; -1}
          ),

          SUM,
         ,
         ,
         ,
         0
     ),

     VSTACK(
         HSTACK(
             {"Org"},
              DROP(
                  INDEX(
                      p,
                       2
                  ),
                   0,
                   1
              )
         ),
          DROP(
                      p,
                       2
                  )
     )

)
Excel solution 8 for Transpose table, compute gross profit, proposed by ferhat CK:
=LET(
    t,
    TAKE,
    q,
    DROP,
    w,
    SEQUENCE,
    a,
    q(
        REDUCE(
            0,
            A2:A10,
            LAMBDA(
                x,
                y,
                VSTACK(
                    x,
                    TEXTSPLIT(
                        y,
                        " - "
                    )
                )
            )
        ),
        1
    ),
    b,
    IF(
        INDEX(
            a,
            ,
            1
        )=a,
        TEXTBEFORE(
            a,
            "/"
        ),
        a
    ),
    c,
    PIVOTBY(
        CHOOSECOLS(
            b,
            2
        ),
        --t(
            b,
            ,
            1
        ),
        BYROW(
            TAKE(
                b,
                ,
                -2
            )*{1,
            -1},
            SUM
        ),
        SUM,
        ,
        ,
        ,
        0
    ),
    d,
    q(
        c,
        ,
        1
    ),
    r,
    MAX(
        t(
            d,
            1
        )
    ),
    e,
    CHOOSECOLS(
        d,
        IFNA(
            XMATCH(
                w(
                    r
                ),
                t(
            d,
            1
        )
            ),
            1
        )
    ),
    VSTACK(
        HSTACK(
            "Org",
            TEXT(
                EOMONTH(
                    "1.12.25",
                    w(
                        ,
                        r
                    )
                ),
                "mmm"
            )
        ),
        HSTACK(
            q(
                t(
        c,
        ,
        1
    ),
                1
            ),
            q(
                IF(
                    t(
                        e,
                        1
                    )=w(
                        ,
                        r
                    ),
                    e,
                    ""
                ),
                1
            )
        )
    )
)
Excel solution 9 for Transpose table, compute gross profit, proposed by Jaroslaw Kujawa:
=LET(ch;CHOOSECOLS;y;DROP(REDUCE("";VSTACK("2/23/25 - A - - ";A2:A10);LAMBDA(a;x;VSTACK(a;TEXTSPLIT(x;" - "))));1);yg;GROUPBY(HSTACK(ch(y;2);LEFT((ch(y;1))));ch(y;3)-ch(y;4);SUM;;0);yp;IFERROR(PIVOTBY(ch(yg;1);ch(yg;2);ch(yg;3);SUM;;;;0);"");VSTACK(IF(LEN(TAKE(yp;1));TEXT(TAKE(yp;1)&"/1";"MMM");"Org");DROP(yp;1)))Excel solution 10 for Transpose table, compute gross profit, proposed by Tolga Demirci, PMP, PMI-ACP, MOS-Expert:
=LET(w,
    A2:A10,
    LET(z,
    BYROW(
        w,
        LAMBDA(
            x,
            TAKE(
                TAKE(
                    TEXTSPLIT(
                        x,
                        "-"
                    ),
                    ,
                    2
                ),
                ,
                -1
            )
        )
    ),
    LET(p,
    VALUE(TRANSPOSE(TEXTSPLIT(TEXTJOIN(,
    ,
    BYCOL(DROP(
        HSTACK(
            "Org",
            TOROW(
                LET(
                    q,
                    DATEVALUE(
                        TEXTSPLIT(
                            w,
                            "-"
                        )
                    ),
                    UNIQUE(
                        TEXT(
                            SEQUENCE(
                                MAX(
                                    q
                                )-MIN(
                                    q
                                )+1,
                                ,
                                MIN(
                                    q
                                ),
                                1
                            ),
                            "Mmm"
                        )
                    )
                )
            )
        ),
        ,
        1
    ),
    LAMBDA(b,
    TEXTJOIN(",",
    ,
    BYROW(TRIM(
        SORT(
            UNIQUE(
                z
            )
        )
    ),
    LAMBDA(a,
    SUM(IFERROR(FILTER(BYROW(
        w,
        LAMBDA(
            x,
            LET(
                i,
                VALUE(
                    DROP(
                        TEXTSPLIT(
                            x,
                            "-"
                        ),
                        ,
                        2
                    )
                ),
                TAKE(
                    i,
                    ,
                    1
                )-TAKE(
                    i,
                    ,
                    -1
                )
            )
        )
    ),
    ((b=TRIM(
        BYROW(
            w,
            LAMBDA(
                x,
                TEXT(
                    TAKE(
                        TEXTSPLIT(
                            x,
                            "-"
                        ),
                        ,
                        1
                    ),
                    "Mmm"
                )
            )
        )
    ))*(a=TRIM(
                z
            )))>0),
    0)))))&"/"))),
    ",",
    "/",
    TRUE))),
    VSTACK(
        VSTACK(
            HSTACK(
                "Org",
                TOROW(
                    LET(
                        q,
                        DATEVALUE(
                            TEXTSPLIT(
                                w,
                                "-"
                            )
                        ),
                        UNIQUE(
                            TEXT(
                                SEQUENCE(
                                MAX(
                                    q
                                )-MIN(
                                    q
                                )+1,
                                ,
                                MIN(
                                    q
                                ),
                                1
                            ),
                                "Mmm"
                            )
                        )
                    )
                )
            ),
            HSTACK(
                TRIM(
        SORT(
            UNIQUE(
                z
            )
        )
    ),
                p
            )
        ),
        HSTACK(
            "Total",
            BYCOL(
                p,
                LAMBDA(
                    o,
                    SUM(
                        o
                    )
                )
            )
        )
    ))))
Excel solution 11 for Transpose table, compute gross profit, proposed by LUIS FLORENTINO COUTO CORTEGOSO:
=LET(
    C,
    CHOOSECOLS,
    m,
    TEXTAFTER(
        " - "&TEXTBEFORE(
            A2:A10&" - ",
            "-",
            {1,
            2,
            3,
            4}
        ),
        "-",
        {1,
        2,
        3,
        4}
    ),
    n,
    IF(
        {0,
        1,
        1,
        1},
        m,
        MONTH(
            DATEVALUE(
                m
            )
        )
    ),
     r,
    HSTACK(
        PIVOTBY(
            C(
                n,
                2
            ),
            C(
                n,
                1
            ),
            BYROW(
                --C(
                    n,
                    {3;4}
                )*{1,
                -1},
                SUM
            ),
            SUM,
            ,
            ,
            ,
            0
        ),
        2
    ),
     s,
    IFNA(
        SORTBY(
            r,
            TAKE(
                SUBSTITUTE(
                    r,
                    "",
                    0
                ),
                1
            )
        ),
        ""
    ),
    IFNA(
        IFS(
            {1;0;0;0;0},
            HSTACK(
                "Org",
                TEXT(
                    SEQUENCE(
                        ,
                        6
                    )&"/25",
                    "mmm"
                )
            )
        ),
        s
    )
)
Excel solution 12 for Transpose table, compute gross profit, proposed by Fredson Alves Pinho:
=LET(
    tb,
    MAP(
        A2:A10,
        LAMBDA(
            x,
            LAMBDA(
                c,
                INDEX(
                    TEXTSPLIT(
                        x,
                        " - "
                    ),
                    1,
                    c
                )
            )
        )
    ),
    DROP(
        PIVOTBY(
            tb(
                2
            ),
            TEXT(
                tb(
                    1
                ),
                {"mm",
                "[$-409]mmm"}
            ),
            tb(
                3
            )-tb(
                4
            ),
            SUM,
            ,
            ,
            ,
            0,
            1
        ),
        1
    )
)
Excel solution 13 for Transpose table, compute gross profit, proposed by Manuel Reyes:
=LET(
    cuadro,
    TEXTSPLIT(
        TEXTJOIN(
            "%",
            1,
            A2:A10
        ),
        "-",
        "%"
    ),
    conso1,
    TEXT(
        DATE(
            1900,
            TAKE(
                LEFT(
                    cuadro
                ),
                ,
                1
            ),
            1
        ),
        {"m",
        "mmm"}
    ),
    conso2,
    CHOOSECOLS(
        cuadro,
        2
    ),
    conso3,
    --CHOOSECOLS(
        cuadro,
        3
    ),
    conso4,
    --CHOOSECOLS(
        cuadro,
        4
    ),
    DROP(
        PIVOTBY(
            conso2,
            conso1,
            conso3-conso4,
            SUM
        ),
        1,
        -1
    )
)
Solving the challenge of Transpose table, compute gross profit with Python
Python solution 1 for Transpose table, compute gross profit, proposed by Konrad Gryczan, PhD:
import pandas as pd
import numpy as np
from datetime import datetime
path = "PQ_Challenge_278.xlsx"
input_data = pd.read_excel(path, usecols="A", nrows=10)
test = pd.read_excel(path, usecols="C:I", nrows=4).fillna(0)
test = test.apply(lambda col: col.astype('int64') if col.dtypes == 'float64' else col)
input_data[['Date', 'Org', 'Revenue', 'Cost']] = input_data.iloc[:, 0].str.split(' - ', expand=True)
input_data['profit'] = pd.to_numeric(input_data['Revenue'], errors='coerce').fillna(0) - pd.to_numeric(input_data['Cost'], errors='coerce').fillna(0)
input_data['month'] = pd.to_datetime(input_data['Date'], errors='coerce').dt.strftime('%b').astype(pd.CategoricalDtype(categories=["Jan", "Feb", "Mar", "Apr", "May", "Jun"], ordered=True))
input_data.drop(columns=[input_data.columns[0], 'Revenue', 'Cost', 'Date'], inplace=True)
result = input_data.pivot_table(
 index='Org', columns='month', values='profit', aggfunc='sum', fill_value=0
).reset_index()
total_row = pd.DataFrame([{
 'Org': 'Total',
 **{month: result[month].sum() for month in ["Jan", "Feb", "Mar", "Apr", "May", "Jun"]}
}])
res = pd.concat([result, total_row], ignore_index=True).fillna(0)
print(res.equals(test))
Python solution 2 for Transpose table, compute gross profit, proposed by Luan Rodrigues:
import pandas as pd
file = r"PQ_Challenge_278.xlsx"
df = pd.read_excel(file,usecols="A")
df[['Mes', 'Org', 'Valor1', 'Valor2']] = df['Date - Org - Revenue - Cost'].str.split(' - ', expand=True)
del df['Date - Org - Revenue - Cost']
df['Valor'] = df['Valor1'].astype(int) - df['Valor2'].astype(int)
d&f['Mes'] = pd.to_datetime(df['Mes']).dt.strftime('%b')
pvt = pd.pivot_table(df,index='Org',columns='Mes',values='Valor',aggfunc='sum',sort=False).reset_index()
soma = pvt.iloc[:, 1:].sum()
total = pd.DataFrame([["Total"] + soma.tolist()], columns=pvt.columns.tolist())
res = pd.concat([pvt, total], ignore_index=True)
res = res.sort_values(by='Org')
print(res)
Python solution 3 for Transpose table, compute gross profit, proposed by Claudiu B.:
import pandas as pd
df = pd.read_csv(r"pivoting.csv", sep=' - ', engine='python')
df['Date'] = pd.to_datetime(df['Date'])
df['Month'] = '0' + df['Date'].dt.month.astype('str') + '-' + df['Date'].dt.strftime("%b")
df['Gross_profit'] = df['Revenue'] - df['Cost']
df_pivot = (df
 .pivot_table(index='Org', columns='Month', values='Gross_profit', aggfunc='sum', margins=True, margins_name='Total')
 .reset_index()
 .fillna('')
 )
df2 = df_pivot.iloc[:, 0:-1]
export = df2.to_excel("agg_data_table.xlsx", index=None)
export
Solving the challenge of Transpose table, compute gross profit with Python in Excel
Python in Excel solution 1 for Transpose table, compute gross profit, proposed by Alejandro Campos:
data = xl("A2:A10")[0]
split_data = [row.split(" - ") for row in data]
df = pd.DataFrame(split_data, columns=["Date", "Org", "Revenue", "Cost"])
df["Revenue"], df["Cost"] = pd.to_numeric(df["Revenue"]), pd.to_numeric(df["Cost"])
df['Gross Profit'], df['Month'] = df['Revenue'] - df['Cost'], pd.to_datetime(df['Date']).dt.strftime('%b')
pivot_table = df.pivot_table(values='Gross Profit', index='Org', columns='Month',
 aggfunc='sum', fill_value=0).reindex(columns=['Jan', 'Feb', 'Mar', 'Apr', 'May', 'Jun'])
pivot_table.loc['Total'] = pivot_table.sum()
pivot_table = pivot_table.replace(0, "").reset_index().fillna('')
pivot_table.columns.name = None
pivot_table
Python in Excel solution 2 for Transpose table, compute gross profit, proposed by Francesco Bianchi 🇮🇹:
df = xl("A1:A10", headers=False)
df = df[0].str.split(' - ', expand=True)
df.columns = df.iloc[0]
df = df[1:].reset_index(drop=True)
df['StartOfMonth'] = pd.to_datetime(df['Date'], format='%m/%d/%y', errors='coerce').dt.to_period('M').dt.start_time
df['Profit'] = pd.to_numeric(df['Revenue'], errors='coerce') - pd.to_numeric(df['Cost'], errors='coerce')
start_of_all_months = pd.date_range(start=df['StartOfMonth'].min(), end=df['StartOfMonth'].max(), freq='MS')
df_months_set = set(df['StartOfMonth'].dropna())
missing_months = set(start_of_all_months) - df_months_set
for month in missing_months:
 df = pd.concat([df, pd.DataFrame({'StartOfMonth': [month]})], ignore_index=True)
pivot_df = df.pivot_table(index='Org', columns='StartOfMonth', values='Profit', aggfunc='sum',dropna=False)
pivot_df.columns = pivot_df.columns.month_name().str[:3]
pivot_df.drop(index=np.nan, inplace=True, errors='ignore')
pivot_df.loc['Total'] = pivot_df.sum(numeric_only=True)
pivot_df = pivot_df.reset_index(drop=False)
pivot_df.columns.name = None
pivot_df.replace(np.nan, '', inplace=True)
pivot_df
Solving the challenge of Transpose table, compute gross profit with R
R solution 1 for Transpose table, compute gross profit, proposed by Konrad Gryczan, PhD:
library(tidyverse)
library(readxl)
library(janitor)
path = "Power Query/PQ_Challenge_278.xlsx"
input = read_excel(path, range = "A1:A10")
test = read_excel(path, range = "C1:I5") %>%
 mutate(across(-c(1), ~replace_na(as.numeric(.x), 0)))
result = input %>%
 separate(col = 1, into = c("Date", "Org", "Revenue", "Cost"), sep = " - ", extra = "merge",convert = TRUE) %>%
 mutate(profit = Revenue - Cost,
 month = month(mdy(Date), label = TRUE, abbr = TRUE, locale = "en_US.UTF-8"),
 month = factor(month, ordered = T, levels = c("Jan", "Feb", "Mar", "Apr", "May", "Jun")
 )) %>%
 select(-c(Revenue, Cost, Date)) %>%
 arrange(Org) %>%
 pivot_wider(names_from = month, values_from = profit, values_fn = sum, names_expand = TRUE)
res = result %>%
 add_row(Org = "Total",
 `Jan` = sum(result$Jan, na.rm = TRUE),
 `Feb` = sum(result$Feb, na.rm = TRUE),
 `Mar` = sum(result$Mar, na.rm = TRUE),
 `Apr` = sum(result$Apr, na.rm = TRUE),
 `May` = sum(result$May, na.rm = TRUE),
 `Jun` = sum(result$Jun, na.rm = TRUE)) %>%
 mutate(across(-Org, ~replace_na(.x, 0)))
all.equal(res, test)
#> [1] TRUE
&