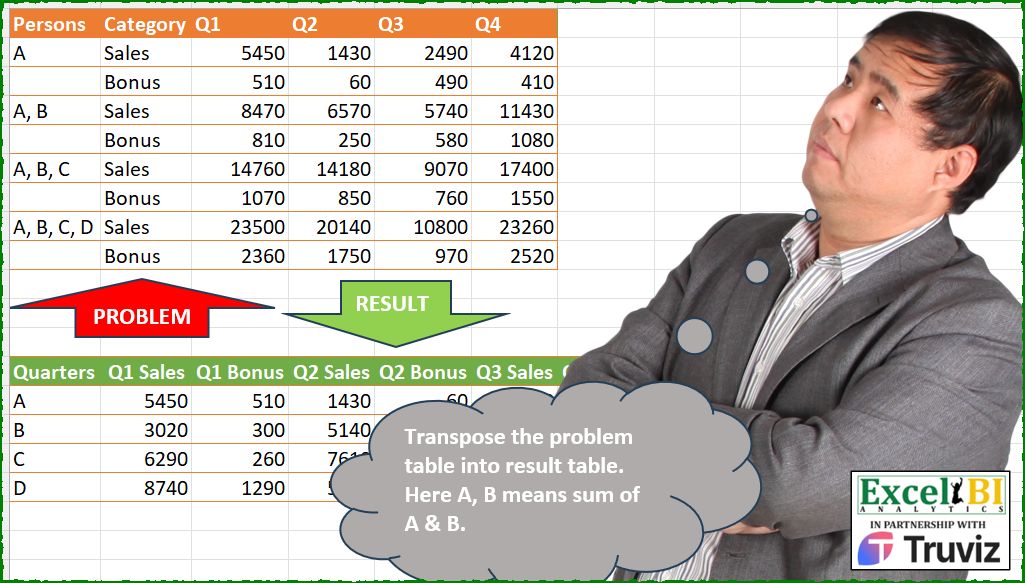
Transpose the problem table into result table. Here A, B means sum of A & B.
📌 Challenge Details and Links
ExcelBI Power Query Challenge Number: 248
Challenge Difficulty: ⭐️⭐️
📥Download Sample File
📥Link to the solutions on LinkedIn
Solving the challenge of Transpose the problem table into with Power Query
Power Query solution 1 for Transpose the problem table into, proposed by Kris Jaganah:
let
  A = Excel.CurrentWorkbook(){[Name = "Table1"]}[Content],
  B = Table.FillDown(A, {"Persons"}),
  C = Table.UnpivotOtherColumns(B, {"Persons", "Category"}, "Qty", "V"),
  D = Table.Combine(
    Table.Group(
      C,
      {"Category", "Qty"},
      {
        "All",
        each
          let
            a = Table.AddIndexColumn(_, "Id"),
            b = Table.AddColumn(a, "Amt", each try [V] - a[V]{[Id] - 1} otherwise [V]),
            c = Table.AddColumn(b, "Quarters", each Text.End([Persons], 1)),
            d = Table.CombineColumns(c, {"Qty", "Category"}, each _{0} & " " & _{1}, "Mer")[
              [Quarters],
              [Mer],
              [Amt]
            ]
          in
            d
      }
    )[All]
  ),
  F = Table.Pivot(
    D,
    List.Sort(List.Distinct(D[Mer]), {each Text.BeforeDelimiter(_, " ")}),
    "Mer",
    "Amt",
    List.Sum
  )
in
  F
Power Query solution 2 for Transpose the problem table into, proposed by Alejandro Simón 🇵🇦 🇪🇸:
let
  Source = Excel.CurrentWorkbook(){[Name = "Table1"]}[Content],
  FD = Table.FillDown(Source, {"Persons"}),
  Tbls = List.Transform(
    List.Distinct(FD[Category]),
    (x) =>
      let
        a = Table.SelectRows(FD, each [Category] = x),
        b = List.Transform(a[Persons], each Text.End(_, 1)),
        c = List.Skip(Table.ToColumns(a), 2),
        d = {c{0}}
          & List.Transform({1 .. List.Count(c) - 1}, each List.Transform(c, (y) => y{_} - y{_ - 1})),
        e = Table.FromRows(
          List.Transform({0 .. List.Count(c) - 1}, each {b{_}} & {x} & d{_}),
          Table.ColumnNames(FD)
        ),
        f = Table.UnpivotOtherColumns(e, {"Persons", "Category"}, "A", "B"),
        g = Table.AddColumn(f, "C", each [A] & " " & [Category])[[Persons], [C], [B]]
      in
        g
  ),
  Comb = Table.Combine(Tbls),
  Sol = Table.Pivot(
    Comb,
    List.Sort(List.Distinct(Comb[C]), {each Text.Middle(_, 1, 2), 0}),
    "C",
    "B"
  )
in
  Sol
Power Query solution 3 for Transpose the problem table into, proposed by Luan Rodrigues:
let
  Fonte = Table.FillDown(Tabela1, {"Persons"}),
  upv = Table.UnpivotOtherColumns(Fonte, {"Persons", "Category"}, "Atributo", "Valor"),
  grp = Table.Group(
    upv,
    {"Category", "Atributo"},
    {
      {
        "tab",
        each
          let
            a = Table.AddIndexColumn(_, "Ind", 1),
            b = Table.AddColumn(a, "Value", each [Valor] - (try a{[Ind] - 2}[Valor] otherwise 0)),
            c = Table.CombineColumns(
              b,
              {"Atributo", "Category"},
              Combiner.CombineTextByDelimiter(" "),
              "Category"
            )
          in
            c[[Persons], [Category], [Value]]
      }
    }
  )[tab],
  cmb = Table.Combine(grp),
  splt = Table.TransformColumns(cmb, {{"Persons", each List.Last(Text.Split(_, ", "))}}),
  srt = Table.Sort(
    splt,
    {
      {"Persons", 0},
      {each Text.BeforeDelimiter([Category], " "), 0},
      {each Text.AfterDelimiter([Category], " "), 1}
    }
  ),
  rst = Table.Pivot(srt, List.Distinct(srt[Category]), "Category", "Value")
in
  rst
Power Query solution 4 for Transpose the problem table into, proposed by Abdallah Ally:
let
  Source = Excel.CurrentWorkbook(){[Name = "Table1"]}[Content],
  Transform1 = Table.TransformColumns(
    Table.FillDown(Source, {"Persons"}),
    {"Persons", each List.Last(Text.Split(_, " "))}
  ),
  f = (a) => {a{0}} & List.Transform({1 .. List.Count(a) - 1}, each a{_} - a{_ - 1}),
  Transform2 = List.Transform(
    List.Distinct(Transform1[Category]),
    (x) =>
      [
        a = Table.Sort(Table.SelectRows(Transform1, each [Category] = x), {"Persons", 0}),
        b = Table.ToColumns(a),
        c = List.FirstN(b, 2) & List.Transform(List.Skip(b, 2), f),
        d = Table.FromColumns(c, Table.ColumnNames(Source))
      ][d]
  ),
  Combine = Table.Combine(Transform2),
  Unpivot = Table.UnpivotOtherColumns(Combine, {"Persons", "Category"}, "Quarter", "Value"),
  Sort = Table.Sort(Unpivot, {{"Persons", 0}, {"Quarter", 0}, {"Category", 1}}),
  Merge = Table.CombineColumns(
    Sort,
    {"Quarter", "Category"},
    Combiner.CombineTextByDelimiter(" "),
    "Merge"
  ),
  Result = Table.Pivot(Merge, List.Distinct(Merge[Merge]), "Merge", "Value")
in
  Result
Power Query solution 5 for Transpose the problem table into, proposed by Eric Laforce:
let
  Source = Excel.CurrentWorkbook(){[Name = "tData248"]}[Content],
  Cats = List.Distinct(Source[Category]),
  QT = Table.RemoveColumns(Source, {"Persons", "Category"}),
  NewC1 = List.Accumulate(
    List.RemoveNulls(Source[Persons]),
    {},
    (s, c) => s & {List.Last(Text.Split(c, ", "))}
  ),
  NewQC = List.Transform(
    List.Combine(
      List.Transform(
        Table.ToColumns(QT),
        each {List.Alternate(_, 1, 1, 1), List.Alternate(_, 1, 1)}
      )
    ),
    each List.Accumulate(List.Skip(_), {_{0}}, (s, c) => s & {c - List.Sum(s)})
  ),
  NewQCN = List.Accumulate(
    Table.ColumnNames(QT),
    {},
    (s, c) => s & List.Transform(Cats, each c & " " & _)
  ),
  Result = Table.FromColumns({NewC1} & NewQC, {"Quarters"} & NewQCN)
in
  Result
Power Query solution 6 for Transpose the problem table into, proposed by 🇮🇷 Navid Esmaeilzadeh اسماعیل زاده:
let
  S = Excel.CurrentWorkbook(){[Name = "Table1"]}[Content],
  A = Table.FillDown(S, {"Persons"}),
  B = Table.UnpivotOtherColumns(A, {"Persons", "Category"}, "At", "Val"),
  C = Table.CombineColumns(
    B,
    {"At", "Category"},
    Combiner.CombineTextByDelimiter(" ", QuoteStyle.None),
    "Cat"
  ),
  D = Table.Group(
    C,
    {"Cat"},
    {{"T", each _, type table [Persons = text, Cat = text, Val = number]}}
  ),
  F = (x) =>
    let
      A = Table.AddColumn(x, "Person", each Text.End([Persons], 1)),
      B = Table.AddIndexColumn(A, "I", 0, 1),
      C = Table.AddColumn(B, "Value", each try [Val] - B[Val]{[I] - 1} otherwise [Val]),
      D = Table.SelectColumns(C, {"Person", "Cat", "Value"})
    in
      D,
  E = Table.AddColumn(D, "F", each F([T])),
  G = Table.Combine(E[F]),
  I = Table.Pivot(
    G,
    List.Sort(
      List.Distinct(G[Cat]),
      {
        {each Text.BeforeDelimiter(_, " "), Order.Ascending},
        {each Text.AfterDelimiter(_, " "), Order.Descending}
      }
    ),
    "Cat",
    "Value"
  )
in
  I
Power Query solution 7 for Transpose the problem table into, proposed by Peter Krkos:
let
  Unpivoted = Table.FillDown(
    Table.UnpivotOtherColumns(Source, {"Persons", "Category"}, "Quarter", "Value"),
    {"Persons"}
  ),
  Gen = List.Accumulate(
    Table.ToRows(Unpivoted),
    [],
    (st, cur) =>
      st
        & [
          rec = Record.FieldOrDefault(st, "R", []),
          fn  = each Text.Combine({_, cur{2} & " " & cur{1}}, "|"),
          a   = Text.Split(cur{0}, ", "),
          b   = List.Transform(a, each Record.FieldOrDefault(rec, fn(_), null)),
          c   = a{List.PositionOf(b, null)},
          R   = Record.AddField(rec, fn(c), cur{3} - (List.Sum(b) ?? 0))
        ]
  )[R],
  ToTbl = Record.ToTable(Gen),
  Split = Table.SplitColumn(
    ToTbl,
    "Name",
    Splitter.SplitTextByDelimiter("|", QuoteStyle.Csv),
    {"Quarters", "Attr"}
  ),
  ChangedType = Table.TransformColumnTypes(Split, {{"Value", Int64.Type}}),
  Sorted = Table.Sort(
    ChangedType,
    {
      {"Quarters", Order.Ascending},
      each List.PositionOf({"Q1", "Q2", "Q3", "Q4"}, Text.BeforeDelimiter([Attr], " ")),
      each List.PositionOf({"Sales", "Bonus"}, Text.AfterDelimiter([Attr], " "))
    }
  ),
  Pivoted = Table.Pivot(Sorted, List.Distinct(Sorted[Attr]), "Attr", "Value")
in
  Pivoted
Power Query solution 8 for Transpose the problem table into, proposed by CA Raghunath Gundi:
let
  Source = Excel.CurrentWorkbook(){[Name = "Q"]}[Content],
  Fill = Table.FillDown(Source, {"Persons"}),
  Unpivot = Table.UnpivotOtherColumns(Fill, {"Persons", "Category"}, "Qtr", "Value"),
  Grp = Table.Group(
    Unpivot,
    {"Category", "Qtr"},
    {
      {
        "G",
        each Table.TransformColumns(
          _,
          {{"Persons", each Text.AfterDelimiter(_, " ", {0, RelativePosition.FromEnd}), type text}}
        )
      }
    }
  ),
  fxA = (t) =>
    let
      Index = Table.AddIndexColumn(t, "Index", 0, 1, Int64.Type),
      Amount = Table.AddColumn(
        Index,
        "Amount",
        each if [Index] = 0 then [Value] else [Value] - Index[Value]{[Index] - 1}
      ),
      Labels = Table.AddColumn(Amount, "Labels", each [Qtr] & " " & [Category]),
      Remove = Table.SelectColumns(Labels, {"Persons", "Labels", "Amount"})
    in
      Remove,
  Func = Table.TransformColumns(Grp, {"G", each fxA(_)})[[G]],
  Expand = Table.ExpandTableColumn(
    Func,
    "G",
    {"Persons", "Labels", "Amount"},
    {"Persons", "Labels", "Amount"}
  ),
  Sort = Table.Sort(Expand, {{"Labels", Order.Ascending}}),
  Pivot = Table.Pivot(Sort, List.Distinct(Sort[Labels]), "Labels", "Amount", List.Sum)
in
  Pivot
Power Query solution 9 for Transpose the problem table into, proposed by Alexandre Garcia:
let
  U = Excel.CurrentWorkbook(){[Name = "Table1"]}[Content],
  H = List.Transform,
  P = Text.Split(List.Last(List.Distinct(U[Persons])), ", "),
  C = List.TransformMany(
    List.Skip(Table.ColumnNames(U), 2),
    each List.Distinct(U[Category]),
    (x, y) => x & " " & y
  ),
  M = (x) => H(List.Skip(Table.ToColumns(U), 2), each List.Alternate(_, 1, 1, x)),
  S = Table.FromColumns(
    {P}
      & List.Combine(
        List.Zip(
          H(
            {M(1), M(0)},
            (x) => H(x, (y) => H(List.Positions(y), each try y{_} - y{_ - 1} otherwise y{_}))
          )
        )
      ),
    {"Quarters"} & C
  )
in
  S
Power Query solution 10 for Transpose the problem table into, proposed by Alexandre Garcia:
let
  U = Excel.CurrentWorkbook(){[Name = "Table2"]}[Content],
  H = List.Transform,
  P = {"Persons", "Category"} & List.Skip(List.RemoveNulls(Record.ToList(U{0}))),
  L = List.Skip(List.Distinct(Record.ToList(U{1}))),
  C = H(
    List.Split(
      H(
        List.Skip(Table.ToColumns(Table.Skip(U, 2))),
        (x) => H(List.Positions(x), each List.Sum(List.Range(x, 0, _ + 1)))
      ),
      2
    ),
    each List.Combine(H(List.Zip(_), each _ & {List.Sum(_)}))
  ),
  M = {
    let
      x = List.Skip(U[Column1], 2)
    in
      List.Combine(
        H(
          List.Positions(x),
          each {Text.Combine(List.Range(x, 0, _ + 1), ", ")} & List.Repeat({null}, List.Count(L))
        )
      )
  }
    & {List.Repeat(L & {"Total"}, List.Count(C))}
    & C,
  S = Table.FromColumns(M, P)
in
  S
Power Query solution 11 for Transpose the problem table into, proposed by Glyn Willis:
let
  Source = Excel.CurrentWorkbook(){[Name = "Table1"]}[Content],
  #"Filled Down" = Table.FillDown(Source, {"Persons"}),
  #"Unpivoted Other Columns" = Table.UnpivotOtherColumns(
    #"Filled Down",
    {"Persons", "Category"},
    "Attribute",
    "Value"
  ),
  #"Merged Columns" = Table.CombineColumns(
    #"Unpivoted Other Columns",
    {"Attribute", "Category"},
    Combiner.CombineTextByDelimiter(" ", QuoteStyle.None),
    "Merged"
  ),
  #"Pivoted Column" = Table.Pivot(
    #"Merged Columns",
    List.Distinct(#"Merged Columns"[Merged]),
    "Merged",
    "Value",
    List.Sum
  ),
  Custom1 = [
    t = Table.ToColumns(#"Pivoted Column"),
    fc = List.Transform(t{0}, each Text.AfterDelimiter(_, ", ", {0, RelativePosition.FromEnd})),
    c = List.Count(t{0}),
    cn = Table.ColumnNames(#"Pivoted Column"),
    tr = List.Transform(
      List.Skip(t),
      (r) =>
        List.Transform(
          {0 .. c - 1},
          (n) =>
            r{n} - (try (List.Sum(List.Range(r, n - 1, Number.From(n > 0)) ?? {0}) ?? 0) otherwise 0)
        )
    ),
    r = Table.FromColumns({fc} & tr, cn)
  ][r]
in
  Custom1
Solving the challenge of Transpose the problem table into with Excel
Excel solution 1 for Transpose the problem table into, proposed by Bo Rydobon 🇹🇭:
=LET(
    w,
    WRAPROWS(
        TOROW(
            C2:F9
        ),
        8
    ),
    V,
    VSTACK,
    HSTACK(
        V(
            "Quarters",
            RIGHT(
                TOCOL(
                    A2:A9,
                    3
                )
            )
        ),
        V(
            TOROW(
                C1:F1&" "&B2:B3,
                ,
                1
            ),
            SORTBY(
                IFNA(
                    w-DROP(
                        V(
                            0,
                            w
                        ),
                        -1
                    ),
                    w
                ),
                MOD(
                    SEQUENCE(
                        ,
                        8,
                        0
                    ),
                    4
                )
            )
        )
    )
))
Excel solution 2 for Transpose the problem table into, proposed by Rick Rothstein:
=LET(
    x,
    INDEX(
        C2:F9-VSTACK(
            0*SEQUENCE(
                ,
                8
            ),
            C2:F9
        ),
        SEQUENCE(
            4,
            ,
            {1;3;5;7;2;4;6;8},
            2
        ),
        {1,
        2,
        3,
        4}
    ),
    VSTACK(
        HSTACK(
            "Quarters",
            TOROW(
                C1:F1&{" Sales";" Bonus"},
                ,
                1
            )
        ),
        HSTACK(
            UNIQUE(
                TEXTSPLIT(
                    TEXTJOIN(
                        ", ",
                        ,
                        A2:A8
                    ),
                    ,
                    ", "
                )
            ),
            WRAPCOLS(
                TOCOL(
                    x,
                    ,
                    1
                ),
                4
            )
        )
    )
)

Note: The semi-colon (;)
Excel solution 3 for Transpose the problem table into, proposed by Kris Jaganah:
=LET(
    b,
    B2:B9,
    c,
    C2:F9,
    VSTACK(
        HSTACK(
            "Quarters",
            TOROW(
                C1:F1&" "&UNIQUE(
                    b
                ),
                ,
                1
            )
        ),
        REDUCE(
            RIGHT(
                TOCOL(
                    A2:A9,
                    3
                )
            ),
            SEQUENCE(
                COLUMNS(
                    c
                )
            ),
            LAMBDA(
                x,
                y,
                HSTACK(
                    x,
                    WRAPROWS(
                        INDEX(
                            IFNA(
                                c-VSTACK(
                                    0,
                                    0,
                                    DROP(
                                        c,
                                        -2
                                    )
                                ),
                                c
                            ),
                            ,
                            y
                        ),
                        2
                    )
                )
            )
        )
    )
)
Excel solution 4 for Transpose the problem table into, proposed by Julian Poeltl:
=LET(
    T,
    C2:F9,
    D,
    VSTACK(
        TAKE(
            T,
            2
        ),
        DROP(
            T,
            2
        )-DROP(
            T,
            -2
        )
    ),
    REDUCE(
        HSTACK(
            "Quarters",
            TOROW(
                "Q"&SEQUENCE(
                    ,
                    4
                )&" "&{"Sales",
                "Bonus"}
            )
        ),
        SEQUENCE(
            4
        ),
        LAMBDA(
            A,
            B,
            VSTACK(
                A,
                HSTACK(
                    CHAR(
                        64+B
                    ),
                    TOROW(
                        CHOOSEROWS(
                            D,
                            2*B-1,
                            2*B
                        ),
                        ,
                        1
                    )
                )
            )
        )
    )
)
Excel solution 5 for Transpose the problem table into, proposed by Oscar Mendez Roca Farell:
=LET(
    L,
     TOCOL,
     O,
     TOROW,
     w,
     WRAPROWS(
         L(
             C2:F9
         ),
         8
     ),
     v,
     VSTACK(
         TAKE(
             w,
             1
         ),
         DROP(
             w,
             1
         )-DROP(
             w,
             -1
         )
     ),
     q,
     REPT(
         C1:F1,
         {1;1}
     ),
     VSTACK(
         HSTACK(
             "Quarters",
              O(
                  q,
                  ,
                  1
              )&" "&O(
                  B2:B9
              )
         ),
          HSTACK(
              L(
                  RIGHT(
                      L(
                          A2:A9,
                          1
                      )
                  )
              ),
               SORTBY(
                   v,
                   O(
                       q
                   )
               )
          )
     )
)
Excel solution 6 for Transpose the problem table into, proposed by Duy Tùng:
=LET(
    V,
    VSTACK,
    R,
    TOROW,
    a,
    A2:A9,
    b,
    C1:F1&" "&B2:B3,
    HSTACK(
        V(
            "Quarters",
            RIGHT(
                TOCOL(
                    a,
                    1
                )
            )
        ),
        DROP(
            SORT(
                V(
                    MATCH(
                        R(
                            b
                        ),
                        R(
                            b,
                            ,
                            1
                        ),

                    ),
                    R(
                            b
                        ),
                    WRAPROWS(
                        R(
                            V(
                                C2:F3,
                                C4:F9-C2:F7
                            )
                        ),
                        ROWS(
                            a
                        )
                    )
                ),
                ,
                ,
                1
            ),
            1
        )
    )
)
Excel solution 7 for Transpose the problem table into, proposed by Sunny Baggu:
=LET(

     _q,
     TEXTSPLIT(
         TAKE(
             TAKE(
                 A2:A9,
                  -2
             ),
              1
         ),
          ,
          ", "
     ),

     _v,
     VSTACK(
         C2:F3,
          C4:F9 - C2:F7
     ),

     _c,
     MOD(
         SEQUENCE(
             ROWS(
                 A2:A9
             )
         ),
          2
     ),

     _d,
     WRAPCOLS(

          TOCOL(
              VSTACK(
                  FILTER(
                      _v,
                       _c
                  ),
                   FILTER(
                       _v,
                        1 - _c
                   )
              ),
               ,
               1
          ),

          ROWS(
              _q
          )

     ),

     VSTACK(

          HSTACK(
              "Quarters",
               TOROW(
                   C1:F1 & B2:B3,
                    ,
                    1
               )
          ),

          HSTACK(
              _q,
               _d
          )

     )

)
Excel solution 8 for Transpose the problem table into, proposed by Sunny Baggu:
=VSTACK(

     HSTACK(
         "Quarters",
          TOROW(
              C1:F1 & B2:B3,
               ,
               1
          )
     ),

     REDUCE(

          TEXTSPLIT(
              TAKE(
                  TAKE(
                      A2:A9,
                       -2
                  ),
                   1
              ),
               ,
               ", "
          ),

          SEQUENCE(
              COLUMNS(
                  C1:F1
              )
          ),

          LAMBDA(
              a,
               v,

               HSTACK(

                    a,

                    LET(

                         _c,
                         INDEX(
                             C2:F9,
                              ,
                              v
                         ),

                         _a,
                         TAKE(
                             _c,
                              2
                         ),

                         _b,
                         DROP(
                             _c,
                              -2
                         ),

                         _d,
                         DROP(
                             _c,
                              2
                         ),

                         VSTACK(
                             TOROW(
                                 _a
                             ),
                              WRAPROWS(
                                  _d - _b,
                                   2
                              )
                         )

                    )

               )

          )

     )

)
Excel solution 9 for Transpose the problem table into, proposed by LEONARD OCHEA 🇷🇴:
=LET(
    d,
    C2:F9,
    F,
    LAMBDA(
        x,
        TOCOL(
            IFS(
                d,
                x
            ),
            3
        )
    ),
    k,
    F(
        d
    ),
    s,
    SEQUENCE(
        ROWS(
            k
        )
    ),
    t,
    TOROW(
        s
    ),
    PIVOTBY(
        RIGHT(
            F(
                SCAN(
                    ,
                    A2:A9,
                    LAMBDA(
                        a,
                        b,
                        IF(
                            b>0,
                            b,
                            a
                        )
                    )
                )
            )
        ),
        F(
            C1:F1
        )&" "&F(
            B2:B9
        ),
        MMULT(
            IFS(
                s=t,
                1,
                s-t=ROWS(
        d
    ),
                -1,
                1,
                0
            ),
            k
        ),
        SUM,
        ,
        0,
        ,
        0
    )
)
Excel solution 10 for Transpose the problem table into, proposed by Md. Zohurul Islam:
=LET(

    a,
    A2:A9,
    b,
    B2:B9,
    c,
    C1:F1,
    d,
    C2:F9,

    person,
    UNIQUE(
        TEXTSPLIT(
            CONCAT(
                a&", "
            ),
            ,
            ", ",
            TRUE
        )
    ),

    hdr,
    TOROW(
        c&" "&UNIQUE(
            b
        )
    ),

    sq,
    SEQUENCE(
        ,
        COUNTA(
            hdr
        )/2,
        0
    ),

    p,
    WRAPROWS(
        TOCOL(
            d
        ),
        COUNTA(
            hdr
        )
    ),

    q,
    DROP(
        p,
        1
    ),

    r,
    DROP(
        p,
        -1
    ),

    s,
    TAKE(
        p,
        1
    ),

    u,
    VSTACK(
        s,
        q-r
    ),

    v,
    HSTACK(
        sq,
        sq
    ),

    w,
    SORTBY(
        u,
        v,
        1
    ),

    ans,
    VSTACK(
        HSTACK(
            "Quarters",
            SORTBY(
                hdr,
                v
            )
        ),
        HSTACK(
            person,
            w
        )
    ),

    ans
)
Excel solution 11 for Transpose the problem table into, proposed by Hamidi Hamid:
=LET(
    h,
    LAMBDA(
        pp,
        st,
        TOCOL(
            TEXTSPLIT(
                CONCAT(
                    pp&" "&st&"/"
                ),
                "/"
            )
        )
    ),
    f,
    LAMBDA(
        p,
        g,
        TOCOL(
            VSTACK(
                p,
                DROP(
                    g,
                    1
                )-DROP(
                    g,
                    -1
                )
            )
        )
    ),
    x,
    CHOOSEROWS(
        C2:F9,
        SEQUENCE(
            COUNTA(
                B2:B9
            )/2,
            ,
            1,
            2
        )
    ),
    y,
    CHOOSEROWS(
        C2:F9,
        SEQUENCE(
            COUNTA(
                B2:B9
            )/2,
            ,
            2,
            2
        )
    ),
    xx,
    f(
        C2:F2,
        x
    ),
    yy,
    f(
        C3:F3,
        y
    ),
    z,
    TOCOL(
        HSTACK(
            xx,
            yy
        )
    ),
    t,
    WRAPROWS(
        z,
        ROWS(
            F2:F9
        )
    ),
    VSTACK(
        DROP(
            HSTACK(
                "Quarters",
                TOROW(
                    HSTACK(
                        h(
                            C1:F1,
                            "sales"
                        ),
                        h(
                            C1:F1,
                            "Bonus"
                        )
                    )
                )
            ),
            ,
            -2
        ),
        HSTACK(
            DROP(
                SORT(
                    UNIQUE(
                        RIGHT(
                            A2:A9,
                            1
                        )
                    )
                ),
                1
            ),
            t
        )
    )
)
Excel solution 12 for Transpose the problem table into, proposed by Asheesh Pahwa:
=LET(
    c,
    UNIQUE(
        B2:B9
    ),
    q,
    C1:F1,
    cn,
    TOROW(
        q&" "&c,
        ,
        1
    ),
    s,
    SCAN(
        "",
        A2:A9,
        LAMBDA(
            x,
            y,
            IF(
                y<>"",
                y,
                x
            )
        )
    ),
    r,
    REDUCE(
        "",
        UNIQUE(
            s
        ),
        LAMBDA(
            x,
            y,
            VSTACK(
                x,
                LET(
                    f,
                    FILTER(
                        C2:F9,
                        s=y
                    ),
                    HSTACK(
                        RIGHT(
                            y,
                            1
                        ),
                        TOROW(
                            f,
                            ,
                            1
                        )
                    )
                )
            )
        )
    ),
    _r,
    REDUCE(
        "",
        SEQUENCE(
            ROWS(
                r
            )-1
        ),
        LAMBDA(
            x,
            y,
            VSTACK(
                x,
                IFERROR(
                    INDEX(
                        r,
                        y+1,

                    )-INDEX(
                        r,
                        y,

                    ),
                    INDEX(
                        r,
                        y+1,

                    )
                )
            )
        )
    ),
    VSTACK(
        HSTACK(
            "Quarter",
            cn
        ),
        DROP(
            _r,
            1
        )
    )
)
Excel solution 13 for Transpose the problem table into, proposed by ferhat CK:
=CHOOSECOLS(
    REDUCE(
        VSTACK(
            "Quarters",
            TEXTSPLIT(
                A8,
                ,
                ", "
            )
        ),
        B2:B3,
        LAMBDA(
            x,
            y,
            HSTACK(
                x,
                LET(
                    a,
                    FILTER(
                        C2:F9,
                        B2:B9=y
                    ),
                    VSTACK(
                        "Q"&SEQUENCE(
                            ,
                            4
                        )&" "&y,
                        a-VSTACK(
                            SEQUENCE(
                            ,
                            4
                        )*0,
                            DROP(
                                a,
                                -1
                            )
                        )
                    )
                )
            )
        )
    ),
    1,
    2,
    6,
    3,
    7,
    4,
    8,
    5,
    9
)
Excel solution 14 for Transpose the problem table into, proposed by Jaroslaw Kujawa:
=LET(
    d;
    C2:F9;
    roz;
    IF(
        ROW(
            d
        )-MIN(
            ROW(
            d
        )
        )>1;
        d-OFFSET(
            d;
            -2;

        );
        d
    );
    la;
    LAMBDA(
        x;
        RIGHT(
            IF(
                A2:A9<>"";
                A2:A9;
                OFFSET(
                    A2:A9;
                    -1;

                )
            );
            1
        )&";"&C1:F1&" "&IF(
            B2:B9="Sales";
            "Bales";
            B2:B9
        )&";"&x&"|"
    );
    to_p;
    SORT(
        DROP(
            TEXTSPLIT(
                CONCAT(
                    la(
                        roz
                    )
                );
                ";";
                "|"
            );
            -1
        );
        {1;
        2};

    );
    SUBSTITUTE(
        PIVOTBY(
            TAKE(
                to_p;
                ;
                1
            );
            CHOOSECOLS(
                to_p;
                2
            );
            1*TAKE(
                to_p;
                ;
                -1
            );
            SUM;
            0;
            0;
            ;
            0
        );
        "Bal";
        "Sal"
    )
)
Excel solution 15 for Transpose the problem table into, proposed by Tolga Demirci, PMP, PMI-ACP, MOS-Expert:
=VSTACK(HSTACK(
    "Qrtrs",
    TEXTSPLIT(
        TEXTJOIN(
            ,
            ,
            BYCOL(
                UNIQUE(
                    C1:F1&B2:B9
                ),
                LAMBDA(
                    a,
                    TEXTJOIN(
                        ",",
                        ,
                        a
                    )&","
                )
            )
        ),
        ",",
        ,
        TRUE
    )
),
    LET(d,
    UNIQUE(
        TRIM(
            TEXTSPLIT(
                TEXTJOIN(
                    ",",
                    ,
                    TRIM(
                        LET(
                            x,
                            VSTACK(
                                " ",
                                DROP(
                                    OFFSET(
                                        A2:A9,
                                        -1,
                                        ,
                                        ,

                                    ),
                                    1
                                )
                            ),
                            IF(
                                x=0,
                                "",
                                x
                            )
                        )&A2:A9
                    )
                )&",",
                ,
                ",",
                TRUE
            )
        )
    ),
    HSTACK(d,
    LET(c,
    VALUE(TEXTSPLIT(TEXTJOIN(,
    ,
    MAP((SEQUENCE(
        COUNTA(
            d
        )
    )-1)*2,
    LAMBDA(
        b,
        TEXTJOIN(
            ",",
            ,
            DROP(
                TEXTSPLIT(
                    TEXTJOIN(
                        ,
                        FALSE,
                        BYCOL(
                &            TAKE(
                                OFFSET(
                                    C2:F9,
                                    b,
                                    ,
                                    COUNTA(
                                        A2:A9
                                    )
                                ),
                                1
                            ),
                            LAMBDA(
                                a,
                                TEXTJOIN(
                                    " ",
                                    FALSE,
                                    a,
                                    " "
                                )
                            )
                        )
                    ),
                    " ",
                    ,
                    FALSE
                ),
                ,
                -1
            )&DROP(
                TEXTSPLIT(
                    TEXTJOIN(
                        ,
                        FALSE,
                        BYCOL(
                            TAKE(
                                OFFSET(
                                    C2:F9,
                                    b+1,
                                    ,
                                    COUNTA(
                                        A2:A9
                                    )
                                ),
                                1
                            ),
                            LAMBDA(
                                a,
                                TEXTJOIN(
                                    " ",
                                    TRUE,
                                    ,
                                    " ",
                                    a
                                )
                            )
                        )
                    ),
                    " ",
                    ,
                    FALSE
                ),
                ,
                1
            )
        )
    ))&"/"),
    ",",
    "/",
    TRUE)),
    VSTACK(TAKE(
        c,
        1
    ),
    VALUE(TEXTSPLIT(TEXTJOIN(,
    ,
    MAP(DROP((SEQUENCE(
        COUNTA(
            d
        )
    )),
    1),
    LAMBDA(
        a,
        TEXTJOIN(
            ",",
            ,
            TAKE(
                DROP(
                    TAKE(
                        c,
                        COUNTA(
            d
        )
                    ),
                    a-1
                )-DROP(
                    TAKE(
                        c,
                        a-1
                    ),
                    a-2
                ),
                1
            )
        )
    ))&"/"),
    ",",
    "/",
    TRUE)))))))
Solving the challenge of Transpose the problem table into with Python
Python solution 1 for Transpose the problem table into, proposed by Konrad Gryczan, PhD:
import pandas as pd
path = "PQ_Challenge_248.xlsx"
input = pd.read_excel(path, sheet_name=1, usecols="A:F", nrows=9)
test = pd.read_excel(path, sheet_name=1, usecols="A:I", skiprows=12, nrows=5)
input['Persons'].ffill(inplace=True)
input_long = input.melt(id_vars=['Persons', 'Category'], var_name='Quarter', value_name='Value')
input_long['Category_Quarter'] = input_long['Quarter'] + ' ' + input_long['Category']
result = input_long.pivot(index='Persons', columns='Category_Quarter', values='Value').reset_index()
result = result.sort_values(by='Q1 Sales', ascending=False)
result.update(result.filter(like='Q').sub(result.filter(like='Q').shift(-1, fill_value=0)))
result['Quarters'] = result['Persons'].str[-1]
zipped_columns = [val for pair in zip(sorted([col for col in result.columns if 'Sales' in col]),
 sorted([col for col in result.columns if 'Bonus' in col])) for val in pair]
result = result[['Quarters'] + zipped_columns].sort_values(by='Quarters').reset_index(drop=True)
result.columns.name = None
print(result.equals(test)) # True
Python solution 2 for Transpose the problem table into, proposed by Luan Rodrigues:
import pandas as pd
import numpy as np
file = "PQ_Challenge_248.xlsx"
df = pd.read_excel(file,usecols="A:F",nrows=9)
df['Persons'] = df['Persons'].ffill()
df = pd.melt(df,id_vars=["Persons", "Category"],var_name="Atributo", value_name="Value")
def tab(x):
 x['Valor'] = x['Value'].shift()
 x['Valor'] = (np.where(pd.isna(x['Valor']), x['Value'], x['Value'] - x['Valor']))
 x['Valor'] = x['Valor'].abs()
 return x
grp = df.groupby(["Category","Atributo"]).apply(tab).reset_index(drop=True)
grp['Categoria'] = grp['Atributo'] + ' ' + grp['Category']
sort = grp.sort_values(
 by=["Persons", "Atributo", "Category"],
 ascending=[True, True, False]
)
sort['Persons'] = sort['Persons'].apply(lambda x: x.split(",")[-1])
sort = sort[['Persons','Categoria','Valor']]
pvt = (sort.pivot_table(
 index='Persons',
 columns='Categoria',
 values='Valor',
 aggfunc='first',sort=False).reset_index())
print(pvt)
Solving the challenge of Transpose the problem table into with Python in Excel
Python in Excel solution 1 for Transpose the problem table into, proposed by Alejandro Campos:
df = xl("A1:F9", headers=True)
initial_values = df.iloc[:2, 2:].to_numpy()
incremental_values = df.iloc[2:, 2:].to_numpy() - df.iloc[:-2, 2:].to_numpy()
combined_values = np.vstack((initial_values, incremental_values))
persons = ['A', 'B', 'C', 'D']
result = []
for i, person in enumerate(persons):
 sales = combined_values[::2, :]
 bonus = combined_values[1::2, :]
 row = [person]
 for quarter in range(4):
 row.append(sales[i, quarter])
 row.append(bonus[i, quarter])
 result.append(row)
columns = ['Quarters'] + [f"Q{i+1} {suffix}" for i in range(4) for suffix in ['Sales', 'Bonus']]
result_df = pd.DataFrame(result)
ordered_columns = ['Quarters']
for i in range(4):
 ordered_columns.append(f"Q{i+1} Sales")
 ordered_columns.append(f"Q{i+1} Bonus")
result_df.columns = columns
result_df = result_df[ordered_columns]
result_df
Solving the challenge of Transpose the problem table into with R
R solution 1 for Transpose the problem table into, proposed by Konrad Gryczan, PhD:
library(tidyverse)
library(readxl)
path = "Power Query/PQ_Challenge_248.xlsx"
input = read_excel(path, sheet = 2, range = "A1:F9")
test = read_excel(path, sheet = 2, range = "A13:I17")
result = input %>%
 fill(Persons, .direction = "down") %>%
 pivot_longer(-c(Persons, Category), names_to = "Quarter", values_to = "Value") %>%
 unite("Category_Quarter", Quarter, Category, sep = " ") %>%
 pivot_wider(names_from = Category_Quarter, values_from = Value) %>%
 arrange(-`Q1 Sales`) %>%
 mutate(across(starts_with("Q"), ~(. = . - lead(., default = 0))),
 Quarters = str_sub(Persons, -1, -1)) %>%
 select(Quarters, starts_with("Q1"), starts_with("Q2"), starts_with("Q3"), starts_with("Q4")) %>%
 arrange(Quarters)
all.equal(result, test, check.attributes = FALSE)
# [1] TRUE
&