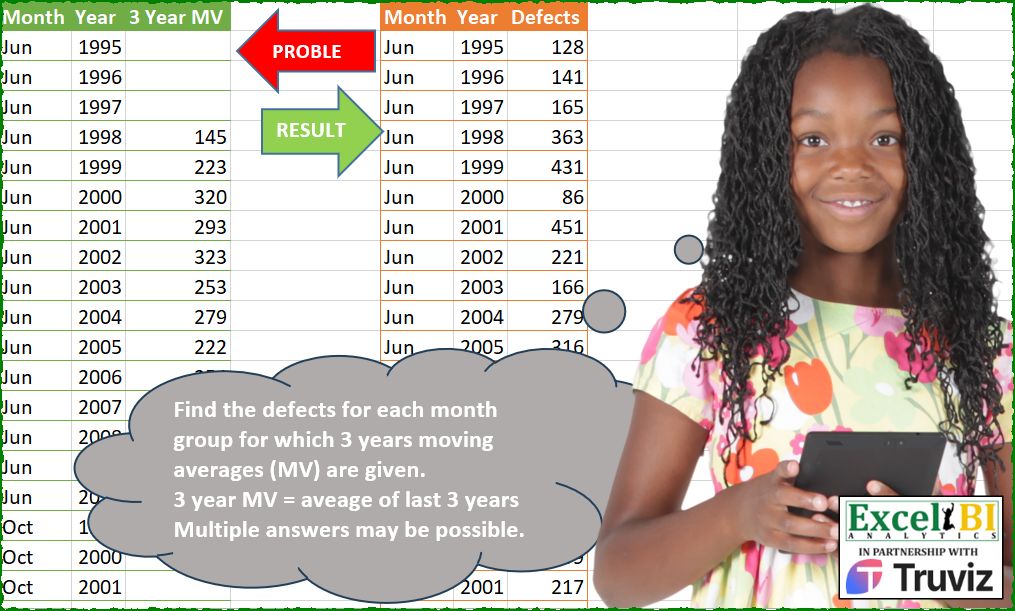
Find the defects for each month group for which 3 years moving averages (MV) are given. 3 year MV = average of last 3 years Multiple answers may be possible.
📌 Challenge Details and Links
ExcelBI Power Query Challenge Number: 208
Challenge Difficulty: ⭐️⭐️⭐️⭐️⭐️
📥Download Sample File
📥Link to the solutions on LinkedIn
Solving the challenge of Calculate Three Year Average with Power Query
Power Query solution 1 for Calculate Three Year Average, proposed by Eric Laforce:
let
  fxGenRNumInt = (n as number, Min as number, Max as number) =>
    List.Transform({1 .. n}, each Number.RoundDown(Number.RandomBetween(Min, Max))),
  Source = Excel.CurrentWorkbook(){[Name = "tData208"]}[Content],
  Group = Table.Group(
    Source,
    "Month",
    {
      "G",
      each
        let
          _mv     = List.RemoveNulls([3 Year MV]),
          _2RVal  = fxGenRNumInt(2, _mv{0} * 0.8, _mv{0} * 1.2),
          _Part1  = List.Accumulate(_mv, _2RVal, (s, c) => s & {c * 3 - List.Sum(List.LastN(s, 2))}),
          _Result = _Part1 & fxGenRNumInt(1, List.Min(_Part1), List.Max(_Part1))
        in
          Table.FromColumns({[Month], [Year], _Result}, {"Month", "Year", "Defect"})
    }
  ),
  Combine = Table.Combine(Group[G])
in
  Combine
Solving the challenge of Calculate Three Year Average with Excel
Excel solution 1 for Calculate Three Year Average, proposed by Bo Rydobon 🇹🇭:
=DROP(
    REDUCE(
        0,
        C2:C35,
        LAMBDA(
            a,
            v,
            LET(
                n,
                3,
                c,
                v:C36,
                b,
                IFERROR(
                    INDEX(
                        c,
                        n-1
                    ),
                    0
                ),
                VSTACK(
                    a,
                    IF(
                        b,
                        b*n-SUM(
                            TAKE(
                                a,
                                1-n
                            )
                        ),
                        MIN(
                            c
                        )
                    )
                )
            )
        )
    ),
    1
)
Excel solution 2 for Calculate Three Year Average, proposed by محمد حلمي:
= 141
1997 = 165
1998 = ?         ?
= What the number AVERGE(
    ?,
    141,
    165
) = 223

? = 363


Note : 128 - 141 - 165 you can get any three values that average of its = 145 (MV in 1998)

1999 ? = Same pervious logic
 AVERGE(
     ?,
     165,
     363
 ) = 320
? = 432
In file 431 no Problem because
=ROUND(
    AVERAGE(
        165,
        363,
        432
    ),

) = 320

=ROUND(
    AVERAGE(
        165,
        363,
        431
    ),

) = 320

You need last two value in Accumulator with the number you you don't learn it so we used match with map & sequnce(
    500
)
Excel solution 3 for Calculate Three Year Average, proposed by محمد حلمي:
=XMATCH(
    C6,
    MAP(
        SEQUENCE(
            500
        ),
        LAMBDA(
            a,

            AVERAGE(
                a,
                G3:G4
            )
        )
    ),
    1
)
Excel solution 4 for Calculate Three Year Average, proposed by محمد حلمي:
=LET(
    r,
    LAMBDA(
        w,
        e,
        x,
        q,
        REDUCE(
            VSTACK(
                w,
                e,
                x
            ),
            DROP(
                q,
                4
            ),

            LAMBDA(
                a,
                v,
                VSTACK(
                    a,
                    MATCH(
                        v,
                        MAP(
                            SEQUENCE(
                                500
                            ),

                            LAMBDA(
                                w,
                                AVERAGE(
                                    w,
                                    TAKE(
                                        a,
                                        -2
                                    )
                                )
                            )
                        )
                    )
                )
            )
        )
    ),

    VSTACK(
        r(
            128,
            141,
            165,
            C2:C17
        ),
        61,
        r(
            290,
            159,
            217,
            C18:C35
        ),
        414
    )
)
Excel solution 5 for Calculate Three Year Average, proposed by Julian Poeltl:
=HSTACK(
    A1:B35,
    VSTACK(
        "Defects",
        DROP(
            REDUCE(
                0,
                UNIQUE(
                    A2:A35
                ),
                LAMBDA(
                    A,
                    B,
                    VSTACK(
                        A,
                        LET(
                            N,
                            FILTER(
                                C2:C35,
                                A2:A35=B
                            ),
                            F,
                            FILTER(
                                N,
                                N<>0
                            ),
                            B,
                            TAKE(
                                F,
                                1
                            ),
                            VSTACK(
                                REDUCE(
                                    VSTACK(
                                        B,
                                        B
                                    ),
                                    F,
                                    LAMBDA(
                                        A,
                                        B,
                                        VSTACK(
                                            A,
                                            B*3-SUM(
                                                TAKE(
                                                    A,
                                                    -2
                                                )
                                            )
                                        )
                                    )
                                ),
                                B
                            )
                        )
                    )
                )
            ),
            1
        )
    )
)
Excel solution 6 for Calculate Three Year Average, proposed by LEONARD OCHEA 🇷🇴:
=LET(m,
    A2:A35,
    y,
    B2:B35,
    v,
    C2:C35,
    u,
    UNIQUE(
        m
    ),
    x,
    {128,
    290;141,
    159;61,
    414},
    REDUCE(G1,
    u,
    LAMBDA(a,
    b,
    LET(l,
    DROP(
        FILTER(
            v,
            m=b
        ),
        3
    ),
    s,
    FILTER(
        y,
        m=b
    ),
    t,
    TOROW(
        s
    ),
    c,
    XMATCH(
        b,
        u
    ),
    I,
    LAMBDA(
        a,
        INDEX(
            x,
            a,
            c
        )
    ),
    VSTACK(a,
    VSTACK(I(
        1
    ),
    I(
        2
    ),
    MMULT(MINVERSE(DROP(DROP((s<=t)*(s>t-3),
    -3,
    2),
    ,
    -1)),
    IFNA(
        3*l-VSTACK(
            I(
        1
    )+I(
        2
    ),
            I(
        2
    )
        ),
        3*l
    )),
    I(
        3
    )))))))
With the random data between 50-450
x,
    RANDARRAY(
        3,
        COUNTA(
            u
        ),
        50,
        450,
        1
    )
=LET(m,
    A2:A35,
    y,
    B2:B35,
    v,
    C2:C35,
    u,
    UNIQUE(
        m
    ),
    x,
    RANDARRAY(
        3,
        COUNTA(
            u
        ),
        50,
        450,
        1
    ),
    REDUCE(G1,
    u,
    LAMBDA(a,
    b,
    LET(l,
    DROP(
        FILTER(
            v,
            m=b
        ),
        3
    ),
    s,
    FILTER(
        y,
        m=b
    ),
    t,
    TOROW(
        s
    ),
    c,
    XMATCH(
        b,
        u
    ),
    I,
    LAMBDA(
        a,
        INDEX(
            x,
            a,
            c
        )
    ),
    VSTACK(a,
    VSTACK(I(
        1
    ),
    I(
        2
    ),
    MMULT(MINVERSE(DROP(DROP((s<=t)*(s>t-3),
    -3,
    2),
    ,
    -1)),
    IFNA(
        3*l-VSTACK(
            I(
        1
    )+I(
        2
    ),
            I(
        2
    )
        ),
        3*l
    )),
    I(
        3
    )))))))
Solving the challenge of Calculate Three Year Average with Python
Python solution 1 for Calculate Three Year Average, proposed by Konrad Gryczan, PhD:
Excel BI, that was a hard challenge.
import pandas as pd
import random
path = "PQ_Challenge_208.xlsx"
input = pd.read_excel(path, usecols="A:C")
def find_defects(input):
 def generate_integer_set_with_mean(target_mean):
 x1 = random.randint(1, 2 * target_mean)
 x2 = random.randint(1, 2 * target_mean)
 x3 = 3 * target_mean - x1 - x2

 while x3 <= 0 or x3 > 2 * target_mean:
 x1 = random.randint(1, 2 * target_mean)
 x2 = random.randint(1, 2 * target_mean)
 x3 = 3 * target_mean - x1 - x2

 return [x1, x2, x3]

 initial_set = generate_integer_set_with_mean(input['3 Year MV'].dropna().iloc[0])

 input['Defects'] = [initial_set[0], initial_set[1], initial_set[2]] + [None] * (len(input) - 3)
 for i in range(3, len(input) - 1):
 input['Defects'].iloc[i] = 3 * input['3 Year MV'].iloc[i+1] - sum(input['Defects'].iloc[i-3:i])
 return input
output = input.groupby('Month').apply(find_defects).reset_index(drop=True)
print(output)
Solving the challenge of Calculate Three Year Average with Python in Excel
Python in Excel solution 1 for Calculate Three Year Average, proposed by Owen Price:
3) Construct an initial guess of 100 for each row
Solving the challenge of Calculate Three Year Average with R
R solution 1 for Calculate Three Year Average, proposed by Konrad Gryczan, PhD:
library(tidyverse)
library(readxl)
path = "Power Query/PQ_Challenge_208.xlsx"
input = read_xlsx(path, range = "A1:C35")
find_defects <- function(input) {
 generate_integer_set_with_mean <- function(target_mean) {
 x1 <- sample(1:(2 * target_mean), 1)
 x2 <- sample(1:(2 * target_mean), 1)
 x3 <- 3 * target_mean - x1 - x2

 while (x3 <= 0 || x3 > 2 * target_mean) {
 x1 <- sample(1:(2 * target_mean), 1)
 x2 <- sample(1:(2 * target_mean), 1)
 x3 <- 3 * target_mean - x1 - x2
 }
 return(c(x1, x2, x3))
 }
 initial_set = generate_integer_set_with_mean(input$`3 Year MV`[which(!is.na(input$`3 Year MV`))[1]])
 res = input %>%
 mutate(defects = NA) %>%
 slice(1:3) %>%
 mutate(defects = initial_set) %>%
 bind_rows(input %>% slice(4:n()))
 for (i in 4:nrow(res) - 1) {
 res$defects[i] = 3 * res$`3 Year MV`[i + 1] - res$defects[i - 2] - res$defects[i - 1]
 }
 return(res)
}
result = input %>%
 split(.$Month) %>%
 map(find_defects) %>%
 bind_rows()
print(result)
PS. Nobody said that it has to be populated with only positive numbers.  :D
R solution 2 for Calculate Three Year Average, proposed by Anil Kumar Goyal:
library(readxl)
library(tidyverse)
library(janitor)
library(magrittr)
df <- read_excel("PQ/PQ_Challenge_208.xlsx", range = cell_cols("A:C"))
df %>%
 clean_names() %T>%
 {set.seed(1); nums <<- sample(100:200, 2)} %>%
 mutate(original = accumulate(
 na.omit(x3_year_mv),~ {
 c(tail(.x, 2), 3*.y - sum(tail(.x, 2), na.rm = TRUE))
 },
 .init = nums)[-1] %>%
 map_int(~tail(., 1)) %>%
 c(nums, ., sample(100:150, 1)),
 .by = month
 )
&&&