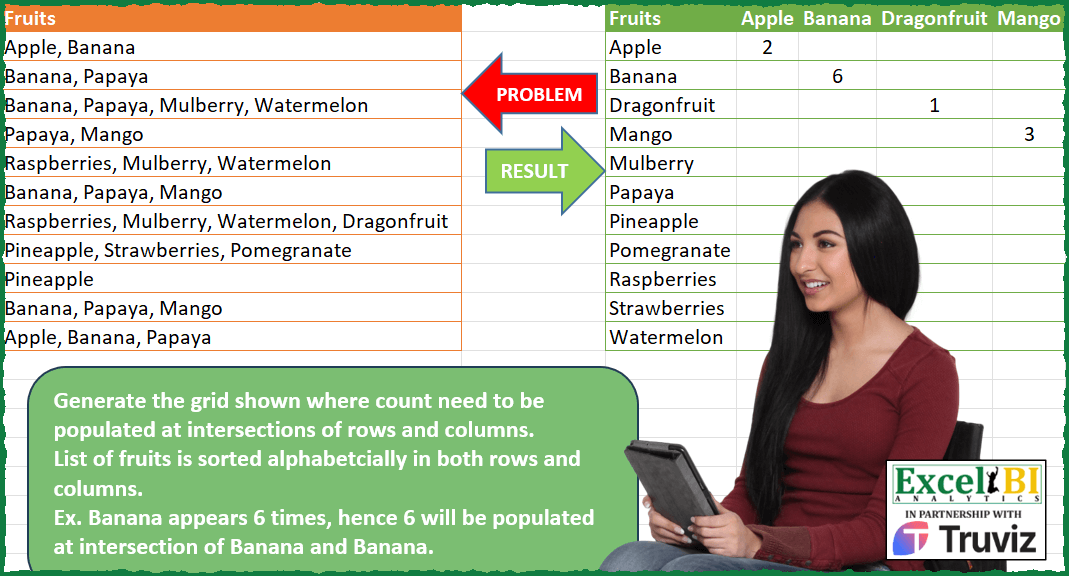
Generate the grid shown where count need to be populated at intersections of rows and columns. List of fruits is sorted alphabetically in both rows and columns. Ex. Banana appears 6 times, hence 6 will be populated at intersection of Banana and Banana.
📌 Challenge Details and Links
ExcelBI Power Query Challenge Number: 148
Challenge Difficulty: ⭐️⭐️⭐️
📥Download Sample File
📥Link to the solutions on LinkedIn
Solving the challenge of Fruit Pair Frequency Grid with Power Query
Power Query solution 1 for Fruit Pair Frequency Grid, proposed by Zoran Milokanović:
let
  Source = Table.Sort(
    Table.Group(
      Table.FromList(
        List.TransformMany(
          Excel.CurrentWorkbook(){[Name = "Input"]}[Content][Fruits],
          (x) => Text.Split(x, ", "),
          (x, y) => y
        ),
        null,
        {"F"}
      ),
      {"F"},
      {{"C", each Table.RowCount(_)}}
    ),
    "F"
  ),
  S = Table.FromRows(
    List.TransformMany(
      Source[F],
      (x) => {{x} & List.Transform(Source[F], each if _ = x then Source{[F = x]}[C] else null)},
      (x, y) => y
    ),
    {"Fruits"} & Source[F]
  )
in
  S
Power Query solution 2 for Fruit Pair Frequency Grid, proposed by Kris Jaganah:
let
  Source = Excel.CurrentWorkbook(){[Name = "Table1"]}[Content],
  C = Table.FromList(
    List.Sort(List.Combine(List.Transform(Source[Fruits], each Text.Split(_, ", "))))
  ),
  G = Table.Group(C, {"Column1"}, {"Count", each Table.RowCount(_)}),
  D = Table.DuplicateColumn(G, "Column1", "Fruits"),
  P = Table.Pivot(D, List.Distinct(D[Column1]), "Column1", "Count")
in
  P
Power Query solution 3 for Fruit Pair Frequency Grid, proposed by Alejandro Simón 🇵🇦 🇪🇸:
let
  Source = Excel.CurrentWorkbook(){[Name = "Table1"]}[Content],
  Split = List.Transform(Table.ToRows(Source), each Text.Split(_{0}, ", ")),
  Col = Table.FromColumns({List.Combine(Split)}, Table.ColumnNames(Source)),
  Group = Table.Sort(Table.Group(Col, {"Fruits"}, {{"Count", each Table.RowCount(_)}}), "Fruits"),
  Sol = List.Accumulate(
    Group[Fruits],
    Group[[Fruits]],
    (s, c) =>
      Table.AddColumn(
        s,
        c,
        each if [Fruits] = c then Group[Count]{List.PositionOf(Group[Fruits], c)} else null
      )
  )
in
  Sol
Power Query solution 4 for Fruit Pair Frequency Grid, proposed by Luan Rodrigues:
let
  Fonte = Tabela1,
  res = [
    a = List.Combine(
      Table.AddColumn(Fonte, "Personalizar", each Text.Split([Fruits], ", "))[Personalizar]
    ),
    b = Table.FromRows(
      List.Transform(List.Distinct(a), each {_} & {List.Count(List.Select(a, (x) => _ = x))} & {_})
    ),
    c = Table.Pivot(b, List.Distinct(b[Column3]), "Column3", "Column2"),
    d = Table.ReorderColumns(c, List.Sort(List.RemoveFirstN(Table.ColumnNames(c), 1), 0))
  ][d]
in
  res
Power Query solution 5 for Fruit Pair Frequency Grid, proposed by Hussein SATOUR:
let
  Source = Excel.CurrentWorkbook(){[Name = "Table1"]}[Content],
  SplitValues = Table.ExpandListColumn(
    Table.TransformColumns(
      Source,
      {
        {
          "Fruits",
          Splitter.SplitTextByDelimiter(", ", QuoteStyle.Csv),
          let
            itemType = (type nullable text) meta [Serialized.Text = true]
          in
            type {itemType}
        }
      }
    ),
    "Fruits"
  ),
  NewCol = Table.AddColumn(
    SplitValues,
    "Custom",
    each
      let
        a = [Fruits],
        b = Table.SelectRows(SplitValues, each ([Fruits] = a))
      in
        List.NonNullCount(b[Fruits])
  ),
  RemoDuplicates = Table.Distinct(NewCol, {"Fruits"}),
  NewCol2 = Table.AddColumn(RemoDuplicates, "Custom.1", each RemoDuplicates[Fruits]),
  ExpandNewCol = Table.ExpandListColumn(NewCol2, "Custom.1"),
  NewCol6 = Table.AddColumn(ExpandNewCol, "Custom.2", each [Fruits] = [Custom.1]),
  FilterRows = Table.SelectRows(NewCol6, each ([Custom.2] = true)),
  RemovCol = Table.RemoveColumns(FilterRows, {"Custom.2"}),
  SortRows = Table.Sort(RemovCol, {{"Fruits", Order.Ascending}}),
  PivotCols = Table.Pivot(
    SortRows,
    List.Distinct(SortRows[Custom.1]),
    "Custom.1",
    "Custom",
    List.Sum
  )
in
  PivotCols
Power Query solution 6 for Fruit Pair Frequency Grid, proposed by Alexis Olson:
let
  Source       = Excel.CurrentWorkbook(){[Name = "Table1"]}[Content],
  Split        = List.Transform(Source[Fruits], each Text.Split(_, ", ")),
  SortCombined = List.Sort(List.Combine(Split)),
  ToTable      = Table.FromColumns({SortCombined, SortCombined}, {"Fruits", "Fruit"}),
  Group        = Table.Group(ToTable, {"Fruits", "Fruit"}, {{"Count", Table.RowCount}}),
  Pivot        = Table.Pivot(Group, Group[Fruit], "Fruit", "Count")
in
  Pivot
Power Query solution 7 for Fruit Pair Frequency Grid, proposed by Bhavya Gupta:
let
  Source = Excel.CurrentWorkbook(){[Name = "Table1"]}[Content],
  AllFruits = Table.ExpandListColumn(
    Table.TransformColumns(Source, {{"Fruits", each Splitter.SplitTextByDelimiter(", ")(_)}}),
    "Fruits"
  ),
  Tbl = Table.Sort(
    List.Accumulate({"Values", "Pivot"}, AllFruits, (x, y) => Table.DuplicateColumn(x, "Fruits", y)),
    {{"Fruits", Order.Ascending}}
  ),
  Output = Table.Pivot(Tbl, List.Distinct(Tbl[Fruits]), "Fruits", "Values", List.Count)
in
  Output
Power Query solution 8 for Fruit Pair Frequency Grid, proposed by Ramiro Ayala Chávez:
let
  Origen = Excel.CurrentWorkbook(){[Name = "Tabla1"]}[Content],
  a      = List.Sort(List.Combine(List.Transform(Origen[Fruits], each Text.Split(_, ", ")))),
  b      = Table.FromColumns({a}, {"A"}),
  c      = Table.Group(b, {"A"}, {{"G", List.Count}})[G],
  d      = List.Distinct(a),
  e      = Table.FromColumns({d, d, c}, Table.ColumnNames(Origen) & {"F1", "F2"}),
  Sol    = Table.Pivot(e, List.Distinct(e[F1]), "F1", "F2")
in
  Sol
Power Query solution 9 for Fruit Pair Frequency Grid, proposed by Sandeep Marwal:
let
  Source = Excel.CurrentWorkbook(){[Name = "Table1"]}[Content],
  #"Changed Type" = Table.TransformColumnTypes(Source, {{"Fruits", type text}}),
  Custom1 = Text.Split(Text.Combine(#"Changed Type"[Fruits], ","), ","),
  #"Converted to Table" = Table.FromList(
    Custom1,
    Splitter.SplitByNothing(),
    {"Fruits"},
    null,
    ExtraValues.Error
  ),
  #"Trimmed Text" = Table.TransformColumns(
    #"Converted to Table",
    {{"Fruits", Text.Trim, type text}}
  ),
  #"Grouped Rows" = Table.Group(
    #"Trimmed Text",
    {"Fruits"},
    {{"Count", each Table.RowCount(_), Int64.Type}}
  ),
  #"Added Custom" = Table.AddColumn(#"Grouped Rows", "Custom", each [Fruits]),
  #"Sorted Rows" = Table.Sort(#"Added Custom", {{"Fruits", Order.Ascending}}),
  #"Pivoted Column" = Table.Pivot(
    #"Sorted Rows",
    List.Distinct(#"Sorted Rows"[Custom]),
    "Custom",
    "Count",
    List.Sum
  )
in
  #"Pivoted Column"
Power Query solution 10 for Fruit Pair Frequency Grid, proposed by Glyn Willis:
let
  Source = Excel.CurrentWorkbook(){[Name = "Table1"]}[Content],
  #"Changed Type" = Table.TransformColumnTypes(Source, {{"Fruits", type text}}),
  Fruits = Table.AddColumn(
    Table.DuplicateColumn(
      Table.FromList(
        List.Combine(List.Transform(#"Changed Type"[Fruits], each Text.Split(_, ", "))),
        Splitter.SplitByNothing(),
        {"Fruits"}
      ),
      "Fruits",
      "Column"
    ),
    "Count",
    each 1
  ),
  #"Sorted Rows" = Table.Sort(Fruits, {{"Fruits", Order.Ascending}}),
  #"Pivoted Column" = Table.Pivot(
    #"Sorted Rows",
    List.Distinct(#"Sorted Rows"[Column]),
    "Column",
    "Count",
    List.Sum
  )
in
  #"Pivoted Column"
Power Query solution 11 for Fruit Pair Frequency Grid, proposed by Arden Nguyen, CPA:
let
 Source = Excel.CurrentWorkbook(){[Name="Table1"]}[Content],
 split = Table.ExpandListColumn(
 Table.TransformColumns(
 Source, {{"Fruits", Splitter.SplitTextByDelimiter(", ")}}),
 "Fruits"
 ),
 sort = Table.Sort(split,{{"Fruits", Order.Ascending}}),
 group = Table.Buffer(
 Table.Group(
 sort,
 {"Fruits"},
 {{ "Count", each hashtag#table({[Fruits]{0}},{{Table.RowCount(_)}}) }},
 GroupKind.Local)),
 result = Table.ExpandTableColumn(group, "Count", group[Fruits])
in
 result
Solving the challenge of Fruit Pair Frequency Grid with Excel
Excel solution 1 for Fruit Pair Frequency Grid, proposed by Bo Rydobon 🇹🇭:
=LET(c,CONCAT(A2:A12&", "),t,TEXTSPLIT(c,,", ",1),u,SORT(UNIQUE(t)),v,TOROW(u),
VSTACK(HSTACK(A1,v),HSTACK(u,IF(u=v,LEN(SUBSTITUTE(c,u,0&u))-LEN(c),""))))
Excel solution 2 for Fruit Pair Frequency Grid, proposed by Bo Rydobon 🇹🇭:
=LET(t,TEXTSPLIT(CONCAT(A1:A12&", "),,", ",1),DROP(PIVOTBY(t,t,t,ROWS,3,0,,0),1))Excel solution 3 for Fruit Pair Frequency Grid, proposed by Rick Rothstein:
=LET(f,TEXTSPLIT(TEXTJOIN(", ",,A2:A12),,", "),s,UNIQUE(SORT(f)),HSTACK(VSTACK("Fruits",s),VSTACK(TOROW(s),SUBSTITUTE(MAP(s,LAMBDA(x,COUNTA(FILTER(f,f=x))))*MUNIT(COUNTA(s)),0,""))))Excel solution 4 for Fruit Pair Frequency Grid, proposed by Kris Jaganah:
=LET(a,SORT(TEXTSPLIT(ARRAYTOTEXT(A2:A12),,", ")),b,UNIQUE(a),c,TOROW(b),HSTACK(VSTACK("Fruits",b),VSTACK(c,IF(b=c,MAP(b,LAMBDA(x,SUM(--(x=a)))),""))))Excel solution 5 for Fruit Pair Frequency Grid, proposed by Kris Jaganah:
=LET(a,TEXTSPLIT(ARRAYTOTEXT(A1:A12),,", "),DROP(PIVOTBY(a,a,a,COUNTA,3,0),1,-1))Excel solution 6 for Fruit Pair Frequency Grid, proposed by Sunny Baggu:
=LET(
 _a, TEXTSPLIT(ARRAYTOTEXT(A2:A12), , ", "),
 _b, SORT(UNIQUE(_a)),
 _c, TOROW(_b),
 _v, BYCOL(N(_a = _c), LAMBDA(a, SUM(a))),
 _fv, MAKEARRAY(
 ROWS(_b),
 COLUMNS(_c),
 LAMBDA(r, c, IF(r = c, INDEX(_v, , c), ""))
 ),
 VSTACK(HSTACK(A1, _c), HSTACK(_b, _fv))
)
Excel solution 7 for Fruit Pair Frequency Grid, proposed by LEONARD OCHEA 🇷🇴:
=LET(t,TEXTSPLIT(TEXTJOIN(", ",,A2:A12),,", "),f,SORT(UNIQUE(t)), g,TOROW(f),VSTACK(HSTACK(A1,g),HSTACK(f,IF(f=g,BYCOL((t=g)*1,SUM),""))))

=LET(t,TEXTSPLIT(TEXTJOIN(", ",,A1:A12),,", "),DROP(PIVOTBY(t,t,t,COUNTA,3,0,,0),1))
Excel solution 8 for Fruit Pair Frequency Grid, proposed by Abdallah Ally:
=LET(a,TEXTSPLIT(TRIM(TEXTJOIN(", ",,A2:A12)),,", "),b,SORT(UNIQUE(a)),c,TOROW(b),d,COUNTA(b),e,MAKEARRAY(d,d,LAMBDA(x,y,IF(x=y,COUNTA(FILTER(a,a=CHOOSEROWS(b,x))),""))),HSTACK(VSTACK("Fruits",b),VSTACK(c,e)))Excel solution 9 for Fruit Pair Frequency Grid, proposed by Bhavya Gupta:
=LET(a,DROP(REDUCE("",A2:A12,LAMBDA(x,y,VSTACK(x,TEXTSPLIT(y,,", ")))),1),PIVOTBY(a,a,a,COUNTA,,0,,0))Excel solution 10 for Fruit Pair Frequency Grid, proposed by 🇵🇪 Ned Navarrete C.:
=LET(r,SORT(TEXTSPLIT(ARRAYTOTEXT(A2:A13),,", ",1)),u,UNIQUE(r),v,TOROW(u),c,MAP(u,LAMBDA(f,SUM(--(r=f)))),x,IF(u=v,c,""),VSTACK(HSTACK(A1,v),HSTACK(u,x)))Excel solution 11 for Fruit Pair Frequency Grid, proposed by Tolga Demirci, PMP, PMI-ACP, MOS-Expert:
=LET(q;TEXTSPLIT(TEXTJOIN(", ";;A2:A12);", ");VSTACK(HSTACK(" ";TOROW(SORT(UNIQUE(TOCOL(q));;1)));HSTACK(SORT(UNIQUE(TOCOL(q));;1);DROP(TEXTSPLIT(TEXTJOIN(;;MAP(SORT(UNIQUE(TOCOL(q));;1);MAP(SORT(UNIQUE(TOCOL(q));;1);LAMBDA(b;SUM(IFERROR(FIND(b;TEXTSPLIT(TEXTJOIN(;;MAP(A2:A12;LAMBDA(a;CONCAT(TEXTJOIN(", ";;TEXTSPLIT(a;", "));"/"))));", ";"/";;;"");1);0))));LAMBDA(i;j;CONCAT(TEXTJOIN(";";;IF(i=TOROW(SORT(UNIQUE(TOCOL(q));;1));j;0));"+"))));";";"+";;;"");-1))))Excel solution 12 for Fruit Pair Frequency Grid, proposed by Mahmoud Bani Asadi:
=LET(
a,SORT(TEXTSPLIT(TEXTJOIN(", ",,A2:A12),,", ")),
PIVOTBY(a,a,a,COUNTA,,0,,0))
Solving the challenge of Fruit Pair Frequency Grid with Python
Python solution 1 for Fruit Pair Frequency Grid, proposed by Jan Willem Van Holst:
in Python:
import pandas as pd
from collections import Counter, OrderedDict
df = pd.read_csv(r"C:JWLENOVOPYTHONPower_Query_Challenge_148.csv", sep=";")
inputList=df[df.columns[0]].to_list()
unpack = sum([elem.split(', ') for elem in inputList], [])
Counter = OrderedDict(sorted(Counter(unpack).items()))
Solving the challenge of Fruit Pair Frequency Grid with R
R solution 1 for Fruit Pair Frequency Grid, proposed by Konrad Gryczan, PhD:
After one pretty hardcore, puzzle for today is pretty straightforword.
library(tidyverse)
library(readxl)
input = read_excel("Power Query/PQ_Challenge_148.xlsx", range = "A1:A12")
test = read_excel("Power Query/PQ_Challenge_148.xlsx", range = "C1:N12")
result = input %>%
 separate_rows(Fruits, sep = ", ") %>%
 mutate(Fruits = str_remove_all(Fruits, " ")) %>%
 group_by(Fruits) %>%
 summarise(Count = n()) %>%
 ungroup() %>%
 mutate(Fruits2 = Fruits) %>%
 pivot_wider(names_from = Fruits2, values_from = Count)
&&&