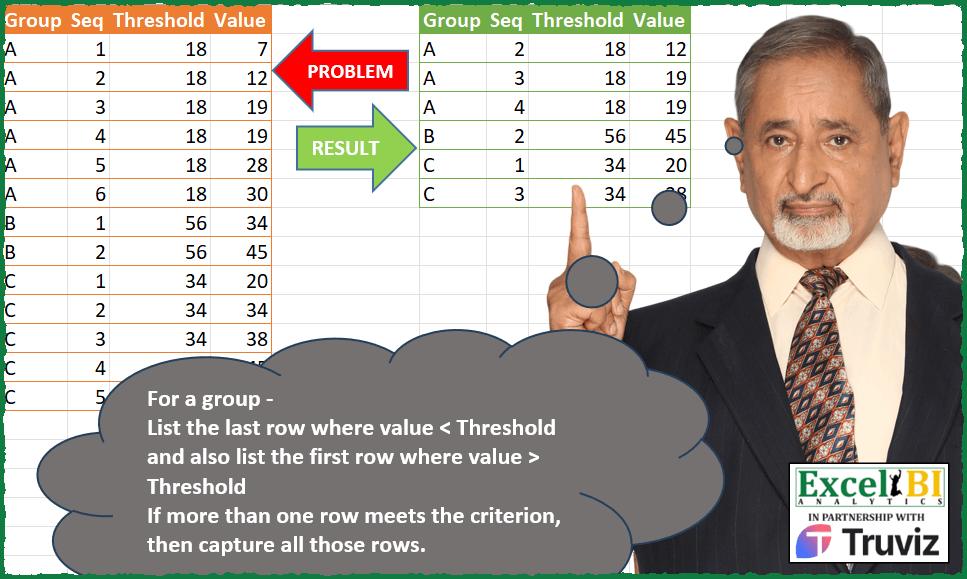
For a group – List the last row where value < Threshold and also list the first row where value > Threshold If more than one row meets the criterion, then capture all those rows. Ex. For group A, last row where value < 18 is Seq 2 (value 12) and first row where value > 18 is Seq 3 (value 19). Value 19 is in two rows, hence both Seq 3 and 4 are captured for 19.
📌 Challenge Details and Links
ExcelBI Power Query Challenge Number: 146
Challenge Difficulty: ⭐️⭐️⭐️⭐️
📥Download Sample File
📥Link to the solutions on LinkedIn
Solving the challenge of Boundary Rows per Threshold with Power Query
Power Query solution 1 for Boundary Rows per Threshold, proposed by Alejandro Simón 🇵🇦 🇪🇸:
let
  Source = Excel.CurrentWorkbook(){[Name = "Table1"]}[Content],
  Sol = Table.Combine(
    Table.Group(
      Source,
      {"Group"},
      {
        {
          "All",
          (x) =>
            let
              a = Table.AddColumn(x, "G", each [Threshold] - [Value]),
              b = a[G],
              c = List.Last(List.Select(b, each _ > 0)),
              d = List.First(List.Select(b, each _ < 0)),
              e = List.RemoveNulls({c, d}),
              f = Table.RemoveColumns(Table.SelectRows(a, each List.Contains(e, [G])), "G")
            in
              f
        }
      }
    )[All]
  )
in
  Sol
Power Query solution 2 for Boundary Rows per Threshold, proposed by Luan Rodrigues:
let
  Fonte = Tabela1,
  res = Table.Combine(
    Table.Group(
      Fonte,
      {"Group"},
      {
        {
          "tab",
          each [
            n = [Threshold]{0},
            a = Table.LastN(Table.SelectRows(_, each [Value] < n), 1)[Value]{0},
            b = Table.FirstN(Table.SelectRows(_, each [Value] > n), 1)[Value]{0}? ?? null,
            c = {a, b},
            d = Table.SelectRows(_, each List.ContainsAny({[Value]}, c))
          ][d]
        }
      }
    )[tab]
  )
in
  res
Power Query solution 3 for Boundary Rows per Threshold, proposed by Eric Laforce:
let
  Source = Excel.CurrentWorkbook(){[Name = "tData146"]}[Content],
  Group = Table.Group(
    Source,
    "Group",
    {
      "All",
      each
        let
          T   = _{0}[Threshold],
          V   = _[Value],
          PTV = List.Last(List.Select(V, each _ < T)),
          NTV = List.First(List.Select(V, each _ > T))
        in
          Table.SelectRows(_, each List.Contains({PTV, NTV}, [Value]))
    }
  ),
  Result = Table.Combine(Group[All])
in
  Result
Power Query solution 4 for Boundary Rows per Threshold, proposed by Sandeep Marwal:
let
 Source = Excel.CurrentWorkbook(){[Name="Table1"]}[Content],
 #"Added Custom" = Table.AddColumn(Source, "Custom", each Value.Compare([Value],[Threshold])),
 #"Filtered Rows" = Table.SelectRows(#"Added Custom", each ([Custom] <> 0)),
 #"Grouped Rows" = Table.Group(#"Filtered Rows", {"Group", "Custom"}, {{"Count", each _, type table [Group=text, Seq=number, Threshold=number, Value=number, Custom=number]}}),
 Custom1 = Table.TransformColumns(#"Grouped Rows",{"Count",(a)=>
if a[Custom]{0} = 1 then Table.FirstN(a,each [Value] = a[Value]{0})
else Table.LastN(a,each [Value] = List.Last(a[Value]))
}),
 #"Expanded Count" = Table.ExpandTableColumn(Custom1, "Count", {"Seq", "Threshold", "Value"}, {"Seq", "Threshold", "Value"}),
 #"Removed Columns" = Table.RemoveColumns(#"Expanded Count",{"Custom"})
in
 #"Removed Columns
Power Query solution 5 for Boundary Rows per Threshold, proposed by Glyn Willis:
let
  Source = Excel.CurrentWorkbook(){[Name = "Table1"]}[Content],
  #"Changed Type" = Table.TransformColumnTypes(
    Source,
    {{"Group", type text}, {"Seq", Int64.Type}, {"Threshold", Int64.Type}, {"Value", Int64.Type}}
  ),
  #"Grouped Rows" = Table.Group(
    #"Changed Type",
    {"Group"},
    {
      {
        "D",
        each [
          T  = [Threshold]{0},
          L  = Table.SelectRows(_, (x) => x[Value] < T),
          LM = Table.MaxN(L, {"Value"}, each [Value] = List.Last(L[Value])),
          G  = Table.SelectRows(_, (x) => x[Value] > T),
          GM = Table.MinN(G, {"Value"}, each [Value] = List.First(G[Value])),
          R  = LM & GM
        ][R],
        type table
      }
    }
  ),
  #"Expanded D" = Table.ExpandTableColumn(
    #"Grouped Rows",
    "D",
    {"Seq", "Threshold", "Value"},
    {"Seq", "Threshold", "Value"}
  )
in
  #"Expanded D"
Power Query solution 6 for Boundary Rows per Threshold, proposed by Arden Nguyen, CPA:
let
  Source = Excel.CurrentWorkbook(){[Name = "Table1"]}[Content],
  #"Changed Type" = Table.TransformColumnTypes(
    Source,
    {{"Group", type text}, {"Seq", Int64.Type}, {"Threshold", Int64.Type}, {"Value", Int64.Type}}
  ),
  #"Filtered Rows" = Table.SelectRows(#"Changed Type", each [Value] <> [Threshold]),
  #"Grouped Rows" = Table.Group(
    #"Filtered Rows",
    {"Group", "Threshold", "Value"},
    {
      {
        "Rows",
        each
          let
            min = Number.From(List.Min([Value])),
            max = Number.From(List.Max([Value]))
          in
            if min < [Threshold]{0} then
              Table.RemoveFirstN(_, List.PositionOf([Value], max))
            else
              Table.FirstN(_, List.PositionOf([Value], min, Occurrence.Last) + 1)
      }
    },
    GroupKind.Local,
    (x, y) =>
      Byte.From((x[Value] > x[Threshold]) <> (y[Value] > y[Threshold]) or x[Group] <> y[Group])
  )
in
  Table.Combine(#"Grouped Rows"[Rows])
Solving the challenge of Boundary Rows per Threshold with Excel
Excel solution 1 for Boundary Rows per Threshold, proposed by Bo Rydobon 🇹🇭:
=LET(a,A2:A14,d,D2:D14,
FILTER(A2:D14,MAP(a,C2:C14,d,LAMBDA(i,j,k,OR(XLOOKUP(j+{-1,1},--REPT(d,a=i),d,0,{-1,1})=k)))))
Excel solution 2 for Boundary Rows per Threshold, proposed by محمد حلمي:
=LET(u,A2:A14,j,A2:D14,r,LAMBDA(v,XMATCH(u&
D2:D14,MAP(UNIQUE(u),LAMBDA(a,LET(e,FILTER(j,u=a),i,
DROP(e,,3),w,INDEX(e,,3),XLOOKUP(1,--IF(v+1,i>w,i
Excel solution 3 for Boundary Rows per Threshold, proposed by Kris Jaganah:
=LET(a,A2:A14,b,B2:B14,c,C2:C14,d,D2:D14,e,UNIQUE(a)&"1",f,SORT(TOCOL(VSTACK(XLOOKUP(e,a&--(dc),a&d)),3)),REDUCE(A1:D1,f,LAMBDA(x,y,VSTACK(x,FILTER(HSTACK(a,b,c,d),a&d=y))))) Excel solution 4 for Boundary Rows per Threshold, proposed by Sunny Baggu:
=LET(
 _u, UNIQUE(A2:A14),
 _tbl, REDUCE(
 "",
 _u,
 LAMBDA(a, v,
 VSTACK(
 a,
 LET(
 _f1, FILTER(A2:D14, A2:A14 = v),
 _c4, INDEX(_f1, , 4),
 _c3, INDEX(_f1, , 3),
 VSTACK(
 IFERROR(FILTER(_f1, _c4 = TAKE(TOCOL(IF(_c4 < _c3, _c4, x), 3), -1), ""), ""),
 IFERROR(FILTER(_f1, _c4 = TAKE(TOCOL(IF(_c4 > _c3, _c4, x), 3), 1), ""), "")
 )
 )
 )
 )
 ),
 FILTER(_tbl, NOT(ISNA(TAKE(_tbl, , -1))))
)
Solving the challenge of Boundary Rows per Threshold with Python in Excel
Python in Excel solution 1 for Boundary Rows per Threshold, proposed by Alejandro Campos:
df = xl("A1:D14", headers=True)
def find_rows(df):
 result = []
 for group, group_df in df.groupby('Group'):
 threshold = group_df['Threshold'].iloc[0]
 below_thresh = group_df[group_df['Value'] < threshold]
 if not below_thresh.empty:
 result.append(below_thresh.iloc[[-1]])
 above_thresh = group_df[group_df['Value'] > threshold]
 if not above_thresh.empty:
 first_above = above_thresh.iloc[[0]]
 result.append(group_df[group_df['Value'] == first_above['Value'].iloc[0]])
 return pd.concat(result).reset_index(drop=True)
result_df = find_rows(df)
result_df
&&&