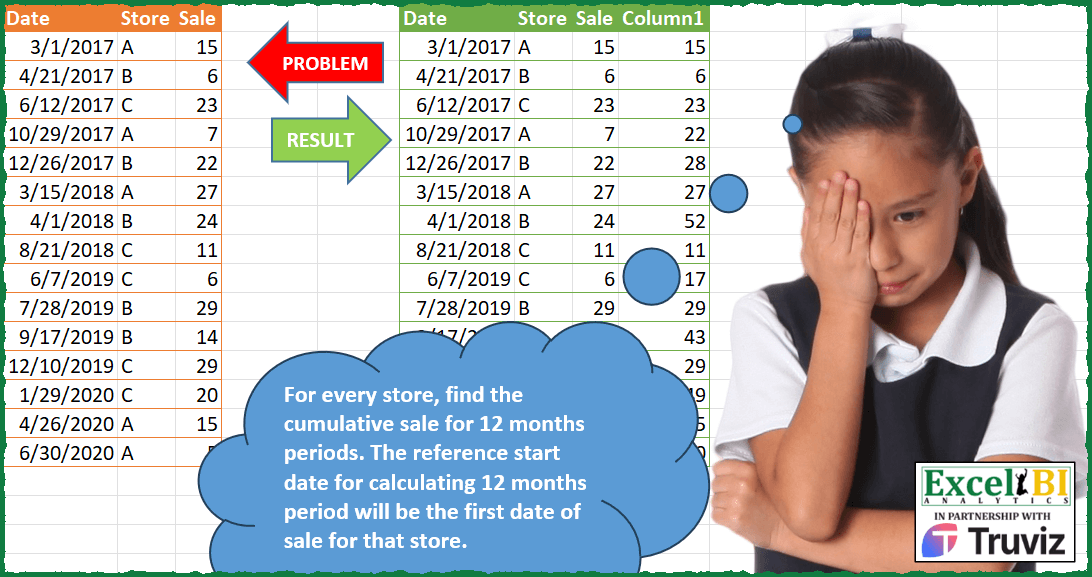
For every store, find the cumulative sale for 12 months periods. The reference start date for calculating 12 months period will be the first date of sale for that store. Ex. for store B, reference start date is 21-Apr-17. Hence, you would need to find cumulative total in following periods for store B 21-Apr-17 to 20-Apr-18 21-Apr-18 to 20-Apr-19 21-Apr-19 to 20-Apr-20 Also maintain the sort order as given
📌 Challenge Details and Links
ExcelBI Power Query Challenge Number: 145
Challenge Difficulty: ⭐️⭐️⭐️⭐️
📥Download Sample File
📥Link to the solutions on LinkedIn
Solving the challenge of 12-Month Cumulative Sales with Power Query
Power Query solution 1 for 12-Month Cumulative Sales, proposed by Kris Jaganah:
let
  Source = Excel.CurrentWorkbook(){[Name = "Table1"]}[Content],
  ChType = Table.TransformColumnTypes(Source, {{"Date", type date}}),
  Index = Table.AddIndexColumn(ChType, "Index", 1, 1, Int64.Type),
  Sort = Table.Sort(Index, {{"Store", Order.Ascending}, {"Date", Order.Ascending}}),
  Grp = Table.Group(Sort, {"Store"}, {{"Min", each List.Min([Date])}, {"All", each _}}),
  Xpand = Table.ExpandTableColumn(Grp, "All", {"Date", "Sale", "Index"}, {"Date", "Sale", "Index"}),
  Yrs = Table.AddColumn(
    Xpand,
    "Years",
    each
      let
        a = Number.IntegerDivide(Number.From(([Date] - [Min]) / 365) + 1, 1),
        b = Date.AddYears([Min], a),
        c = Number.From(b)
      in
        b
  ),
  Group = Table.Group(Yrs, {"Store", "Years"}, {{"All", each _, type table}}),
  FX = (Run as table) as table =>
    let
      a = Table.AddIndexColumn(Run, "Idx", 1, 1),
      b = Table.AddColumn(a, "Running", each List.Sum(List.FirstN(a[Sale], [Idx])))
    in
      b,
  Total = Table.TransformColumns(Group, {"All", each FX(_)}),
  X = Table.ExpandTableColumn(
    Total,
    "All",
    {"Date", "Index", "Sale", "Running"},
    {"Date", "Index", "Sale", "Column1"}
  ),
  S = Table.Sort(X, {{"Index", Order.Ascending}}),
  R = Table.SelectColumns(S, {"Date", "Store", "Sale", "Column1"})
in
  R
Power Query solution 2 for 12-Month Cumulative Sales, proposed by Alejandro Simón 🇵🇦 🇪🇸:
let
  Source = Excel.CurrentWorkbook(){[Name = "Table1"]}[Content],
  Idx = Table.AddIndexColumn(Source, "Index", 1),
  Pros = Table.Combine(
    Table.Group(
      Idx,
      {"Store"},
      {
        {
          "All",
          (x) =>
            let
              a = Table.AddIndexColumn(x, "Idx", 0),
              b = Table.AddColumn(
                a,
                "A",
                each Number.RoundDown(Duration.Days(a[Date]{[Idx]} - a[Date]{0}) / 365)
              ),
              c = Table.Combine(
                Table.Group(
                  b,
                  "A",
                  {
                    "B",
                    each
                      let
                        d = [Sale],
                        e = List.Skip(List.Accumulate(d, {0}, (s, c) => s & {c + List.Last(s)})),
                        f = Table.FromColumns(
                          Table.ToColumns(_) & {e},
                          Table.ColumnNames(_) & {"Col1"}
                        )
                      in
                        f
                  }
                )[B]
              )
            in
              c
        }
      }
    )[All]
  ),
  Sol = Table.SelectColumns(Table.Sort(Pros, "Index"), Table.ColumnNames(Source) & {"Col1"})
in
  Sol
Power Query solution 3 for 12-Month Cumulative Sales, proposed by Eric Laforce:
let
  Source = Table.TransformColumnTypes(
    Excel.CurrentWorkbook(){[Name = "tData145"]}[Content],
    {{"Date", type date}}
  ),
  RecRTP =
    let
      _G = Table.Group(Source, {"Store"}, {"DMin", each Date.From(List.Min([Date]))})
    in
      Record.FromList(List.Transform(_G[DMin], each {0, _}), _G[Store]),
  Transform = List.Accumulate(
    Table.ToRecords(Source),
    [RP = RecRTP, r = {}],
    (s, c) =>
      let
        _SP    = Record.Field(s[RP], c[Store]),
        _DD12M = c[Date] < Date.AddMonths(_SP{1}, 12),
        _NewSP = if (_DD12M) then {_SP{0} + c[Sale], _SP{1}} else {c[Sale], c[Date]},
        _NewRP = Record.TransformFields(s[RP], {c[Store], each _NewSP})
      in
        [RP = _NewRP, r = s[r] & {Record.AddField(c, "Column1", _NewSP{0})}]
  ),
  Result = Table.FromRecords(Transform[r])
in
  Result
Power Query solution 4 for 12-Month Cumulative Sales, proposed by Sandeep Marwal:
let
  Source = Excel.CurrentWorkbook(){[Name = "Table1"]}[Content],
  #"Changed Type" = Table.TransformColumnTypes(Source, {{"Date", Int64.Type}}),
  #"Grouped Rows" = Table.Group(
    #"Changed Type",
    {"Store"},
    {
      {
        "Count",
        each [
          #"Grouped Rows1" = Table.Group(
            _,
            {"Date"},
            {
              {
                "Count",
                (z) =>
                  [
                    B = Table.AddIndexColumn(z, "Index", 1, 1, Int64.Type),
                    #"Added Custom" = Table.AddColumn(
                      B,
                      "Custom",
                      each List.Sum(List.FirstN(B[Sale], [Index]))
                    )
                  ][#"Added Custom"]
              }
            },
            1,
            (c, n) => Number.From(Number.From(n[Date] - c[Date]) >= 365)
          )
        ][#"Grouped Rows1"]
      }
    }
  ),
  #"Expanded Count" = Table.ExpandTableColumn(
    #"Grouped Rows",
    "Count",
    {"Date", "Count"},
    {"Date", "Count.1"}
  ),
  #"Expanded Count.1" = Table.ExpandTableColumn(
    #"Expanded Count",
    "Count.1",
    {"Date", "Store", "Sale", "Index", "Custom"},
    {"Date.1", "Store.1", "Sale", "Index", "Custom"}
  ),
  #"Removed Columns" = Table.RemoveColumns(#"Expanded Count.1", {"Date", "Store.1", "Index"}),
  #"Changed Type1" = Table.TransformColumnTypes(#"Removed Columns", {{"Date.1", type date}}),
  #"Reordered Columns" = Table.ReorderColumns(
    #"Changed Type1",
    {"Date.1", "Store", "Sale", "Custom"}
  ),
  #"Sorted Rows" = Table.Sort(#"Reordered Columns", {{"Date.1", Order.Ascending}})
in
  #"Sorted Rows"
Power Query solution 5 for 12-Month Cumulative Sales, proposed by Glyn Willis:
let
  Source = Excel.CurrentWorkbook(){[Name = "Table1"]}[Content],
  #"Changed Type" = Table.TransformColumnTypes(
    Source,
    {{"Date", type date}, {"Store", type text}, {"Sale", Int64.Type}}
  ),
  #"Added Custom" = Table.AddColumn(
    #"Changed Type",
    "C",
    each [
      #"1B" = List.Buffer(
        List.Zip({#"Changed Type"[Store], #"Changed Type"[Date], #"Changed Type"[Sale]})
      ),
      S = [Store],
      D = [Date],
      FD = List.Transform(List.Select(#"1B", (x) => x{0} = S), (x) => x{1}),
      LD = {FD{0}, Date.AddDays(Date.AddMonths(FD{0}, 12), - 1)},
      Y = List.Count(List.Distinct(List.Transform(FD, (x) => Date.Year(x)))),
      C = List.Select(
        List.Transform({- 1 .. Y + 1}, (x) => {Date.AddYears(LD{0}, x), Date.AddYears(LD{1}, x)}),
        (y) => y{0} <= D and y{1} >= D
      ){0},
      #"1" = List.Transform(#"1B", (x) => x{0} = S),
      #"2" = List.Transform(
        #"1B",
        (x) => List.Median({C{0}, x{1}, if C{1} > D then D else C{1}}) = x{1}
      ),
      L = List.Transform(List.Zip({#"1", #"2"}), (x) => List.AllTrue(x)),
      P = List.PositionOf(L, true, Occurrence.All),
      R = List.Sum(List.Transform(P, (x) => #"1B"{x}?{2}))
    ][R]
  )
in
  #"Added Custom"
Power Query solution 6 for 12-Month Cumulative Sales, proposed by Arden Nguyen, CPA:
let
  Source = Excel.CurrentWorkbook(){[Name = "Table1"]}[Content],
  types = Table.Repeat(
    Table.TransformColumnTypes(Source, {{"Date", type date}, {"Sale", Int64.Type}}),
    1
  ),
  idx = Table.AddIndexColumn(types, "Index", 0, 1, Int64.Type),
  g1 = Table.Group(
    idx,
    {"Store"},
    {
      {
        "Rows",
        each
          let
            min = List.Min(_[Date])
          in
            Table.AddColumn(
              _,
              "Min Date",
              (x) =>
                let
                  d = Date.AddYears(min, Date.Year(x[Date]) - Date.Year(min))
                in
                  if x[Date] < d then Date.AddYears(d, - 1) else d
            )
      }
    }
  ),
  exp1 = Table.ExpandTableColumn(g1, "Rows", {"Min Date", "Date", "Sale", "Index"}),
  g2 = Table.Group(
    exp1,
    {"Store", "Min Date", "Date"},
    {
      {
        "Rows",
        each
          let
            cumulative_sum = List.Accumulate(_[Sale], {}, (s, c) => s & {(List.Last(s) ?? 0) + c})
          in
            Table.FromColumns(
              Table.ToColumns(_) & {cumulative_sum},
              Table.ColumnNames(_) & {"Cumulative"}
            )
      }
    },
    GroupKind.Local,
    (x, y) => Byte.From(y[Min Date] <> x[Min Date] or x[Store] <> y[Store])
  ),
  rmv = Table.SelectColumns(g2, {"Rows"}),
  exp2 = Table.ExpandTableColumn(rmv, "Rows", {"Store", "Date", "Sale", "Index", "Cumulative"}),
  sort = Table.Sort(exp2, {{"Index", Order.Ascending}}),
  final = Table.RemoveColumns(sort, {"Index"})
in
  final
Solving the challenge of 12-Month Cumulative Sales with Excel
Excel solution 1 for 12-Month Cumulative Sales, proposed by Bo Rydobon 🇹🇭:
=LET(a,A2:A16,b,B2:B16,s,XLOOKUP(b,b,a),SUMIFS(C2:C16,b,b,a,">="&EDATE(s,12*INT(YEARFRAC(+a,s))),a,"<="&a))Excel solution 2 for 12-Month Cumulative Sales, proposed by محمد حلمي:
=LET(b,A2:A16,r,DROP(REDUCE(0,b,LAMBDA(a,d,LET(
e,OFFSET(d,,1),i,--XLOOKUP(e,LEFT(a),RIGHT(a,5),0,,-1),
VSTACK(a,e&IF(d
Excel solution 3 for 12-Month Cumulative Sales, proposed by Kris Jaganah:
=LET(a,A2:C16,b,SEQUENCE(ROWS(a)),c,SORT(HSTACK(a,b),{2,1}),d,CHOOSECOLS(c,2),f,TAKE(c,,1),g,SCAN(0,(SORT(TAKE(c,,-1))-XMATCH(d,d)=0)*(f),LAMBDA(x,y,IF(y>0,y,x))),h,DATE(YEAR(g)+INT((f-g)/365+1),MONTH(g),DAY(g)),i,VSTACK(HSTACK(A1:C1,"Column1"),HSTACK(a,SORTBY(SCAN(0,(h=VSTACK(@h,DROP(h,-1)))/100+CHOOSECOLS(c,3),LAMBDA(x,y,IF(INT(y)=y,y,INT(x+y)))),TAKE(c,,-1)))),i)Solving the challenge of 12-Month Cumulative Sales with R
R solution 1 for 12-Month Cumulative Sales, proposed by Konrad Gryczan, PhD:
library(tidyverse)
library(readxl)
input = read_excel("Power Query/PQ_Challenge_145.xlsx", range = "A1:C16")
test = read_excel("Power Query/PQ_Challenge_145.xlsx", range = "F1:I16")
result = input %>%
 group_by(Store) %>%
 mutate(min_date = min(Date),
 year = case_when(
 between(Date, min_date, min_date + years(1)) ~ 1,
 between(Date, min_date + years(1), min_date + years(2)) ~ 2,
 between(Date, min_date + years(2), min_date + years(3)) ~ 3,
 between(Date, min_date + years(3), min_date + years(4)) ~ 4,
 between(Date, min_date + years(4), min_date + years(5)) ~ 5
 )) %>%
 ungroup() %>%
 group_by(Store, year) %>%
 mutate(Column1 = cumsum(Sale)) %>%
 ungroup() %>%
 select(-year, -min_date)
&&&