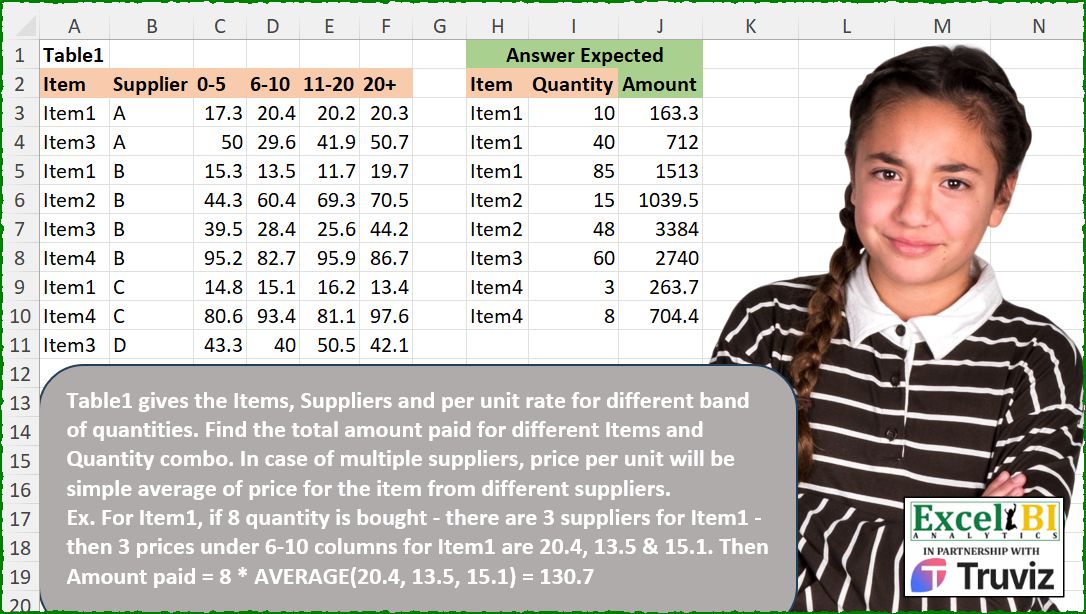
Table1 gives the Items, Suppliers and per unit rate for different band of quantities. Find the total amount paid for different Items and Quantity combo. In case of multiple suppliers, price per unit will be simple average of price for the item from different suppliers. Ex. For Item1, if 8 quantity is bought – there are 3 suppliers for Item1 – then 3 prices under 6-10 columns for Item1 are 20.4, 13.5 & 15.1. Then Amount paid = 8 * AVERAGE(20.4, 13.5, 15.1) = 130.7
📌 Challenge Details and Links
ExcelBI Excel Challenge Number: 539
Challenge Difficulty: ⭐️⭐️
📥Download Sample File
📥Link to the solutions on LinkedIn
Solving the challenge of Compute Average Supplier Price with Power Query
Power Query solution 1 for Compute Average Supplier Price, proposed by Kris Jaganah:
let
  S = (x) => Excel.CurrentWorkbook(){[Name = x]}[Content],
  A = Table.UnpivotOtherColumns(S("Table1"), {"Item", "Supplier"}, "At", "Va"),
  B = Table.TransformColumns(A, {"At", each Number.From(Text.SplitAny(_, "-+"){0})}),
  C = Table.Group(B, {"Item", "At"}, {"Average", each List.Average([Va])}),
  D = Table.AddColumn(
    S("Table2"),
    "Amount",
    each List.Last(Table.SelectRows(C, (y) => y[Item] = [Item] and [Quantity] >= y[At])[Average])
      * [Quantity]
  )
in
  D
Power Query solution 2 for Compute Average Supplier Price, proposed by Alejandro Simón 🇵🇦 🇪🇸:
let
  T1 = Excel.CurrentWorkbook(){[Name = "Table1"]}[Content],
  T2 = Excel.CurrentWorkbook(){[Name = "Table2"]}[Content],
  Sol = Table.AddColumn(
    T2,
    "Custom",
    (x) =>
      let
        a = T1,
        b = Table.SelectRows(a, each [Item] = x[Item]),
        c = List.Transform(
          List.RemoveLastN(List.Skip(Table.ColumnNames(b), 2)),
          each List.Transform(Text.Split(_, "-"), Number.From)
        ),
        d = List.PositionOf(
          List.Transform(c, each List.Contains({_{0} .. _{1}}, x[Quantity])),
          true
        ),
        e = if d < 0 then 5 else d + 2,
        f = List.Average(Table.ToColumns(Table.SelectColumns(b, Table.ColumnNames(b){e})){0})
          * x[Quantity]
      in
        f
  )
in
  Sol
Power Query solution 3 for Compute Average Supplier Price, proposed by Abdallah Ally:
let
  f = (x) => Excel.CurrentWorkbook(){[Name = x]}[Content],
  Group = Table.Group(
    f("Table1"),
    "Item",
    {
      {"0-5", each List.Average([#"0-5"])},
      {"6-10", each List.Average([#"6-10"])},
      {"11-20", each List.Average([#"11-20"])},
      {"20+", each List.Average([#"20+"])}
    }
  ),
  Merge = Table.Join(Group, "Item", f("Table2"), "Item"),
  Result = Table.AddColumn(
    Merge,
    "Amount",
    each Number.Round(
      if [Quantity] = null then
        null
      else if [Quantity] < 6 then
        [Quantity] * [#"0-5"]
      else if [Quantity] < 11 then
        [Quantity] * [#"6-10"]
      else if [Quantity] < 20 then
        [Quantity] * [#"11-20"]
      else
        [Quantity] * [#"20+"],
      1
    )
  )[[Item], [Quantity], [Amount]]
in
  Result
Power Query solution 4 for Compute Average Supplier Price, proposed by Meganathan Elumalai:
let
  Source = Excel.CurrentWorkbook(){[Name = "Table1"]}[Content],
  Tbl = Excel.CurrentWorkbook(){[Name = "Table2"]}[Content],
  Unpivot = Table.UnpivotOtherColumns(Source, {"Item", "Supplier"}, "Group", "Price"),
  Grouping = Table.Group(Unpivot, {"Item", "Group"}, {{"Sample", each _[Price]}}),
  Replace = Table.TransformColumns(
    Grouping,
    {{"Group", each Text.Split(Text.Replace(_, "+", "-1000"), "-")}}
  ),
  Result = Table.AddColumn(
    Tbl,
    "New",
    (f) =>
      f[Quantity]
        * List.Average(
          Table.SelectRows(
            Replace,
            each f[Item]
              = _[Item]
                and (f[Quantity] <= Number.From(_[Group]{1}))
                and (f[Quantity] >= Number.From(_[Group]{0}))
          )[Sample]{0}
        )
  )
in
  Result
Solving the challenge of Compute Average Supplier Price with Excel
Excel solution 1 for Compute Average Supplier Price, proposed by Bo Rydobon 🇹🇭:
=MAP(H3:H10,I3:I10,LAMBDA(i,q,q*AVERAGE(XLOOKUP(q,--TEXTBEFORE(C2:F2,{"-","+"}),FILTER(C3:F11,A3:A11=i),,-1))))Excel solution 2 for Compute Average Supplier Price, proposed by John V.:
=MAP(I3:I10,LAMBDA(x,x*AVERAGEIF(A3:A11,@+H10:x,XLOOKUP(x,--TEXTBEFORE(C2:F2,{"-";"+"}),C3:F11,,-1))))Excel solution 3 for Compute Average Supplier Price, proposed by محمد حلمي:
=MAP(H3:H10,I3:I10,LAMBDA(a,b,b*AVERAGE(FILTER(
INDEX(C3:F11,,XMATCH(b,--TEXTAFTER(C2:F2,"-",,,,99),1)),
A3:A11=a))))
Excel solution 4 for Compute Average Supplier Price, proposed by محمد حلمي:
=MAP(
    H3:H10,
    I3:I10,
    LAMBDA(
        a,
        b,
        b*
        INDEX(
            BYCOL(
                C3:F11,
                LAMBDA(
                    x,
                    AVERAGEIF(
                        A3:A11,
                        a,
                        x
                    )
                )
            ),

            XMATCH(
                b,
                --TEXTAFTER(
                    C2:F2,
                    "-",
                    ,
                    ,
                    ,
                    99
                ),
                1
            )
        )
    )
)
Excel solution 5 for Compute Average Supplier Price, proposed by Kris Jaganah:
=LET(a,HSTACK("",--TEXTBEFORE(C2:F2,"-",,,,21)),b,GROUPBY(A3:A11,C3:F11,AVERAGE,,0),c,H3:H10,d,I3:I10,MAP(c,d,LAMBDA(x,y,XLOOKUP(x,TAKE(b,,1),XLOOKUP(y,a,b,,-1))*y)))Excel solution 6 for Compute Average Supplier Price, proposed by Julian Poeltl:
=LET(
    I,
    A3:A11,
    T,
    C3:F11,
    B,
    --TEXTBEFORE(
        C2:F2,
        {"-",
        "+"}
    ),
    Q,
    I3:I10,
    Q*MAP(
        Q,
        H3:H10,
        LAMBDA(
            Q,
            A,
            AVERAGE(
                FILTER(
                    CHOOSECOLS(
                        T,
                        XMATCH(
                            Q,
                            B,
                            -1
                        )
                    ),
                    I=A
                )
            )
        )
    )
)
Excel solution 7 for Compute Average Supplier Price, proposed by Timothée BLIOT:
=MAP(L3:L10,M3:M10, LAMBDA(v,w, XLOOKUP(w, {0,6,11,20}, BYCOL(FILTER(C3:F11,A3:A11=v),LAMBDA(x,AVERAGE(x))),,-1)*w))Excel solution 8 for Compute Average Supplier Price, proposed by Sunny Baggu:
=LET(

     h,
     TEXTBEFORE(
         C2:F2,
          "-",
          ,
          ,
          ,
          TEXTBEFORE(
              C2:F2,
               "+"
          )
     ) + 0,

     MAP(

          H3:H10,

          I3:I10,

          LAMBDA(
              a,
               b,

               b *
               AVERAGE(

                    TOCOL(
                        XLOOKUP(
                            b,
                             h,
                             C3:F11,
                             ,
                             -1
                        ) * IF(
                            A3:A11 = a,
                             1,
                             x
                        ),
                         3
                    )

               )

          )

     )

)
Excel solution 9 for Compute Average Supplier Price, proposed by Pieter de B.:
=MAP(
    H3:H10,
    I3:I10,
    LAMBDA(
        a,
        b,
        AVERAGE(
            INDEX(
                FILTER(
                    C3:F11,
                    A3:A11=a
                ),
                ,
                IFNA(
                    XMATCH(
                        b,
                        --TEXTAFTER(
                            C2:E2,
                            "-"
                        ),
                        1
                    ),
                    4
                )
            )
        )*b
    )
)
Excel solution 10 for Compute Average Supplier Price, proposed by Eddy Wijaya:
=LET(
db,A3:F11,
MAP(H3:H10,I3:I10,LAMBDA(m,q,LET(
adjdb,FILTER(DROP(db,,2),TAKE(db,,1)=m),
col,--TEXTBEFORE(C2:F2,{"-","+"}),
q*AVERAGE(XLOOKUP(q,col,adjdb,,-1))))))
Excel solution 11 for Compute Average Supplier Price, proposed by Mey Tithveasna:
=MAP(
    H3:H10,
    I3:I10,
    LAMBDA(
        h,
        i,
        AVERAGE(
            INDEX(
                FILTER(
                    C3:F11,
                    A3:A11=h
                ),
                ,
                IFERROR(
                    XMATCH(
                        i,
                        --TEXTAFTER(
                            C2:F2,
                            "-"
                        ),
                        1
                    ),
                    COLUMNS(
                        C2:F2
                    )
                )
            )
        )*i
    )
)
Excel solution 12 for Compute Average Supplier Price, proposed by Nicolas Micot:
=MAP(
    H3:H10;
    I3:I10;
    LAMBDA(
        l_item;
        l_quantity;
        LET(
            _col;
            EQUIV(
                l_quantity;
                {0;
                6;
                11;
                21};
                1
            );
            MOYENNE(
                FILTRE(
                    INDEX(
                        C3:F11;
                        0;
                        _col
                    );
                    A3:A11=l_item
                )
            )*l_quantity
        )
    )
)
Excel solution 13 for Compute Average Supplier Price, proposed by Ricardo Alexis Domínguez Hernández:
=MAP(
    H3:H10,
    I3:I10,

    LAMBDA(
        x,
        y,

        AVERAGE(
            CHOOSECOLS(
                FILTER(
                    C2:F11,
                    A2:A11=x
                ),
                XMATCH(
                    y,
                    TEXTBEFORE(
                        C2:F2,
                        "-",
                        ,
                        ,
                        ,
                        TEXTBEFORE(
                            C2:F2,
                            "+"
                        )
                    )*1,
                    -1
                )
            )
        )*y
    )
)
Solving the challenge of Compute Average Supplier Price with Python
Python solution 1 for Compute Average Supplier Price, proposed by Konrad Gryczan, PhD:
import pandas as pd
path = '539 Total Amount Per Item.xlsx'
input1 = pd.read_excel(path, usecols="A:F", skiprows=1, nrows=9)
input2 = pd.read_excel(path, usecols="H:I", skiprows=1, nrows=8)
test = pd.read_excel(path, usecols="J", skiprows=1, nrows=8)
input2.columns = input2.columns.str.replace(".1", "")
r1 = input1.melt(id_vars=["Item", "Supplier"], var_name="Range", value_name="Price")
r2 = input2.assign(Range=pd.cut(input2["Quantity"], bins=[0, 5, 10, 20, float("inf")], labels=["0-5", "6-10", "11-20", "20+"]))
r3 = r2.merge(r1, on=["Item", "Range"])
 .groupby(["Item", "Quantity"]).agg(avg_price=("Price", "mean")).reset_index()
 .assign(Amount=lambda x: round(x["Quantity"] * x["avg_price"], 1))
print(r3["Amount"].equals(test["Amount"])) # True
Solving the challenge of Compute Average Supplier Price with Python in Excel
Python in Excel solution 1 for Compute Average Supplier Price, proposed by Alejandro Campos:
df_table1 = xl("A2:F11", headers=True)
df_items_quantity = xl("H2:I10", headers=True)
def calculate_amount(item, quantity):
 item_df = df_table1[df_table1['Item'] == item]
 if 0 <= quantity <= 5:
 column = '0-5'
 elif 6 <= quantity <= 10:
 column = '6-10'
 elif 11 <= quantity <= 20:
 column = '11-20'
 else:
 column = '20+'
 avg_price_per_unit = item_df[column].mean()
 total_amount = quantity * avg_price_per_unit
 return total_amount
results = []
for index, row in df_items_quantity.iterrows():
 item = row['Item']
 quantity = row['Quantity']
 amount_paid = calculate_amount(item, quantity)
 results.append({'Item': item, 'Quantity': quantity, 'Amount': amount_paid})
results_df = pd.DataFrame(results)
results_df
Python in Excel solution 2 for Compute Average Supplier Price, proposed by Ümit Barış Köse, MSc:
df = xl("A2:F11", headers=True)
result_df = xl("H2:I10", headers=True)
def calculate_amount(item, quantity):
 item_df = df[df['Item'] == item]
 if item_df.empty:
 return 0
 price_columns = ['0-5', '6-10', '11-20', '20+']
 avg_prices = item_df[price_columns].mean()
 if quantity <= 5:
 price = avg_prices['0-5']
 elif quantity <= 10:
 price = avg_prices['6-10']
 elif quantity <= 20:
 price = avg_prices['11-20']
 else:
 price = avg_prices['20+']
 return quantity * price
def calculate_results(df_result):
 df_result['Calculated Amount'] = df_result.apply(lambda row: calculate_amount(row['Item'], row['Quantity']), axis=1)
 return df_result
calculated_results_df = calculate_results(result_df)
calculated_results_df
&&&