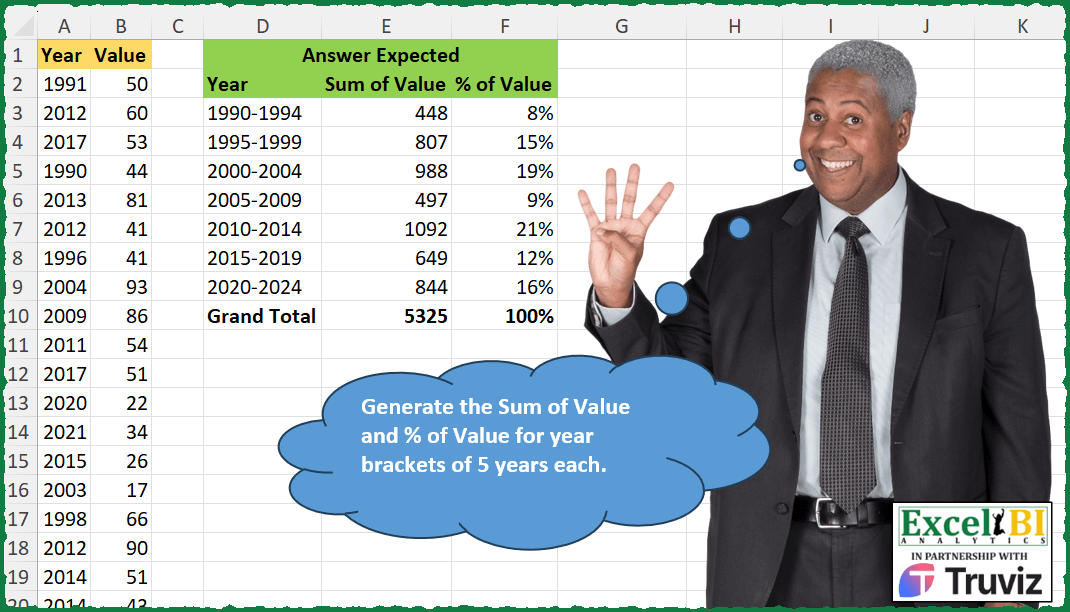
Generate the Sum of Value and % of Value for year brackets of 5 years each.
📌 Challenge Details and Links
ExcelBI Excel Challenge Number: 403
Challenge Difficulty: ⭐️⭐️
📥Download Sample File
📥Link to the solutions on LinkedIn
Solving the challenge of Summarize by Five-Year Brackets with Power Query
Power Query solution 1 for Summarize by Five-Year Brackets, proposed by John V.:
let
 S = Excel.CurrentWorkbook(){0}[Content],
 T = Text.From, L = List.Sum, Z = L(S[Value]), A = "Year", B = "Sum of Value", C = "% of Value",
 Y = Table.TransformColumns(S, {A, each let a = 5 * Number.RoundDown(_ / 5) in T(a) & T(-a-4)}),
 G = Table.Group(Y, A, {{B, each L([Value])}, {C, each L([Value]) / Z, Percentage.Type}}),
 R = Table.InsertRows(G, Table.RowCount(G), {Record.FromList({"Grand Total", Z, 1}, {A, B, C})})
in
 Table.Sort(R, {A, 0})

Blessings!
Power Query solution 2 for Summarize by Five-Year Brackets, proposed by Alejandro Simón 🇵🇦 🇪🇸:
let
  Source = Excel.CurrentWorkbook(){[Name = "Table1"]}[Content],
  List = List.Split(List.Distinct({List.Min(Source[Year]) .. 2024}), 5),
  Years = List.Transform(List, each {List.First(_), List.Last(_)}),
  Sum = List.Transform(
    {0 .. List.Count(List) - 1},
    each List.Sum(
      List.Transform(Table.ToRows(Source), (x) => if List.Contains(List{_}, x{0}) then x{1} else 0)
    )
  ),
  Total = List.Sum(Sum),
  #"%" = List.Transform(Sum, each Number.ToText(_ / Total, "#%")),
  Sol = Table.FromColumns(
    {
      List.Transform(Years, each Text.From(_{0}) & "-" & Text.From(_{1})) & {"Grand Total"},
      Sum & {Total},
      #"%" & {"100%"}
    },
    {"Year", "Sum of Values", "% of Values"}
  )
in
  Sol
Power Query solution 3 for Summarize by Five-Year Brackets, proposed by Luan Rodrigues:
let
 Fonte = Tabela1,
 list = List.Split(List.Sort(List.Distinct(Fonte[Year]),0),5),
 tab = List.Transform({0..List.Count(list)-1}, (x)=>
 [a = Table.Group(Table.SelectRows(Fonte, each
 List.ContainsAny({[Year]}, list{x})),{"Year"},{"Value", each List.Sum([Value])} ),
 b = Table.FromRows({{Text.From(List.Min(a[Year]))&"-"&Text.From(List.Max(a[Year]))}&{List.Sum(a[Value])}},{"Year","Value"})][b]),
 res = let
a = Table.Combine(tab),
b = Table.AddColumn(a,"% of Value", each [Value]/List.Sum(a[Value])),
c = b & hashtag#table(Table.ColumnNames(b),{{"Grand Total",List.Sum(b[Value]),List.Sum(b[#"% of Value"])}}),
d = Table.TransformColumnTypes(c,{{"% of Value", Percentage.Type}})
in
d
in
 res
Power Query solution 4 for Summarize by Five-Year Brackets, proposed by Ramiro Ayala Chávez:
let
  S = Excel.CurrentWorkbook(){[Name = "Table1"]}[Content],
  a = Table.Group(S, {"Year"}, {{"F", each List.Sum([Value])}}),
  b = Table.InsertRows(a, Table.RowCount(a), {[Year = 2006, F = 0], [Year = 2024, F = 0]}),
  c = Table.Group(b, {"Year"}, {{"G", each _}}),
  d = Table.Sort(c, {{"Year", 0}})[[G]],
  e = Table.Split(d, 5),
  f = List.Transform(e, each Table.Combine(_[G])),
  g = List.Transform(
    f,
    each Table.AddColumn(
      _,
      "Y",
      (x) => Text.From(List.First([Year])) & "-" & Text.From(List.Last([Year]))
    )
  ),
  h = List.Transform(g, each Table.AddColumn(_, "S", (x) => List.Sum([F]))[[Y], [S]]),
  i = Table.Combine(List.Transform(h, each Table.Distinct(_))),
  j = Table.AddColumn(i, "% of Value", each Number.Round([S] / List.Sum(i[S]), 2)),
  k = {"Grand Total"} & List.Transform(List.Skip(Table.ToColumns(j)), List.Sum),
  l = j & Table.FromRows({k}, {"Y", "S", "% of Value"}),
  Sol = Table.RenameColumns(l, {{"Y", "Year"}, {"S", "Sum of Value"}})
in
  Sol
Power Query solution 5 for Summarize by Five-Year Brackets, proposed by Mihai Radu O:
let
  Source = Excel.CurrentWorkbook(){[Name = "Table1"]}[Content],
  sort = Table.Sort(Source, {{"Year", Order.Ascending}}),
  perioada = Table.TransformColumns(
    sort,
    {
      {
        "Year",
        each
          let
            a = Number.RoundDown(_ / 5) * 5
          in
            Text.From(a) & "-" & Text.From(a + 4)
      }
    }
  ),
  group = Table.Group(perioada, {"Year"}, {{"Sum", each List.Sum([Value]), type number}}),
  percent = Table.AddColumn(
    group,
    "PercentOf",
    each Number.Round([Sum] / List.Sum(group[Sum]), 2),
    Percentage.Type
  ),
  GT =
    let
      a = Table.ToColumns(percent),
      b = List.Transform(
        {0 .. List.Count(a) - 1},
        (x) => if x = 0 then "Grand Total" else List.Sum(a{x})
      ),
      c = List.Zip({Table.ColumnNames(percent), b}),
      d = Table.PromoteHeaders(Table.Transpose(Table.FromRows(c)))
    in
      d,
  sol = Table.Combine({percent, GT})
in
  sol
Power Query solution 6 for Summarize by Five-Year Brackets, proposed by Glyn Willis:
let
  gt = Table.AddColumn(
    Table.Group(
      Source,
      {},
      {
        {"Sum of Value", each List.Sum([Value]), type nullable number},
        {
          "% of Value",
          each
            let
              s = List.Sum([Value])
            in
              s / s,
          type nullable Percentage.Type
        }
      }
    ),
    "Year",
    each "Grand Total",
    type text
  ),
  Source = Excel.CurrentWorkbook(){[Name = "Table1"]}[Content],
  agg = Table.CombineColumns(
    Table.TransformColumnTypes(
      Table.SelectRows(
        Table.ExpandRecordColumn(
          Table.AddColumn(
            [
              s = Number.RoundDown(List.Min(Source[Year]) / 5, 0) * 5,
              e = Number.RoundUp(List.Max(Source[Year]) / 5, 0) * 5,
              i = (e - s) / 5,
              y = Table.FromRecords(
                List.Transform({0 .. i}, (x) => [sy = s + (x * 5), ey = s + ((x + 1) * 5) - 1])
              )
            ][y],
            "sum-pct",
            each [
              sum = List.Sum(
                Table.SelectRows(Source, (x) => List.Median({[sy], x[Year], [ey]}) = x[Year])[Value]
              ),
              pct = (sum / gt[#"Sum of Value"]{0})
            ]
          ),
          "sum-pct",
          {"sum", "pct"},
          {"Sum of Value", "% of Value"}
        ),
        (x) => x[Sum of Value] <> null
      ),
      {
        {"Sum of Value", Int64.Type},
        {"% of Value", Percentage.Type},
        {"sy", type text},
        {"ey", type text}
      }
    ),
    {"sy", "ey"},
    Combiner.CombineTextByDelimiter("-", QuoteStyle.None),
    "Year"
  ),
  ct = Table.Combine({agg, gt})
in
  ct
Solving the challenge of Summarize by Five-Year Brackets with Excel
Excel solution 1 for Summarize by Five-Year Brackets, proposed by Bo Rydobon 🇹🇭:
=LET(
    a,
    FLOOR(
        A2:A100,
        5
    ),
    VSTACK(
        D2:F2,
        DROP(
            GROUPBY(
                a&-a-4,
                B2:B100,
                HSTACK(
                    SUM,
                    PERCENTOF
                )
            ),
            1
        )
    )
)
Excel solution 2 for Summarize by Five-Year Brackets, proposed by John V.:
=LET(
    i,
    FLOOR(
        A2:A100,
        5
    ),
    VSTACK(
        HSTACK(
            A1,
            {"Sum",
            "%"}&" of "&B1
        ),
        DROP(
            GROUPBY(
                i&-i-4,
                B2:B100,
                HSTACK(
                    SUM,
                    PERCENTOF
                )
            ),
            1
        )
    )
)
Excel solution 3 for Summarize by Five-Year Brackets, proposed by محمد حلمي:
=LET(j,
    A2:A100,
    e,
    MIN(
        j
    ),
    m,
    SEQUENCE(ROUNDUP(
(MAX(
        j
    )-e+1)/5,
    ),
    ,
    e,
    5),
    i,
    MAP(m,
    LAMBDA(a,

SUM((j=a)*B2:B100))),
    s,
    SUM(
        i
    ),
    VSTACK(

        HSTACK(
            m&-m-4,
            i,
            i/s
        ),
        HSTACK(
            "Grand Total",
            s,
            1
        )
    ))
Excel solution 4 for Summarize by Five-Year Brackets, proposed by 🇰🇷 Taeyong Shin:
=LET(y,
    A1:A100,
    m,
    MIN(
        y
    ),
    f,
    LAMBDA(x,
    SEQUENCE(CEILING((MAX(
        y
    )-m+1)/5,
    1),
    ,
    x,
    5)),
    s,
    f(
        m
    ),
    e,
    f(
        m+4
    ),
    GROUPBY(
        IFNA(
            LOOKUP(
                y,
                s
            )&"-"&XLOOKUP(
                y,
                e,
                e,
                ,
                1
            ),
            A1
        ),
        B1:B100,
        HSTACK(
            SUM,
            PERCENTOF
        ),
        3,
        1
    ))
Excel solution 5 for Summarize by Five-Year Brackets, proposed by Kris Jaganah:
=VSTACK(
    {"Year",
    "Sum of Value",
    "% of Value"},
    DROP(
        GROUPBY(
            LET(
                a,
                INT(
                    A2:A100/5
                )*5,
                a&"-"&a+4
            ),
            B2:B100,
            HSTACK(
                SUM,
                PERCENTOF
            ),
            ,
            1
        ),
        1
    )
)
Excel solution 6 for Summarize by Five-Year Brackets, proposed by Julian Poeltl:
=LET(Dat,
    A2:A100,
    V,
    B2:B100,
    SD,
    MIN(
        Dat
    ),
    ED,
    MAX(
        Dat
    ),
    EDSS,
    ROUNDDOWN(
        ED/5,
        0
    )*5,
    StS,
    SEQUENCE(ROUNDDOWN ((EDSS-SD)/5,
    0)+1,
    ,
    SD,
    5),
    ES,
    StS+4,
    Y,
    MAP(
        StS,
        ES,
        LAMBDA(
            A,
            B,
            TEXTJOIN(
                "-",
                ,
                A,
                B
            )
        )
    ),
    S,
    SUMIFS(
        V,
        Dat,
        ">="&StS,
        Dat,
        "<="&ES
    ),
    PRZ,
    S/SUM(
        S
    ),
    VSTACK(
        HSTACK(
            "Year",
            "Sum of Value",
             "% of Value"
        ),
        HSTACK(
            Y,
            S,
            PRZ
        ),
        HSTACK(
            "Grand Total",
            SUM(
        S
    ),
            SUM(
                PRZ
            )
        )
    ))
Excel solution 7 for Summarize by Five-Year Brackets, proposed by Timothée BLIOT:
=VSTACK(
    {"Year",
    "Sum of Value",
    "% of value"},
    DROP(
        GROUPBY(
            LET(
                A,
                FLOOR(
                    A2:A100,
                    5
                ),
                A&"-"&A+4
            ),
            B2:B100,
            HSTACK(
                SUM,
                PERCENTOF
            )
        ),
        1
    )
)
Excel solution 8 for Summarize by Five-Year Brackets, proposed by Oscar Mendez Roca Farell:
=LET(_a,
     A2:A100,
    _y,
     TOROW(
         SORT(
             UNIQUE(
                 FLOOR(
                     _a,
                      5
                 )
             )
         )
     ),
    _m,
     MMULT(TOROW(
         _a
     )^0,
     (_a>=_y)*((_a<=_y+4))*B2:B100),
    _t,
     TRANSPOSE(
         VSTACK(
             _y&"-"&_y+4,
             _m,
              ROUND(
                  _m/SUM(
                      _m
                  )%,

              )
         )
     ),
    _n,
     MMULT(
         _y^0,
         N(
             _t
         )
     ),
    VSTACK(
        _t,
         IF(
             _n,
             _n,
             "Grand Total"
         )
    ))
Excel solution 9 for Summarize by Five-Year Brackets, proposed by Sunny Baggu:
=LET(
 _y1,
     SEQUENCE((CEILING.MATH(
         MAX(
             A2:A100
         ),
          5
     ) - MIN(
             A2:A100
         ) + 1) / 5,
     ,
     MIN(
             A2:A100
         ),
     5),

 _y2,
     _y1 + 4,

 _s,
     MAP(_y1,
     _y2,
     LAMBDA(a,
     b,
     SUM(FILTER(B2:B100,
     (A2:A100 >= a) * (A2:A100 <= b))))),

 _sp,
     ROUND(
         100 * _s / SUM(
             _s
         ),
          0
     ),

 VSTACK(
     HSTACK(
         _y1 & "-" & _y2,
          _s,
          _sp
     ),
      HSTACK(
          "Grand Total",
           SUM(
             _s
         ),
           SUM(
               _sp
           )
      )
 )
)
Excel solution 10 for Summarize by Five-Year Brackets, proposed by LEONARD OCHEA 🇷🇴:
=LET(
    y,
    A2:A100,
    v,
    B1:B100,
    m,
    FLOOR(
        y,
        5
    ),
    GROUPBY(
        VSTACK(
            A1,
            m&"-"&m+4
        ),
        v,
        HSTACK(
            SUM,
            PERCENTOF
        ),
        3
    )
)
Excel solution 11 for Summarize by Five-Year Brackets, proposed by Charles Roldan:
=LET(
 Year,
     A2:A100,

 Value,
     B2:B100,

 Headers,
     D2:F2,

 Period,
     5 * INT(
         Year / 5
     ),

 Key,
     SORT(
         UNIQUE(
             Period
         )
     ),

 Total,
     MMULT(--(Key = TOROW(
             Period
         )),
     Value),

 Grand,
     SUM(
         Total
     ),

 VSTACK(

      Headers,

      HSTACK(
          Key & "-" & Key + 4,
           Total,
           TEXT(
               Total / Grand,
                "0%"
           )
      ),

      HSTACK(
          "Grand Total",
           Grand,
           "100%"
      )

 )
)
Excel solution 12 for Summarize by Five-Year Brackets, proposed by Bilal Mahmoud kh.:
=LET(
    a,
    TEXTBEFORE(
        D3:D9,
        "-"
    )*1,
    b,
    TEXTAFTER(
        D3:D9,
        "-"
    )*1,
    c,
    MAP(
        a,
        b,
        LAMBDA(
            x,
            y,
            SUM(
                FILTER(
                    B2:B100,
                    MAP(
                        A2:A100,
                        LAMBDA(
                            z,
                            AND(
                                z>=x,
                                z<=y
                            )
                        )
                    )
                )
            )
        )
    ),
    e,
    SUM(
        c
    ),
    f,
    c/e,
    j,
    VSTACK(
        c,
        e,
        f,
        100
    ),
    r,
    WRAPCOLS(
        j,
        8
    ),
    r
)
Excel solution 13 for Summarize by Five-Year Brackets, proposed by Challa Sai Kumar Reddy:
=LET(
    D,
    A2:A100,
    V,
    B2:B100,
    E,
    MAX(
        D
    ),
    S,
    SUMIFS(
        V,
        D,
        ">="&SEQUENCE(
            ROUNDDOWN(
                E/5,
                0
            )*5+1,
            ,
            0,
            5
        ),
        D,
        "<="&SEQUENCE(
            ROUNDDOWN(
                E/5,
                0
            )*5+5,
            ,
            5,
            5
        )
    ),
    T,
    SUM(
        S
  &  ),
    HSTACK(
        "Year",
        "Sum of Value",
        "% of Value",
        TEXTJOIN(
            "-",
            TRUE,
            SEQUENCE(
                ROUNDDOWN(
                E/5,
                0
            )+1,
                ,
                0,
                5
            )&"-"&SEQUENCE(
                ROUNDDOWN(
                E/5,
                0
            )+5,
                ,
                5,
                5
            )
        ),
        S,
        S/T,
        SUM(
        S
    ),
        T
    )
)
Solving the challenge of Summarize by Five-Year Brackets with Python in Excel
Python in Excel solution 1 for Summarize by Five-Year Brackets, proposed by John V.:
Hi everyone!
One [Py] Option could be:
d = xl("A1:B100", headers = True)
y, v = 'Year', 'Value'
d[y] = d[y].apply(lambda x: str((n:=x//5 * 5)) + str(-n-4))
t = d[v].sum()
d = d.groupby(y).agg({v: ['sum', lambda x: x.sum() / t]}).reset_index()
d.loc[len(d)] = ('Grand Total', t, 1)
d.columns = [y, 'Sum of ' + v, '% of ' + v]
d
Blessings!
Python in Excel solution 3 for Summarize by Five-Year Brackets, proposed by Giorgi Goderdzishvili:
df = xl("A1:B100", headers=True)
comp = [str(i)+'-'+str(i+4) for i in range(1990,2021,5)]
def cat(year):
 for i in comp:
 if year>=int(i[:4]) and year<=int(i[-4:]):
 return i

df["Cat"] = df["Year"].apply(cat)
nw_df = df.groupby("Cat",as_index=False).Value.sum()
nw_df["Total"] = round(nw_df.Value / nw_df.Value.sum(),2)
fn_row = pd.Series({"Year":"Grand Total","Sum of Value":nw_df.Value.sum(), "% of Value":1})
nw_df.columns = ["Year","Sum of Value","% of Value"]
pd.concat([nw_df,fn_row.to_frame().transpose()])
Solving the challenge of Summarize by Five-Year Brackets with R
R solution 1 for Summarize by Five-Year Brackets, proposed by Konrad Gryczan, PhD:
library(tidyverse)
library(readxl)
input = read_excel("Excel/403 Generate Pivot Table.xlsx", range = "A1:B100")
test = read_excel("Excel/403 Generate Pivot Table.xlsx", range = "D2:F9")
result = input %>%
 mutate(group = cut(Year, breaks = seq(1989, 2024, 5), labels = FALSE, include.lowest = TRUE)) %>%
 group_by(group) %>%
 summarize(Year = paste0(min(Year), "-", max(Year)),
 `Sum of Value` = sum(Value)) %>%
 ungroup() %>%
 mutate(`% of Value` = `Sum of Value`/sum(`Sum of Value`)) %>%
 select(-group)
&&