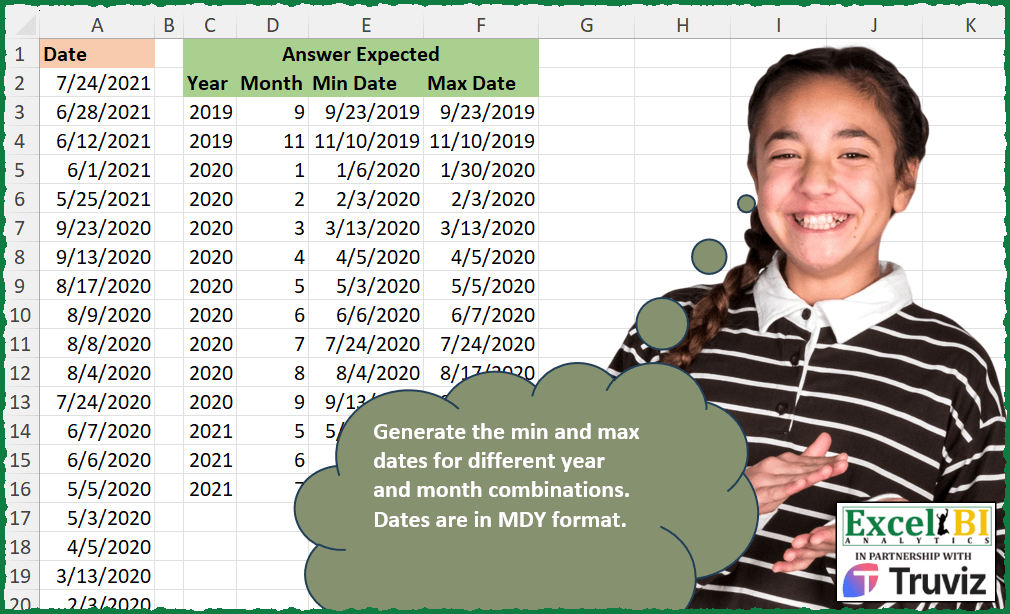
Generate the min and max dates for different year and month combinations. Dates are in MDY format.
📌 Challenge Details and Links
ExcelBI Excel Challenge Number: 398
Challenge Difficulty: ⭐️⭐️
📥Download Sample File
📥Link to the solutions on LinkedIn
Solving the challenge of Min and Max Dates by Group with Power Query
Power Query solution 1 for Min and Max Dates by Group, proposed by John V.:
let
 S = Excel.CurrentWorkbook(){0}[Content],
 A = Table.Sort(Table.TransformColumnTypes(S, {"Date", type date}), "Date"),
 T = Table.AddColumn,
 Y = T(A, "Year", each Date.Year([Date])), M = T(Y, "Month", each Date.Month([Date]))
in
 Table.Group(M, {"Year", "Month"}, {{"Min Date", each List.Min([Date])}, {"Max Date", each List.Max([Date])}})

Blessings!
Power Query solution 2 for Min and Max Dates by Group, proposed by Kris Jaganah:
let
  Source = Excel.CurrentWorkbook(){[Name = "Table1"]}[Content],
  #"Changed Type" = Table.TransformColumnTypes(Source, {{"Date", type date}}),
  #"Added Custom" = Table.AddColumn(#"Changed Type", "Year", each Date.Year([Date])),
  #"Added Custom1" = Table.AddColumn(#"Added Custom", "Month", each Date.Month([Date])),
  #"Grouped Rows" = Table.Group(
    #"Added Custom1",
    {"Year", "Month"},
    {
      {"Min Date", each List.Min([Date]), type nullable date},
      {"Max Date", each List.Max([Date]), type nullable date}
    }
  ),
  #"Sorted Rows" = Table.Sort(
    #"Grouped Rows",
    {{"Year", Order.Ascending}, {"Month", Order.Ascending}}
  )
in
  #"Sorted Rows"
Power Query solution 3 for Min and Max Dates by Group, proposed by Alejandro Simón 🇵🇦 🇪🇸:
let
  Source = Excel.CurrentWorkbook(){[Name = "Table1"]}[Content],
  Year = Table.AddColumn(Source, "Year", each Date.Year([Date])),
  Group = Table.Group(
    Year,
    {"Year"},
    {
      {
        "A",
        each
          let
            a = List.Select(
              List.Transform(
                {1 .. 12},
                (x) => List.Sort(List.Select([Date], each Date.Month(_) = x))
              ),
              each not List.IsEmpty(_)
            ),
            b = List.Transform(a, each {Date.Month(List.First(_)), List.First(_), List.Last(_)}),
            c = Table.FromRows(b, {"Month", "Min Date", "Max Date"})
          in
            c
      }
    }
  ),
  Sol = Table.Sort(
    Table.ExpandTableColumn(Group, "A", Table.ColumnNames(Group[A]{0})),
    {"Year", "Month"}
  )
in
  Sol
Power Query solution 4 for Min and Max Dates by Group, proposed by Luan Rodrigues:
let
  Fonte = Tabela1,
  gp = Table.Group(
    List.Accumulate(
      {"Year", "Month"},
      Fonte,
      (s, c) =>
        Table.AddColumn(s, c, each if c = "Year" then Date.Year([Date]) else Date.Month([Date]))
    ),
    {"Year", "Month"},
    {{"Min Date", each List.Min(_[Date])}, {"Max Date", each List.Max(_[Date])}}
  ),
  res = Table.Sort(gp, {{"Year", 0}, {"Month", 0}})
in
  res
Power Query solution 5 for Min and Max Dates by Group, proposed by Ramiro Ayala Chávez:
let
  S = Excel.CurrentWorkbook(){[Name = "Table1"]}[Content],
  a = Table.AddColumn(S, "Year", each Date.Year([Date])),
  b = Table.AddColumn(a, "Month", each Date.Month([Date])),
  c = Table.Sort(b, {{"Date", 0}}),
  Sol = Table.Group(
    c,
    {"Year", "Month"},
    {{"Min Date", each List.Min([Date])}, {"Max Date", each List.Max([Date])}}
  )
in
  Sol
Power Query solution 6 for Min and Max Dates by Group, proposed by Rafael González B.:
let
Source = Excel.CurrentWorkbook(){0}[Content],
TC = Table.TransformColumnTypes(Source,{{"Date", type date}}),
Y = Table.AddColumn(TC, "Year", each Date.Year([Date])),
M = Table.AddColumn(Y, "Month", each Date.Month([Date])),
Group = Table.Group(M, {"Year", "Month"},
{
{"Min Date", each List.Min([Date])},
{"Max Date", each List.Max([Date])}
}),
Sort = Table.Sort(Group,{{"Year", 0}, {"Month", 0}})
in
Sort
🧙♂️🧙♂️🧙♂️
Power Query solution 7 for Min and Max Dates by Group, proposed by Karunakaran S K P:
let
  Source = Excel.CurrentWorkbook(){[Name = "Table1"]}[Content],
  #"Changed Type" = Table.TransformColumnTypes(Source, {{"Date", type date}}),
  #"Inserted Year" = Table.AddColumn(#"Changed Type", "Year", each Date.Year([Date]), Int64.Type),
  #"Inserted Month" = Table.AddColumn(
    #"Inserted Year",
    "Month",
    each Date.Month([Date]),
    Int64.Type
  ),
  #"Grouped Rows" = Table.Group(
    #"Inserted Month",
    {"Year", "Month"},
    {
      {"Min Date", each List.Min([Date]), type nullable date},
      {"Max Date", each List.Max([Date]), type nullable date}
    }
  ),
  #"Sorted Rows" = Table.Sort(#"Grouped Rows", {{"Year", Order.Ascending}})
in
  #"Sorted Rows"
Solving the challenge of Min and Max Dates by Group with Excel
Excel solution 1 for Min and Max Dates by Group, proposed by Bo Rydobon 🇹🇭:
=LET(
    d,
    A2:A25,
    VSTACK(
        {"Year",
        "Month",
        "Min Date",
        "Max Date"},
        DROP(
            GROUPBY(
                HSTACK(
                    YEAR(
                        d
                    ),
                    MONTH(
                        d
                    )
                ),
                d,
                HSTACK(
                    MIN,
                    MAX
                ),
                0,
                0
            ),
            1
        )
    )
)
Excel solution 2 for Min and Max Dates by Group, proposed by محمد حلمي:
=LET(d,
    SORT(
        A2:A25
    ),
    j,
    TEXT(
        d,
        "em"
    ),
    k,
    UNIQUE(
        j
    ),

--HSTACK(MID(
    k,
    {1,
    5},
    {4,
    2}
),
    MAP(
        k,
        LAMBDA(
            a,

            @FILTER(
                d,
                j=a
            )
        )
    ),
    MAP(k,
    LAMBDA(a,
    MAX((j=a)*d)))))
Excel solution 3 for Min and Max Dates by Group, proposed by Kris Jaganah:
=REDUCE({"Year",
    "Month",
    "Min Date",
    "Max Date"},
    SORT(
        UNIQUE(
            EOMONTH(
                --A2:A25,
                0
            )
        )
    ),
    LAMBDA(x,
    y,
    VSTACK(x,
    LET(a,
    YEAR(
        y
    ),
    b,
    MONTH(
        y
    ),
    c,
    A2:A25,
    d,
    FILTER(c,
    (YEAR(
        c
    )=a)*(MONTH(
        c
    )=b)),
    HSTACK(
        a,
        b,
        MIN(
            d
        ),
        MAX(
            d
        )
    )))))
Excel solution 4 for Min and Max Dates by Group, proposed by Kris Jaganah:
=LET(
    a,
    A2:A25,
    GROUPBY(
        HSTACK(
            YEAR(
                a
            ),
            MONTH(
                a
            )
        ),
        a,
        HSTACK(
            MIN,
            MAX
        ),
        ,
        0
    )
)
Excel solution 5 for Min and Max Dates by Group, proposed by Timothée BLIOT:
=REDUCE({"Min Date",
    "Max Date"},
    SEQUENCE(
        14
    ),
    LAMBDA(y,
    x,
     LET(A,
    A2:A25,
    B,
    FILTER(A,
    (MONTH(
        A
    )=INDEX(
        J3:J16,
        x
    ))*(YEAR(
        A
    )=INDEX(
        I3:I16,
        x
    ))),
    VSTACK(
        y,
        HSTACK(
            MIN(
                B
            ),
            MAX(
                B
            )
        )
    ))))
Excel solution 6 for Min and Max Dates by Group, proposed by Hussein SATOUR:
=GROUPBY(
    HSTACK(
        YEAR(
            A2:A25
        ),
         MONTH(
            A2:A25
        )
    ),
     A2:A25,
     HSTACK(
         MIN,
          MAX
     )
)
Excel solution 7 for Min and Max Dates by Group, proposed by Duy Tùng:
=LET(
    a,
    A2:A25,
    b,
    DROP(
        GROUPBY(
            HSTACK(
                YEAR(
                    a
                ),
                MONTH(
                    a
                )
            ),
            a,
            HSTACK(
                MIN,
                MAX
            ),
            ,
            0
        ),
        1
    ),
    IF(
        b>10000,
        TEXT(
            b,
            "m/d/e"
        ),
        b
    )
)
Excel solution 8 for Min and Max Dates by Group, proposed by Sunny Baggu:
=LET(
 _y,
     YEAR(
         A2:A25
     ),

 _m,
     MONTH(
         A2:A25
     ),

 _c12,
     UNIQUE(
         SORTBY(
             HSTACK(
                 _y,
                  _m
             ),
              _y,
              1,
              _m,
              1
         )
     ),

 _c3,
     MAKEARRAY(
 ROWS(
     _c12
 ),

 2,

 LAMBDA(r,
     c,

 INDEX(
 TAKE(TOCOL(IF((_y = INDEX(
     _c12,
      r,
      1
 )) * (_m = INDEX(
     _c12,
      r,
      2
 )),
     $A$2:$A$25,
     x),
     3),
     {-1,
     1}),

 c
 )
 )
 ),

 HSTACK(
     _c12,
      TEXT(
          _c3,
           "m/dd/yyyy"
      )
 )
)
Excel solution 9 for Min and Max Dates by Group, proposed by LEONARD OCHEA 🇷🇴:
=LET(
    d,
    A2:A25,
    GROUPBY(
        HSTACK(
            YEAR(
                d
            ),
            MONTH(
                d
            )
        ),
        d,
        HSTACK(
            MIN,
            MAX
        ),
        ,
        0
    )
)
Excel solution 10 for Min and Max Dates by Group, proposed by Charles Roldan:
=LET(

     Date,
     A2:A25,

     MonthID,
     12 * YEAR(
         Date
     ) + MONTH(
         Date
     ),

     Key,
     SORT(
         UNIQUE(
             MonthID
         )
     ),

     Year,
     INT(
         Key / 12
     ),

     Month,
     Key - Year * 12,

     Min_Date,
     XLOOKUP(
         Key,
          MonthID,
          Date,
          ,
          ,
          -1
     ),

     Max_Date,
     XLOOKUP(
         Key,
          MonthID,
          Date,
          ,
          ,
          1
     ),

     HSTACK(
         Year,
          Month,
          Min_Date,
          Max_Date
     )

)
Excel solution 11 for Min and Max Dates by Group, proposed by Andy Heybruch:
=LET(

    _dt,
    SORT(
        $A$2:$A$25,
        1
    ),

    _yr,
    YEAR(
        _dt
    ),

    _mth,
    MONTH(
        _dt
    ),

    _lookup,
    _yr&"|"&_mth,

    _u_mth,
    UNIQUE(
        _lookup
    ),

    _min,
    BYROW(
        _u_mth,
        LAMBDA(
            a,
            MIN(
                FILTER(
                    _dt,
                    _lookup=a
                )
            )
        )
    ),

    _max,
    BYROW(
        _u_mth,
        LAMBDA(
            a,
            MAX(
                FILTER(
                    _dt,
                    _lookup=a
                )
            )
        )
    ),

    HSTACK(
        --TEXTBEFORE(
            _u_mth,
            "|"
        ),
        --TEXTAFTER(
            _u_mth,
            "|"
        ),
        _min,
        _max
    )
)
Excel solution 12 for Min and Max Dates by Group, proposed by Stefan Olsson:
=QUERY(
    A1:A25,
    "Select Year(Col1), Month(Col1)+1, Min(Col1), Max(Col1) Group By Year(Col1), Month(Col1) Label Year(Col1) 'Year', Month(Col1)+1 'Month', Min(Col1) 'Min Date', Max(Col1) 'Max Date'",
    1
)
Excel solution 13 for Min and Max Dates by Group, proposed by Pieter de Bruijn:
=DROP(
    GROUPBY(
        HSTACK(
            YEAR(
                A2:A25
            ),
            MONTH(
                A2:A25
            )
        ),
        A2:A25,
        HSTACK(
            MIN,
            MAX
        ),
        ,
        0
    ),
    1
)

or
=LET(
    d,
    SORT(
                A2:A25
            ),
    h,
    YEAR(
        d
    )&"|"&MONTH(
        d
    ),
    u,
    UNIQUE(
        h
    ),
    --TEXTSPLIT(
        TEXTAFTER(
            "|"&u&"|"&MAP(
                u,
                LAMBDA(
                    x,
                    LET(
                        f,
                        FILTER(
                            d,
                            h=x
                        ),
                        TEXTJOIN(
                            "|",
                            ,
                            MIN(
                                f
                            ),
                            MAX(
                                f
                            )
                        )
                    )
                )
            ),
            "|",
            SEQUENCE(
                ,
                4
            )
        ),
        "|"
    )
)
Excel solution 14 for Min and Max Dates by Group, proposed by Mahmoud Bani Asadi:
=GROUPBY(
    --TEXT(
        A2:A25,
        {"yyy",
        "m"}
    ),
    A2:A25,
    HSTACK(
        MIN,
        MAX
    ),
    ,
    0
)
Excel solution 15 for Min and Max Dates by Group, proposed by Anup Kumar:
=LET(
rng,
    A2:A25,

yrs,
     YEAR(
         rng
     ),

mnt,
     MONTH(
         rng
     ),

mnd,
     SCAN("",
    SEQUENCE(
        ROWS(
         rng
     )
    ),
    LAMBDA(x,
    y,
    MIN(FILTER(rng,
    (YEAR(
         rng
     )&MONTH(
         rng
     )=INDEX(
         yrs,
         y
     )&INDEX(
         mnt,
         y
     )))))),

mxd,
     SCAN("",
    SEQUENCE(
        ROWS(
         rng
     )
    ),
    LAMBDA(x,
    y,
    MAX(FILTER(rng,
    (YEAR(
         rng
     )&MONTH(
         rng
     )=INDEX(
         yrs,
         y
     )&INDEX(
         mnt,
         y
     )))))),

tbl,
    HSTACK(
        yrs,
        mnt,
        TEXT(
            mnd,
            "dd/mm/yyyy"
        ),
        TEXT(
            mxd,
            "dd/mm/yyyy"
        )
    ),

VSTACK(
    {"Year",
    "Month",
    "Min Date",
    "Max Date"},
    SORT(
        UNIQUE(
            tbl
        ),
        {1,
        2}
    )
)
)
Solving the challenge of Min and Max Dates by Group with Python in Excel
Python in Excel solution 1 for Min and Max Dates by Group, proposed by John V.:
Hi everyone!
One [Py] could be:
d = xl("A1:A25", headers = True)
g = d.groupby([d['Date'].dt.year.rename('Y'), d['Date'].dt.month.rename('M')]).agg({'Date': ['min', 'max']}).reset_index()
g.columns = ['Year', 'Month', 'Min Date', 'Max Date']
g
Blessings!
Python in Excel solution 2 for Min and Max Dates by Group, proposed by Abdallah Ally:
import pandas as pd
file_path = 'Excel_Challenge_398 - Min and Max Dates.xlsx'
df1 = pd.read_excel(file_path, header=1, usecols='C:F').dropna()
df1[['Year', 'Month']] = df1[['Year', 'Month']].astype(int)
df2 = pd.read_excel(file_path, usecols='A')
# Extract year and month
df2['Year'] = df2['Date'].dt.year
df2['Month'] = df2['Date'].dt.month
# Group by year and month, and calculate min and max dates
df2 = df2.groupby(['Year', 'Month'])['Date'].agg(['min', 'max'])
# Rename columns
df2.rename(columns={'min': 'Min Date', 'max': 'Max Date'}, inplace=True)
# Reset index to make 'Year' and 'Month' columns
df2.reset_index(inplace=True)
print(f'nAnswer Expected: n{df1.head()}')
print(f'nMy Answer: n{df2.head()}')
https://github.com/mathematiciantz/Excel_BI_Challenges/blob/main/Excel_Challenge_398_Min_and_Max_Dates.py
&&