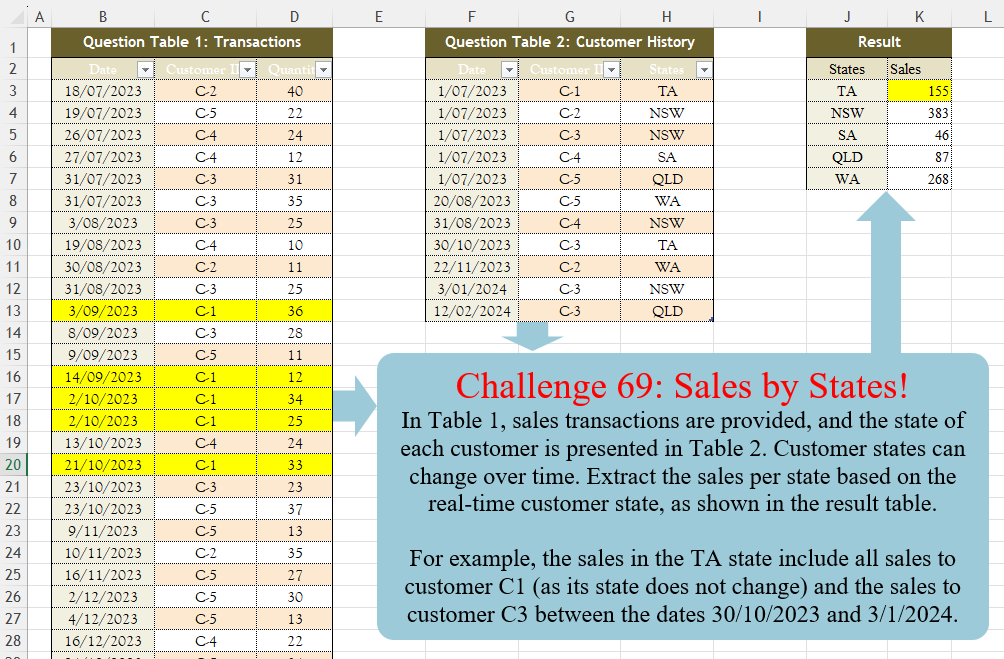
In Table 1, sales transactions are provided, and the state of each customer is presented in Table 2. Customer states can change over time. Extract the sales per state based on the real-time customer state, as shown in the result table. For example, the sales in the TA state include all sales to customer C1 (as its state does not change) and the sales to customer C3 between the dates 30/10/2023 and 3/1/2024
📌 Challenge Details and Links
Challenge Number: 69
Challenge Difficulty: ⭐⭐⭐
📥Download Sample File
📥Link to the solutions on LinkedIn
Solving the challenge of Sales By States! with Power Query
Power Query solution 1 for Sales By States!, proposed by Zoran Milokanović:
let
  Source = each Excel.CurrentWorkbook(){[Name = _]}[Content],
  T = Source("Table2"),
  s = each [States],
  S = Table.Sort(
    Table.Group(
      Table.AddColumn(
        Source("Table1"),
        "States",
        each
          let
            c = each [Customer ID],
            d = each [Date],
            t = Table.SelectRows(T, (r) => d(r) <= d(_))
          in
            t[States]{List.PositionOf(c(t), c(_), 1)}
      ),
      "States",
      {{"Sales", each List.Sum([Quantity])}}
    ),
    each List.PositionOf(s(T), s(_))
  )
in
  S
Power Query solution 2 for Sales By States!, proposed by Brian Julius:
let
  T = Table.TransformColumnTypes(
    Excel.CurrentWorkbook(){[Name = "Table1"]}[Content],
    {"Date", Date.Type}
  ),
  H = Table.TransformColumnTypes(
    Excel.CurrentWorkbook(){[Name = "Table3"]}[Content],
    {"Date", Date.Type}
  ),
  Gp = Table.Group(H, {"Customer ID"}, {{"All", each _}}),
  End = Table.SelectColumns(
    Table.AddColumn(
      Gp,
      "X",
      each [
        a = [All],
        b = a[Date],
        c = List.Transform(
          b,
          each try Date.AddDays(b{List.PositionOf(b, _) + 1}, - 1) otherwise null
        ),
        Hd = Table.ColumnNames(a) & {"EndDate"},
        d = Table.ToColumns(a) & {c},
        e = Table.FromColumns(d, Hd)
      ][e]
    ),
    "X"
  ),
  Ex = Table.ExpandTableColumn(
    End,
    "X",
    {"Date", "Customer ID", "States", "EndDate"},
    {"Date", "C", "States", "EndDate"}
  ),
  R = Table.ReplaceValue(
    Ex,
    null,
    List.Max(T[Date]),
    Replacer.ReplaceValue,
    {"Date", "C", "States", "EndDate"}
  ),
  D = Table.RemoveColumns(
    Table.AddColumn(
      R,
      "Z",
      each List.Transform({Number.From([Date]) .. Number.From([EndDate])}, each Date.From(_))
    ),
    {"Date", "EndDate"}
  ),
  E = Table.ExpandListColumn(D, "Z"),
  Join = Table.Join(T, {"Customer ID", "Date"}, E, {"C", "Z"}, JoinKind.LeftOuter),
  G = Table.Group(Join, {"States"}, {{"Sales", each List.Sum([Quantity]), type number}})
in
  G
Power Query solution 3 for Sales By States!, proposed by Aditya Kumar Darak 🇮🇳:
let
  CustomerHistory = Excel.CurrentWorkbook(){[Name = "CustomerHistory"]}[Content],
  Transactions = Excel.CurrentWorkbook(){[Name = "Transactions"]}[Content],
  Join = Table.AddJoinColumn(Transactions, "Customer ID", CustomerHistory, "Customer ID", "State"),
  Replace = Table.ReplaceValue(
    Join,
    each [State],
    each [Date],
    (x, y, z) => Table.Last(Table.FirstN(y, each [Date] <= z))[States],
    {"State"}
  ),
  Return = Table.Group(Replace, "State", {"Sales", each List.Sum([Quantity])})
in
  Return
Power Query solution 4 for Sales By States!, proposed by Alejandro Simón 🇵🇦 🇪🇸:
let
 Tbl2 = Excel.CurrentWorkbook(){[Name="Table2"]}[Content],
 Tbl1 = Excel.CurrentWorkbook(){[Name="Table1"]}[Content],
 AddCol = Table.AddColumn(Tbl2, "Sales", (x)=>
let
a = Tbl2,
b = Table.SelectRows(a, each [Customer ID]=x[Customer ID] and [Date]>x[Date])[Date]{0}? ?? List.Max(Tbl1[Date]),
c = Table.SelectRows(Tbl1, each [Customer ID]=x[Customer ID] and [Date]>=x[Date] and [Date]<=b),
d = List.Sum(c[Quantity])
in d),
 Sol = Table.Group(AddCol, {"States"}, {{"Sales", each List.Sum([Sales])}})
in
 Sol
Power Query solution 5 for Sales By States!, proposed by Alexis Olson:
let
  Transactions = Excel.CurrentWorkbook(){[Name = "Table1"]}[Content],
  CustomerHistory = Excel.CurrentWorkbook(){[Name = "Table3"]}[Content],
  Merge = Table.NestedJoin(
    Transactions,
    {"Customer ID"},
    CustomerHistory,
    {"Customer ID"},
    "History",
    JoinKind.LeftOuter
  ),
  ExtractState = Table.AddColumn(
    Merge,
    "State",
    each Table.Max(Table.SelectRows([History], (H) => H[Date] < [Date]), "Date")[States]
  ),
  Group = Table.Group(ExtractState, {"State"}, {{"Sales", each List.Sum([Quantity])}})
in
  Group
Power Query solution 6 for Sales By States!, proposed by Kris Jaganah:
let
  T1 = Excel.CurrentWorkbook(){[Name = "Table1"]}[Content],
  T2 = Excel.CurrentWorkbook(){[Name = "Table2"]}[Content],
  St = Table.AddColumn(
    T1,
    "States",
    each List.Last(
      Table.SelectRows(T2, (x) => x[Customer ID] = [Customer ID] and x[Date] <= [Date])[States]
    )
  ),
  Group = Table.Group(St, {"States"}, {"Sales", each List.Sum([Quantity])}),
  Match = Table.AddColumn(Group, "Pos", each List.PositionOf(T2[States], [States])),
  Sort = Table.Sort(Match, {"Pos", 0}),
  Remo = Table.RemoveColumns(Sort, {"Pos"})
in
  Remo
Power Query solution 7 for Sales By States!, proposed by 🇮🇷 Navid Esmaeilzadeh اسماعیل زاده:
let
 S2 = Excel.CurrentWorkbook(){[Name="T_2"]}[Content],
 A = Table.TransformColumnTypes(S2,{{"Date", type date}}),
 S1 = Excel.CurrentWorkbook(){[Name="T_1"]}[Content],
 G = Table.TransformColumnTypes(S1,{{"Date", type date}, {"Customer ID", type text}, {"Quantity", Int64.Type}}),
 M = List.Max(G[Date]),
 B = A,
 C = Table.Group(B, {"Customer ID"}, {{"T", each _, type table [Date=nullable date, Customer ID=text, States=text]}}),
 MF=(X)=>
let
 A1 = Table.AddIndexColumn(X, "I", 1, 1, Int64.Type),
 A2 = Table.AddColumn(A1, "D", each try {Number.From([Date])..Number.From(A1[Date]{[I]})-1} otherwise {Number.From([Date])..Number.From(M)}),
 A3 = Table.ExpandListColumn(A2, "D"),
 A4 = Table.TransformColumnTypes(A3,{{"D", type date}}),
 A5 = Table.SelectColumns(A4,{"D", "Customer ID", "States"})
in
 A5,
 D = Table.AddColumn(C, "MF", each MF([T])),
 E = Table.SelectColumns(D,{"MF"}),
Solving the challenge of Sales By States! with Excel
Excel solution 1 for Sales By States!, proposed by Bo Rydobon 🇹🇭:
=GROUPBY(
    XLOOKUP(
        C2:C41&B2:B41,
        G2:G13&F2:F13,
        H2:H13,
        ,
        -1
    ),
    D2:D41,
    SUM,
    3,
    0
)
Excel solution 2 for Sales By States!, proposed by 🇰🇷 Taeyong Shin:
=GROUPBY(
    LOOKUP(
        C3:C41&B3:B41,
        SORT(
            HSTACK(
                G3:G13&F3:F13,
                H3:H13
            )
        )
    ),
    D3:D41,
    SUM,
    ,
    0,
    -2
)

Without GROUPBY

=LET(
    c,
    LOOKUP(
        C3:C41&B3:B41,
        SORT(
            HSTACK(
                G3:G13&F3:F13,
                H3:H13
            )
        )
    ),
    u,
    UNIQUE(
        c
    ),
    SORTBY(
        HSTACK(
            u,
            MAP(
                u,
                LAMBDA(
                    x,
                    SUM(
                        IF(
                            c=x,
                            D3:D41
                        )
                    )
                )
            )
        ),
        XMATCH(
            u,
            H3:H13
        )
    )
)
Excel solution 3 for Sales By States!, proposed by محمد حلمي:
=MAP(J3:J7,LAMBDA(A,SUM((A=XLOOKUP(
C3:C41&B3:B41,G3:G13&F3:F13,H3:H13,,-1))*D3:D41)))
Excel solution 4 for Sales By States!, proposed by Oscar Mendez Roca Farell:
=LET(u,
     UNIQUE(
         H3:H13
     ),
     HSTACK(u,
     TOCOL(BYCOL(D3:D41*(XLOOKUP(
         C3:C41&B3:B41,
          G3:G13&F3:F13,
          H3:H13,
          ,
         -1
     )=TOROW(
         u
     )),
     LAMBDA(
         c,
          SUM(
              c
          )
     )))))
Excel solution 5 for Sales By States!, proposed by Julian Poeltl:
=LET(
    T,
    B3:D41,
    TT,
    F3:H13,
    S,
    MAP(
        TAKE(
            T,
            ,
            1
        ),
        CHOOSECOLS(
            T,
            2
        ),
        LAMBDA(
            A,
            B,
            LET(
                F,
                FILTER(
                    TT,
                    CHOOSECOLS(
                        TT,
                        2
                    )=B
                ),
                X,
                XMATCH(
                    A,
                    TAKE(
                        F,
                        ,
                        1
                    ),
                    -1
                ),
                INDEX(
                    F,
                    X,
                    3
                )
            )
        )
    ),
    US,
    UNIQUE(
        S
    ),
    HSTACK(
        US,
        MAP(
            US,
            LAMBDA(
                A,
                SUM(
                    FILTER(
                        TAKE(
                            T,
                            ,
                            -1
                        ),
                        S=A
                    )
                )
            )
        )
    )
)
Excel solution 6 for Sales By States!, proposed by Kris Jaganah:
=LET(f,
    H3:H13,
    g,
    MAP(B3:B41,
    C3:C41,
    LAMBDA(x,
    y,
    TAKE(FILTER(f,
    (G3:G13=y)*(F3:F13<=x)),
    -1))),
    h,
    UNIQUE(
        f
    ),
    HSTACK(h,
    MAP(h,
    LAMBDA(z,
    SUM(D3:D41*(z=g))))))
Excel solution 7 for Sales By States!, proposed by Sunny Baggu:
=MAP(
 J3:J7, LAMBDA(a, SUM(
 (
 MAP(
 C3:C41, B3:B41, LAMBDA(x,
     y,
     TAKE(FILTER(H3:H13,
     (G3:G13 = x) * (F3:F13 <= y)),
     -1))
 ) = a
 ) * D3:D41
 )
 )
)
Excel solution 8 for Sales By States!, proposed by Diarmuid Early:
=GROUPBY(     XLOOKUP(
         tab_1[Customer ID]&TEXT(
             tab_1[Date],
             "-yyyy-mm-dd"
         ),          tab_2[Customer ID]&TEXT(
              tab_2[Date],
              "-yyyy-mm-dd"
          ),          tab_2[States],
         ,
         -1
     ),     tab_1[Quantity],
    SUM,
    0,
    0,
    -2
)

The main idea: lookup customer + date (from table 1) in customer + date (table 2),
     returning the state for the next earlier match. So C-2-2023-07-18 matches against C-2-2023-07-01,
     not C-2-2023-11-22.

You could make it a little tighter by dropping the formatting (it still works,
     since the dates as numbers are all 5-digit,
     so alphabetical order = date order)
Excel solution 9 for Sales By States!, proposed by Hussein SATOUR:
=GROUPBY(MAP(B3:B41,
    C3:C41,
    LAMBDA(x,
    y,
    TAKE(FILTER(H3:H13,
    (G3:G13=y)*(F3:F13<=x)),
    -1))),
    D3:D41,
    SUM)
Excel solution 10 for Sales By States!, proposed by Nicolas Micot:
=PRENDRE(TRIER(FILTRE($F$3:$H$13;
    ($G$3:$G$13=C3)*($F$3:$F$13<=B3));
    1;
    -1);
    1;
    -1)

Sales in K3:
=SOMME.SI(
    N3:N41;
    J3:J7;
    D3:D41
)
Solving the challenge of Sales By States! with Python
Python solution 1 for Sales By States!, proposed by Konrad Gryczan, PhD:
import pandas as pd
import numpy as np

path = "CH-069 Sales by State.xlsx"

input1 = pd.read_excel(path, usecols="B:D", skiprows=1)
input2 = pd.read_excel(path, usecols="F:H", skiprows=1, nrows = 11)
input2.columns = input2.columns.str.replace(".1", "")
test = pd.read_excel(path, usecols="J:K", skiprows=1, nrows = 5)
test.columns = test.columns.str.replace(".1", "")

input2 = input2.sort_values(by="Customer ID").reset_index(drop=True)
input2["end_date"] = input2.groupby("Customer ID")["Date"].shift(-1)
input2["end_date"].fillna(pd.Timestamp.today().date(), inplace=True)
input2["end_date"] = pd.to_datetime(input2["end_date"])

res = input1.merge(input2, how="left", on="Customer ID")
res = res[(res["Date_x"] <= res["end_date"]) & (res["Date_x"] >= res["Date_y"])]
res = res.groupby("States").agg({"Quantity": "sum"}).rename(columns={"Quantity": "Sales"}).reset_index()

print(res)
Solving the challenge of Sales By States! with R
R solution 1 for Sales By States!, proposed by Konrad Gryczan, PhD:
library(tidyverse)
library(readxl)
library(fuzzyjoin)

path = "files/CH-069 Sales by State.xlsx"

input1 = read_xlsx(path, range = "B2:D41")
input2 = read_xlsx(path, range = "F2:H13")
test  = read_xlsx(path, range = "J2:K7")

input2 = input2 %>%
 arrange(`Customer ID`) %>%
 mutate(end_date = lead(Date, 1), .by = `Customer ID`) %>%
 replace_na(list(end_date = today()))

res = fuzzy_inner_join(input1, input2,
 by = c("Customer ID" = "Customer ID", "Date" = "Date", "Date" = "end_date"),
 match_fun = list(`==`, `>`, `<=`)) %>%
 summarise(Sales = sum(Quantity), .by = States)

# A tibble: 5 × 2
 States Sales

1 NSW 383
2 QLD 87
3 SA 46
4 TA 155
5 WA 268
Solving the challenge of Sales By States! with SQL
SQL solution 1 for Sales By States!, proposed by Zoran Milokanović:
Sales by State w/
hashtag
#dax.
hashtag
#bitanbit
hashtag
#powerbi

EVALUATE
GROUPBY(
 ADDCOLUMNS(Table1, "States", SELECTCOLUMNS(TOPN(1, FILTER(Table2, AND(Table2[Date] <= Table1[Date], Table2[Customer ID] = Table1[Customer ID])), Table2[Date], DESC), Table2[States])),
 [States], "Sales", SUMX(CURRENTGROUP(), Table1[Quantity])
)