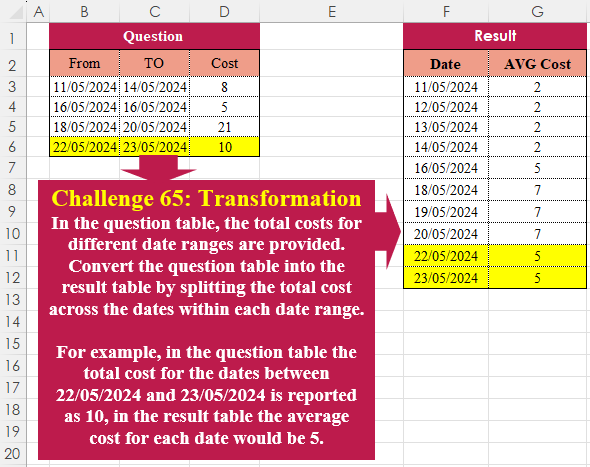
In the question table, the total costs for different date ranges are provided. Convert the question table into the result table by splitting the total cost across the dates within each date range. For example, in the question table the total cost for the dates between 22/05/2024 and 23/05/2024 is reported as 10, in the result table the average cost for each date would be 5.
📌 Challenge Details and Links
Challenge Number: 65
Challenge Difficulty: ⭐⭐⭐
📥Download Sample File
📥Link to the solutions on LinkedIn
📥Link to the solution on YouTube
Solving the challenge of Table Transformation! Part 8 with Power Query
Power Query solution 1 for Table Transformation! Part 8, proposed by Zoran Milokanović:
let
  Source = Table.ToRows(Excel.CurrentWorkbook(){[Name = "Input"]}[Content]),
  S = Table.FromRows(
    List.TransformMany(
      Source,
      each
        let
          d = Duration.Days(_{1} - _{0}) + 1
        in
          List.Zip({List.DateTimes(_{0}, d, Duration.From(1)), List.Repeat({_{2} / d}, d)}),
      (i, _) => _
    ),
    {"Date", "AVG Cost"}
  )
in
  S
Power Query solution 2 for Table Transformation! Part 8, proposed by Brian Julius:
let
  Source = Table.TransformColumnTypes(
    Excel.CurrentWorkbook(){[Name = "Table1"]}[Content],
    {{"From", Date.Type}, {"TO", Date.Type}}
  ),
  Answer = Table.AddColumn(
    Source,
    "X",
    each [
      w = [Cost],
      x = [From],
      y = [TO],
      a = {Number.From(x) .. Number.From(y)},
      b = List.Count(a),
      z = List.Transform(a, each Date.From(_)),
      c = Value.Divide(w, b),
      d = List.Repeat({c}, b),
      e = Table.FromColumns({z, d})
    ][e]
  ),
  Expand = Table.RemoveColumns(
    Table.ExpandTableColumn(Answer, "X", {"Column1", "Column2"}, {"Date", "AvgCost"}),
    Table.ColumnNames(Source)
  )
in
  Expand
Power Query solution 3 for Table Transformation! Part 8, proposed by Luan Rodrigues:
let
  Fonte = Tabela1,
  add = Table.AddColumn(
    Fonte,
    "AVG Cost",
    each
      let
        a = Number.Abs(Number.From([From]) - Number.From([TO])) + 1,
        b = List.Repeat({[Cost] / a}, a),
        c = List.Transform({Number.From([From]) .. Number.From([TO])}, Date.From)
      in
        List.Zip({c, b})
  )[AVG Cost],
  res = Table.Combine(List.Transform(add, each Table.FromRows(_, {"Date", "AVG Cost"})))
in
  res
Power Query solution 4 for Table Transformation! Part 8, proposed by Ramiro Ayala Chávez:
let
S = Excel.CurrentWorkbook(){[Name="Table1"]}[Content],
A = Table.AddColumn,
a = A(S,"Date", each List.Transform({Number.From([From])..Number.From([TO])}, Date.From)),
b = A(a,"C", each List.Count([Date])),
Sol = A(Table.ExpandListColumn(b,"Date"),"AVG Cost", each [Cost]/[C])[[Date],[AVG Cost]]
in
Sol
Power Query solution 5 for Table Transformation! Part 8, proposed by Aditya Kumar Darak 🇮🇳:
let
  Source = Excel.CurrentWorkbook(){[Name = "data"]}[Content],
  Dates = Table.AddColumn(
    Source,
    "Date",
    each List.Dates(Date.From([From]), Number.From([TO] - [From]) + 1, #duration(1, 0, 0, 0)),
    type {date}
  ),
  AvgCost = Table.AddColumn(Dates, "Avg Cost", each [Cost] / List.Count([Date]), type number)[
    [Date],
    [Avg Cost]
  ],
  Return = Table.ExpandListColumn(AvgCost, "Date")
in
  Return
Power Query solution 6 for Table Transformation! Part 8, proposed by Alejandro Simón 🇵🇦 🇪🇸:
let
 Source = Excel.CurrentWorkbook(){[Name="Table1"]}[Content],
 Sol = Table.Combine(Table.AddColumn(Source, "A", (x)=>
let
a = Duration.Days(x[TO]-x[From])+1,
b = x[Cost]/a,
c = List.Repeat({b},a),
d = List.Dates(Date.From(x[From]), a, Duration.From(1)),
e = Table.FromColumns({d,c}, {"Date", "AVG Cost"})
in e)[A])
in
 Sol
Power Query solution 7 for Table Transformation! Part 8, proposed by Kris Jaganah:
let
  Source = Excel.CurrentWorkbook(){[Name = "Table1"]}[Content],
  Dat = Table.AddColumn(
    Source,
    "Date",
    each
      let
        a = [From]
      in
        List.Transform({0 .. Number.From([TO] - a)}, each Date.AddDays(a, _))
  ),
  Expand = Table.ExpandListColumn(Dat, "Date"),
  AvgCost = Table.AddColumn(Expand, "AVG Cost", each [Cost] / (Number.From([TO] - [From]) + 1)),
  Keep = Table.SelectColumns(AvgCost, {"Date", "AVG Cost"})
in
  Keep
Power Query solution 8 for Table Transformation! Part 8, proposed by Abdallah Ally:
let
  Source     = Excel.CurrentWorkbook(){[Name = "Table1"]}[Content],
  Range      = Table.AddColumn(Source, "Interval", each Duration.Days([TO] - [From]) + 1),
  Dates      = Table.AddColumn(Range, "Date", each List.Numbers(Number.From([From]), [Interval])),
  AVGCost    = Table.AddColumn(Dates, "AVG Cost", each [Cost] / [Interval]),
  RemoveCols = Table.RemoveColumns(AVGCost, {"From", "TO", "Cost", "Interval"}),
  ExpandRows = Table.ExpandListColumn(RemoveCols, "Date"),
  Results    = Table.TransformColumns(ExpandRows, {{"Date", Date.From}})
in
  Results
Power Query solution 9 for Table Transformation! Part 8, proposed by 🇮🇷 Navid Esmaeilzadeh اسماعیل زاده:
let
  Source = Excel.CurrentWorkbook(){[Name = "Table1"]}[Content],
  #"Changed Type" = Table.TransformColumnTypes(
    Source,
    {{"From", type date}, {"TO", type date}, {"Cost", Int64.Type}}
  ),
  #"Added Custom" = Table.AddColumn(
    #"Changed Type",
    "AVG Cost",
    each [Cost] / (Duration.TotalDays([TO] - [From]) + 1)
  ),
  #"Added Custom1" = Table.AddColumn(
    #"Added Custom",
    "Date",
    each List.Dates([From], Duration.TotalDays([TO] - [From]) + 1, #duration(1, 0, 0, 0))
  ),
  #"Removed Other Columns" = Table.SelectColumns(#"Added Custom1", {"Date", "AVG Cost"}),
  #"Expanded Date" = Table.ExpandListColumn(#"Removed Other Columns", "Date")
in
  #"Expanded Date"
Power Query solution 10 for Table Transformation! Part 8, proposed by Daniel Madhadha:
let
  Source = Excel.CurrentWorkbook(){[Name = "Data"]}[Content],
  #"Changed Type" = Table.TransformColumnTypes(Source, {{"From", type date}, {"TO", type date}}),
  #"Added Custom" = Table.AddColumn(
    #"Changed Type",
    "Average Cost",
    each Duration.Days([TO] - [From]) + 1
  ),
  #"Added Custom3" = Table.AddColumn(
    #"Added Custom",
    "Custom",
    each List.Dates([From], [Average Cost], Duration.From(1))
  ),
  #"Expanded Custom1" = Table.ExpandListColumn(#"Added Custom3", "Custom"),
  #"Inserted Division" = Table.AddColumn(
    #"Expanded Custom1",
    "Division",
    each [Cost] / [Average Cost],
    type number
  ),
  #"Removed Columns" = Table.RemoveColumns(
    #"Inserted Division",
    {"From", "TO", "Cost", "Average Cost"}
  ),
  #"Renamed Columns" = Table.RenameColumns(
    #"Removed Columns",
    {{"Division", "Average Cost"}, {"Custom", "Date"}}
  )
in
  #"Renamed Columns"
Power Query solution 11 for Table Transformation! Part 8, proposed by Daniel Madhadha:
let
  Source = Excel.CurrentWorkbook(){[Name = "Table1"]}[Content],
  ChangedType = Table.TransformColumnTypes(
    Source,
    {{"From", type date}, {"TO", type date}, {"Cost", Int64.Type}}
  ),
  AddedCustom = Table.AddColumn(
    ChangedType,
    "DateList",
    each List.Dates([From], Duration.Days([TO] - [From]) + 1, #duration(1, 0, 0, 0))
  ),
  ExpandedDates = Table.ExpandListColumn(AddedCustom, "DateList"),
  AddedDayCount = Table.AddColumn(ExpandedDates, "DayCount", each Duration.Days([TO] - [From]) + 1),
  AddedAvgCost = Table.AddColumn(AddedDayCount, "AVG Cost", each [Cost] / [DayCount]),
  FinalTable = Table.SelectColumns(AddedAvgCost, {"DateList", "AVG Cost"}),
  RenamedColumns = Table.RenameColumns(FinalTable, {{"DateList", "Date"}})
in
  RenamedColumns
Power Query solution 12 for Table Transformation! Part 8, proposed by Peter Tholstrup:
let
  Source = Excel.CurrentWorkbook(){[Name = "Table1"]}[Content],
  transform = List.Transform(
    Table.ToRecords(Source),
    each [
      Date = List.Dates(Date.From([From]), Duration.Days([TO] - [From]) + 1, #duration(1, 0, 0, 0)),
      AVG Cost = [Cost] / List.Count(Date)
    ]
  ),
  result = Table.ExpandListColumn(Table.FromRecords(transform), "Date")
in
  result
Power Query solution 13 for Table Transformation! Part 8, proposed by Kerwin Tan CPA:
let
 Source = Excel.CurrentWorkbook(){[Name="Table1"]}[Content],
 Solution1 =
 Table.Combine(
 List.Transform(
 Table.ToRows(Source), each
 let
 from  = Number.From(_{0}),
 to   = Number.From(_{1}),
 val   = _{2},
 dt_rng = List.Transform({from..to}, Date.From)
 in
 Table.FromColumns(
 { dt_rng, List.Transform(dt_rng, each val/List.Count(dt_rng)) },
 type table[Date=date, #"AVG Cost"=Int64.Type]
 )
 )
 )
Solving the challenge of Table Transformation! Part 8 with Excel
Excel solution 1 for Table Transformation! Part 8, proposed by 🇰🇷 Taeyong Shin:
=LET(
    n,
    C3:C6-B3:B6+1,
    s,
    SEQUENCE(
        ,
        MAX(
            n
        )
    ),
    f,
    LAMBDA(
        x,
        TOCOL(
            IFS(
                n>=s,
                x
            ),
            2
        )
    ),
    HSTACK(
        f(
            B3:B6+s-1
        ),
        f(
            D3:D6/n
        )
    )
)
Excel solution 2 for Table Transformation! Part 8, proposed by محمد حلمي:
=REDUCE(
    F2:G2,
    D3:D6,
    LAMBDA(
        a,
        v,
        LET(
            b,
            @+v:B6,
            r,
            @+v:
            C6-b+1,
            VSTACK(
                a,
                CHOOSE(
                    {1,
                    2},
                    SEQUENCE(
                        r,
                        ,
                        b
                    ),
                    v/r
                )
            )
        )
    )
)
Excel solution 3 for Table Transformation! Part 8, proposed by 🇵🇪 Ned Navarrete C.:
=--TEXTSPLIT(CONCAT(MAP(B3:B6,C3:C6-B3:B6+1,D3:D6,LAMBDA(a,b,c,CONCAT( "*"&SEQUENCE(,b,a)&"-"&c/b)))),"-","*",1)Excel solution 4 for Table Transformation! Part 8, proposed by Oscar Mendez Roca Farell:
=LET(
    f,
     B3:B6,
     t,
     C3:C6,
     d,
     t-f+1,
     s,
     SEQUENCE(
          ,
         SUM(
             d
         )
     ),
     i,
     s<=d,
     HSTACK(
         TOCOL(
             f+s-1/i,
              2
         ),
          TOCOL(
              D3:D6/d/i,
               2
          )
     )
)
Excel solution 5 for Table Transformation! Part 8, proposed by Julian Poeltl:
=LET(D,
    B3:D6,
    F,
    TAKE(
        D,
        ,
        1
    ),
    T,
    CHOOSECOLS(
        D,
        2
    ),
    C,
    TAKE(
        D,
        ,
        -1
    ),
    Df,
    (T-F+1),
    AV,
    C/Df,
    R,
    TEXTSPLIT(
        TEXTJOIN(
            ",",
            ,
            MAP(
                F,
                AV,
                Df,
                LAMBDA(
                    A,
                    B,
                    C,
                    TEXTJOIN(
                        ",",
                        ,
                        A+SEQUENCE(
                            C
                        )&"|"&B
                    )
                )
            )
        ),
        "|",
        ","
    ),
    VSTACK(
        HSTACK(
            "Date",
            "AVG Cost"
        ),
        IFERROR(
            R*1,
            R
        )
    ))
Excel solution 6 for Table Transformation! Part 8, proposed by Kris Jaganah:
=LET(a,B3:B6,b,C3:C6,c,D3:D6,d,DROP(REDUCE("",a,LAMBDA(x,y,VSTACK(x,SEQUENCE(OFFSET(y,0,1)-y+1,,y)))),1),HSTACK(d,XLOOKUP(d,a,c/(b-a+1),,-1)))Excel solution 7 for Table Transformation! Part 8, proposed by Abdallah Ally:
=REDUCE(
    {"Date",
    "AVG Cost"},
    B3:B6,
    LAMBDA(
        x,
        y,
        LET(
            a,
            SEQUENCE(
                 OFFSET(
                     y,
                     ,
                     1
                 )-y+1,
                ,
                y
            ),
            b,
            COUNT(
                a
            ),
            c,
            OFFSET(
                y,
                ,
                2
            ),
            VSTACK(
                x,
                HSTACK(
                    a,
                     EXPAND(
                         c/b,
                         b,
                         ,
                         c/b
                     )
                )
            )
        )
    )
)
Excel solution 8 for Table Transformation! Part 8, proposed by Sunny Baggu:
=LET(     rng,
     B3:D6,     REDUCE(          {"Date",
          "AVG Cost"},          SEQUENCE(
              ROWS(
                  rng
              )
          ),          LAMBDA(
              x,
               y,

               VSTACK(

                    x,

                    LET(

                         _c1,
                         INDEX(
                             rng,
                              y,
                              1
                         ),

                         _c2,
                         INDEX(
                             rng,
                              y,
                              2
                         ),

                         _c3,
                         INDEX(
                             rng,
                              y,
                              3
                         ),

                         a,
                         _c2 - _c1 + 1,

                         d,
                         SEQUENCE(
                             a,
                              ,
                              _c1
                         ),

                         b,
                         IF(
                             d,
                              _c3 / a
                         ),

                         HSTACK(
                             d,
                              b
                         )

                    )

               )

          )     ))
Excel solution 9 for Table Transformation! Part 8, proposed by Asheesh Pahwa:
=DROP(
    REDUCE(
        "",
        C3:C6,
        LAMBDA(
            x,
            y,
            VSTACK(
                x,

                LET(
                    o,
                    OFFSET(
                        y,
                        0,
                        1
                    )-y+1,
                    s,
                    SEQUENCE(
                        o,
                        ,
                        y
                    ),
                    d,
                    OFFSET(
                        y,
                        0,
                        2
                    ),

                    c,
                    o,
                    IFNA(
                        HSTACK(
                            s,
                            d/c
                        ),
                        d/c
                    )
                )
            )
        )
    ),
    1
)
Excel solution 10 for Table Transformation! Part 8, proposed by Erik Oehm:
=LET(
 _Inputs, $U$3#,
 fnSingleResult, LAMBDA(input_row, LET(
 _Date1, @CHOOSECOLS(input_row, 1),
 _Date2, @CHOOSECOLS(input_row, 2),
 _Cost, @CHOOSECOLS(input_row, 3),
 _Days, _Date2 - _Date1 + 1,
 _ExpandDates, _Date1 + SEQUENCE(_Days, , 0),
 _AvgCost, _Cost / EXPAND(_Days, _Days, , _Days),
 _Result, HSTACK(_ExpandDates, _AvgCost),
 _Result
 )),
 TILE(
 SEQUENCE(ROWS(_Inputs)),
 LAMBDA(row, fnSingleResult(CHOOSEROWS(_Inputs,row)))
 )
)
Excel solution 11 for Table Transformation! Part 8, proposed by Hussein SATOUR:
=--TEXTSPLIT(
    LET(
        a,
        B3:B6,
        b,
        C3:C6-a+1,
        CONCAT(
            MAP(
                a,
                b,
                D3:D6,
                LAMBDA(
                    x,
                    y,
                    z,
                    CONCAT(
                        x+SEQUENCE(
                            ,
                            y,
                            0
                        )&"/"&SEQUENCE(
                            ,
                            y
                        )^0*z/y&"|"
                    )
                )
            )
        )
    ),
    "/",
    "|",
    1
)
Excel solution 12 for Table Transformation! Part 8, proposed by Pieter de B.:
=LET(f,
    B3:B6,
    t,
    C3:C6,
    c,
    D3:D6/(t-f+1),
    s,
    TAKE(
        f,
        1
    ),
    d,
    SEQUENCE(
        1+TAKE(
            t,
            -1
        )-s,
        ,
        s
    ),
    r,
    HSTACK(d,
    MAP(d,
    LAMBDA(m,
    SUM((f<=m)*(t>=m)*c)))),
    FILTER(
        r,
        DROP(
            r,
            ,
            1
        )
    ))

This works in case of overlapping dates as well (change C4 to 20/5/2024)
Excel solution 13 for Table Transformation! Part 8, proposed by Thang Van:
=LET(
    count,
    DATEDIF(
        B3:B6,
        C3:C6,
        "D"
    )+1,
    quantity,
    D3:D6/count,
    c,
    B3:B6&"|"&count&"||"&quantity,    res,
    REDUCE(
        F2:G2,
        c,
        LAMBDA(
            _init,
            _each,

            VSTACK(
                _init,
                LET(
                    avg_cos,
                    TEXTAFTER(
                        _each,
                        "||"
                    ),
                    to,
                    TEXTBEFORE(
                        TEXTAFTER(
                            _each,
                            "|"
                        ),
                        "||"
                    ),
                    d,
                    TEXTBEFORE(
                        _each,
                        "|"
                    )*1+SEQUENCE(
                        to
                    )-1,
                    IFERROR(
                        HSTACK(
                            d,
                            avg_cos
                        ),
                        avg_cos
                    )
                )

            )
        )
    ),
    res
)
Solving the challenge of Table Transformation! Part 8 with Python
Python solution 1 for Table Transformation! Part 8, proposed by Konrad Gryczan, PhD:
import pandas as pd

input = pd.read_excel("CH-065 Transformation.xlsx", sheet_name="Sheet1", usecols="B:D", skiprows=1, nrows = 4)
test = pd.read_excel("CH-065 Transformation.xlsx", sheet_name="Sheet1", usecols="F:G", skiprows=1, nrows = 10)

result = input.assign(seq = input.apply(lambda row: pd.date_range(start=row['From'], end=row['TO'], freq='D'), axis=1),
 len = (input['TO'] - input['From'] + pd.Timedelta(days=1)).dt.days,
 avg_cost = input['Cost'] / ((input['TO'] - input['From'] + pd.Timedelta(days=1)).dt.days))
 .explode('seq')
 .drop(columns=['From', 'TO', 'len', 'Cost'])
 .rename(columns={'seq': 'Date', 'avg_cost': 'AVG Cost'})
 .astype({'AVG Cost': 'int64'})
 .reset_index(drop=True)

print(result.equals(test)) # True
Python solution 2 for Table Transformation! Part 8, proposed by Luan Rodrigues:
import pandas as pd

file_path = r'CH-065 Transformation.xlsx'

df = pd.read_excel(file_path,usecols="B:D",skiprows=1).dropna()

def calc(x):
 intervalo = pd.date_range(start=x['From'],end=x['TO'])
 count = len(intervalo)
 avg = x['Cost'] / count
 res = [avg] * count
 return pd.DataFrame({'Data':intervalo,'AVG': res})

res = pd.concat(df.apply(calc,axis=1).to_list())
print(res)
Python solution 3 for Table Transformation! Part 8, proposed by Abdallah Ally:
import pandas as pd

# Read the Excel file
file_path = 'CH-065 Transformation.xlsx'
df = pd.read_excel(file_path, usecols='B:D', skiprows=1, nrows=4)

# Perform data wrangling
df['Date'] = df.apply(lambda x: pd.date_range(start=x[0], end=x[1]), axis=1)
df['Interval'] = df['Date'].map(len)
df['AVG Cost'] = (df['Cost'] / df['Interval']).astype(int)
df = df[['Date', 'AVG Cost']]
df = df.explode(column='Date', ignore_index=True)
df['Date'] = df['Date'].dt.strftime('%d/%m/%Y')

# Display the final datset
df
Solving the challenge of Table Transformation! Part 8 with R
R solution 1 for Table Transformation! Part 8, proposed by Konrad Gryczan, PhD:
library(tidyverse)
library(readxl)

input = read_excel("files/CH-065 Transformation.xlsx", range = "B2:D6")
test = read_excel("files/CH-065 Transformation.xlsx", range = "F2:G12")

result = input %>%
 mutate(seq = map2(From, TO, ~seq.POSIXt(.x, .y, by = "day")),
 len = map(seq, ~length(.x)),
 `AVG Cost` = map2_dbl(len, Cost, ~ .y / .x)) %>%
 select(-c(From, TO, len, Cost)) %>%
 unnest(cols = c(seq)) %>%
 select(Date = seq, `AVG Cost`)

identical(result, test)
# [1] TRUE