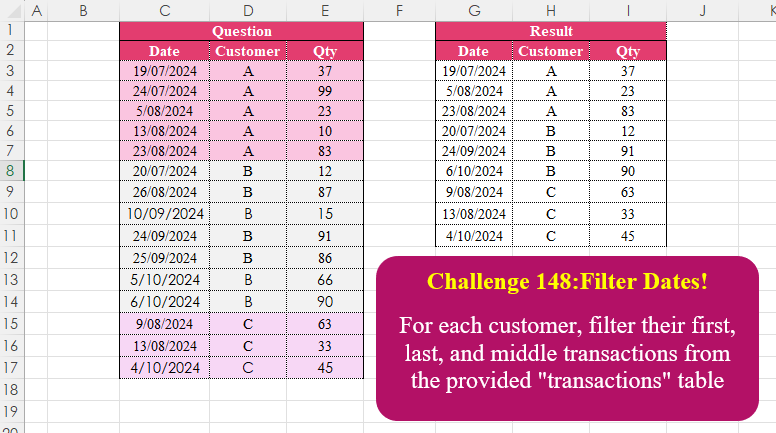
For each customer, filter their first, last, and middle transactions from the provided “transactions” table
📌 Challenge Details and Links
Challenge Number: 148
Challenge Difficulty: ⭐⭐
📥Download Sample File
📥Link to the solutions on LinkedIn
Solving the challenge of Filter Dates! with Power Query
Power Query solution 1 for Filter Dates!, proposed by Zoran Milokanović:
let
  Source = Excel.CurrentWorkbook(){[Name = "Input"]}[Content],
  S = Table.Combine(
    Table.Group(
      Source,
      "Customer",
      {"R", each Table.AlternateRows(_, 1, Number.RoundDown(Table.RowCount(_) / 2) - 1, 1)}
    )[R]
  )
in
  S
Power Query solution 2 for Filter Dates!, proposed by Luan Rodrigues:
let
 Fonte = Tabela1,
 grp = Table.Group(Fonte, {"Customer"}, {{"tab", each
let
a = Table.FirstN(_,1),
b = Table.SelectRows(_, (x)=> List.Median(_[Date]) = x[Date]),
c = Table.LastN(_,1) in a&b&c }})[tab],
 rst = Table.Combine(grp)
in
 rst
Power Query solution 3 for Filter Dates!, proposed by Rafael González B.:
let
Source = Excel.Workbook(File.Contents(ExFile), true, false),
Tbl = Source{1}[Data],
Grouping = Table.Group(Tbl, {"Customer"},
{
{"All", each
let
B = _[Date],
C = List.Count(B) - 1,
D = {B{0}, B{Number.RoundDown(C/2)}, B{C}},
E = Table.SelectRows(_, each List.Contains(D, _[Date]))
in
E}
}),
Anw = Table.Combine(Grouping[All])
in
Anw
🧙🏻♂️🧙🏻♂️🧙🏻♂️Power Query solution 4 for Filter Dates!, proposed by Alejandro Simón 🇵🇦 🇪🇸:
let
Source = Excel.CurrentWorkbook(){[Name="Table1"]}[Content],
Sol = Table.Combine(Table.Group(Source, {"Customer"}, {{"A", each
 let
 a = _,
 b = Table.ToRows(a),
 c = List.Count(b),
 d = {b{0}, b{c/2-0.5}, b{c-1}},
 e = Table.FromRows(d, Table.ColumnNames(a))
 in e}})[A])
in
Sol
Power Query solution 5 for Filter Dates!, proposed by Kris Jaganah:
let
  A = Excel.CurrentWorkbook(){[Name = "Table1"]}[Content],
  B = List.Combine(
    Table.Group(
      A,
      {"Customer"},
      {
        "All",
        each {
          _{0},
          Table.SplitAt(_, Number.IntegerDivide(Table.RowCount(_) + 0.5, 2)){1}{0},
          Table.Last(_)
        }
      }
    )[All]
  ),
  C = Table.FromList(B, each Record.FieldValues(_), Record.FieldNames(B{0}))
in
  C
Power Query solution 6 for Filter Dates!, proposed by 🇮🇷 Navid Esmaeilzadeh اسماعیل زاده:
let
  Source = Excel.CurrentWorkbook(){[Name = "Table1"]}[Content],
  A = Table.TransformColumnTypes(
    Source,
    {{"Date", type date}, {"Customer", type text}, {"Qty", Int64.Type}}
  ),
  B = Table.Group(A, {"Customer"}, {{"Count", each Table.RowCount(_), Int64.Type}, {"T", each _}}),
  C = Table.AddColumn(
    B,
    "T2",
    each Table.FromRecords({[T]{0}, [T]{Number.RoundDown([Count] / 2)}, [T]{[Count] - 1}})
  ),
  D = Table.Combine(C[T2])
in
  D
Power Query solution 7 for Filter Dates!, proposed by Jonathan Moeyersons:
let
 Source = Source,
 // Group rows on Customer
 #"Grouped Rows" = Table.Group(Source, {"Customer"}, {{"GroupedTable", each _, type table [Date=nullable date, Customer=nullable text, Qty=nullable number]}}),

 // Add custom column that selects the first, middle and last column
 #"Added Custom" = Table.AddColumn(#"Grouped Rows", "Custom", each
 [
 a = 1, // First row
 b = Number.RoundDown(Table.RowCount([GroupedTable]) / 2) - 1, // Middle and last row
 c = Table.AlternateRows([GroupedTable], a,b,1) // Select first, middle and last row
 ][c]),

 // Expand the added custom column
 #"Expanded Custom" = Table.ExpandTableColumn(#"Added Custom", "Custom", {"Date", "Qty"}, {"Date", "Qty"}),

 // Remove the intermediate column
 #"Removed Columns" = Table.RemoveColumns(#"Expanded Custom",{"GroupedTable"})
in
 #"Removed Columns"
Power Query solution 8 for Filter Dates!, proposed by Vida Vaitkunaite:
let
  Source = Excel.CurrentWorkbook(){[Name = "Table1"]}[Content],
  Group = Table.Group(
    Source,
    {"Customer"},
    {
      {
        "All",
        each Table.FirstN(_, 1)
          & Table.RemoveFirstN(
            Table.FirstN(_, (Table.RowCount(_) + 1) / 2),
            ((Table.RowCount(_) + 1) / 2) - 1
          )
          & Table.LastN(_, 1)
      }
    }
  ),
  All = Table.Combine(Group[All])
in
  All
Power Query solution 9 for Filter Dates!, proposed by Vida Vaitkunaite:
let
  Source = Excel.CurrentWorkbook(){[Name = "Table1"]}[Content],
  Group = Table.Group(
    Source,
    {"Customer"},
    {
      {
        "All",
        each Table.FirstN(_, 1)
          & (
            if Number.IsEven(Table.RowCount(_)) then
              Table.RemoveFirstN(
                Table.FirstN(_, (Table.RowCount(_) / 2) + 1),
                (Table.RowCount(_) / 2) - 1
              )
            else
              Table.RemoveFirstN(
                Table.FirstN(_, (Table.RowCount(_) + 1) / 2),
                ((Table.RowCount(_) + 1) / 2) - 1
              )
          )
          & Table.LastN(_, 1)
      }
    }
  ),
  All = Table.Combine(Group[All])
in
  All
Solving the challenge of Filter Dates! with Excel
Excel solution 1 for Filter Dates!, proposed by Bo Rydobon 🇹🇭:
=LET(c,D3:D17,REDUCE(C2:E2,UNIQUE(c),LAMBDA(a,d,VSTACK(a,CHOOSEROWS(FILTER(C3:E17,c=d),1,COUNTIF(c,d)/2+1,-1)))))Excel solution 2 for Filter Dates!, proposed by 🇰🇷 Taeyong Shin:
=LET(
    d,
    C2:C17,
    c,
    D2:D17,
    g,
    CHOOSECOLS(
        GROUPBY(
            c,
            d,
            VSTACK(
                MIN,
                MEDIAN,
                MAX
            ),
            3,
            0
        ),
        3,
        1
    ),
    HSTACK(
        g,
        XLOOKUP(
            BYROW(
                g,
                CONCAT
            ),
            d&c,
            E2:E17
        )
    )
)
Excel solution 3 for Filter Dates!, proposed by 🇰🇷 Taeyong Shin:
=LET(
    c,
    D2:D17,
    n,
    COUNTIF(
        c,
        c
    ),
    FILTER(
        C2:E17,
        MMULT(
            N(
                MAP(
                    c,
                    LAMBDA(
                        x,
                        COUNTIF(
                            x:D2,
                            x
                        )
                    )
                )=CHOOSE(
                    {1,
                    2,
                    3},
                    1,
                    CEILING(
                        n/2,
                        1
                    ),
                    n
                )
            ),
            {1;1;1}
        )
    )
)
Excel solution 4 for Filter Dates!, proposed by Oscar Mendez Roca Farell:
=LET(
    c,
    C3:C17,
    d,
    D3:D17,
    g,
    DROP(
        GROUPBY(
            d,
            c,
            HSTACK(
                MIN,
                MEDIAN,
                MAX
            ),
            ,
            0
        ),
        1,
        1
    ),
    t,
    TOCOL(
        g
    ),
    u,
    TOCOL(
        IFS(
            g,
            UNIQUE(
                d
            )
        )
    ),
    HSTACK(
        t,
        u,
        XLOOKUP(
            t&u,
            c&d,
            E3:E17
        )
    )
)
Excel solution 5 for Filter Dates!, proposed by Julian Poeltl:
=LET(
    C,
    D3:D17,
    REDUCE(
        HSTACK(
            "Date",
            "Customer",
            "Qty"
        ),
        UNIQUE(
            C
        ),
        LAMBDA(
            A,
            B,
            VSTACK(
                A,
                LET(
                    F,
                    FILTER(
                        C3:E17,
                        C=B
                    ),
                    R,
                    ROWS(
                        F
                    ),
                    CHOOSEROWS(
                        F,
                        1,
                        ROUND(
                            R/2,
                            0
                        ),
                        R
                    )
                )
            )
        )
    )
)
Excel solution 6 for Filter Dates!, proposed by Kris Jaganah:
=REDUCE(
    {"Date",
    "Customer",
    "Qty"},
    UNIQUE(
        D3:D17
    ),
    LAMBDA(
        x,
        y,
        VSTACK(
            x,
            LET(
                p,
                FILTER(
                    C3:E17,
                    D3:D17=y
                ),
                q,
                ROWS(
                    p
                ),
                INDEX(
                    p,
                    VSTACK(
                        1,
                        q/2+0.5,
                        q
                    ),
                    {1,
                    2,
                    3}
                )
            )
        )
    )
)
Excel solution 7 for Filter Dates!, proposed by John Jairo Vergara Domínguez:
=CHOOSEROWS(
    C:E,
    TOCOL(
        --GROUPBY(
            D.:.D,
            ROW(
                D.:.D
            ),
            HSTACK(
                MIN,
                MEDIAN,
                MAX
            ),
            1,
            0
        ),
        2
    )
)
Excel solution 8 for Filter Dates!, proposed by Imam Hambali:
=LET(
c,
     D3:D17,cc,
     CHOOSECOLS,s,
     SCAN(1,
     --(c=VSTACK(
         0,
          DROP(
              c,
              -1
          )
     )),
     LAMBDA(
         x,
         y,
          IF(
              y=0,
              1,
              y+x
          )
     )),l,
     LAMBDA(
         f,
          GROUPBY(
              c,
              s,
              f,
              0,
              0
          )
     ),tr,
     SORT(
         VSTACK(
             l(
                 MIN
             ),
              l(
                  MAX
              ),
              l(
                  MEDIAN
              )
         ),
         {1,
         2},
         1
     ),CHOOSEROWS(
    C3:E17,
     XMATCH(
         cc(
             tr,
             1
         )&cc(
             tr,
             2
         ),
         c&s
     )
)
)
Excel solution 9 for Filter Dates!, proposed by Sunny Baggu:
=CHOOSEROWS(
 C3:E17,
 DROP(
 REDUCE(
 "🌻",
 UNIQUE(D3:D17),
 LAMBDA(x, y,
 VSTACK(
 x,
 LET(
 _a, FILTER(SEQUENCE(ROWS(C3:C17)), D3:D17 = y),
 VSTACK(TAKE(_a, 1), MEDIAN(_a), TAKE(_a, -1))
 )
 )
 )
 ),
 1
 )
)
Excel solution 10 for Filter Dates!, proposed by Asheesh Pahwa:
=LET(
    c,
    D3:D17,
    dt,
    C3:C17,
    u,
    UNIQUE(
        c
    ),
    DROP(
        REDUCE(
            "",
            u,
            LAMBDA(
                x,
                y,
                VSTACK(
                    x,
                    LET(
                        f,
                        FILTER(
                            dt,
                            c=y
                        ),
                        s,
                        ROUND(
                            COUNT(
                                f
                            )/2,
                            0
                        ),
                        v,
                        VSTACK(
                            TAKE(
                                f,
                                1
                            ),
                            INDEX(
                                f,
                                s,

                            ),
                            TAKE(
                                f,
                                -1
                            )
                        ),
                        IFNA(
                            HSTACK(
                                v,
                                y,
                                XLOOKUP(
                                    v&y,
                                    dt&c,
                                    E3:E17
                                )
                            ),
                            y
                        )
                    )
                )
            )
        ),
        1
    )
)
Excel solution 11 for Filter Dates!, proposed by Bilal Mahmoud kh.:
=REDUCE({"date",
    "Customer",
    "Qty"},
    UNIQUE(
        D3:D17
    ),
    LAMBDA(x,
    y,
    VSTACK(x,
    LET(a,
    FILTER(C3:E17,
    (D3:D17=y)),
    CHOOSEROWS(
        a,
        1,
        ROUND(
            ROWS(
                a
            )/2,
            0
        ),
        ROWS(
                a
            )
    )))))
Excel solution 12 for Filter Dates!, proposed by ferhat CK:
=DROP(
    REDUCE(
        0,
        UNIQUE(
            D3:D17
        ),
        LAMBDA(
            x,
            y,
            VSTACK(
                x,
                LET(
                    a,
                    FILTER(
                        C3:E17,
                        D3:D17=y
                    ),
                    CHOOSEROWS(
                        a,
                        1,
                        ROUNDUP(
                            ROWS(
                                a
                            )/2,
                            0
                        ),
                        -1
                    )
                )
            )
        )
    ),
    1
)
Excel solution 13 for Filter Dates!, proposed by Gerson Pineda:
=INDEX(
    C3:E17,
    XMATCH(
        TOCOL(
            DROP(
                GROUPBY(
                    D3:D17,
                    C3:C17,
                    HSTACK(
                        MIN,
                        MEDIAN,
                        MAX
                    ),
                    ,
                    0
                ),
                1,
                1
            )
        ),
        C3:C17
    ),
    {1,
    2,
    3}
)
Excel solution 14 for Filter Dates!, proposed by Md. Zohurul Islam:
=LET(    p,
    C3:E17,    q,
    D3:D17,    u,
    UNIQUE(
        q
    ),    v,
    REDUCE(
        C2:E2,
        u,
        LAMBDA(
            x,
            y,
            LET(
                rng,
                SORT(
                    FILTER(
                        p,
                        q=y
                    ),
                    1,
                    1
                ),
                a,
                SEQUENCE(
                    ROWS(
                        rng
                    )
                ),
                b,
                a=MIN(
                    a
                ),
                c,
                a=MEDIAN(
                    a
                ),
                d,
                a=MAX(
                    a
                ),
                e,
                b+c+d,
                f,
                FILTER(
                    rng,
                    e
                ),
                g,
                VSTACK(
                    x,
                    f
                ),
                g
            )
        )
    ),    v
)
Excel solution 15 for Filter Dates!, proposed by Nicolas Micot:
=LET(
    _data;
    C3:E17;    _customer;
    D3:D17;    _index;
    SEQUENCE(
        LIGNES(
            _data
        )
    );    FILTRE(
        _data;
        MAP(
            _index;
            _customer;
            LAMBDA(
                l_index;
                l_customer;
                OU(

                    l_index=MIN(
                        SI(
                            _customer=l_customer;
                            _index;
                            ""
                        )
                    );

                    l_index=MOYENNE(
                        SI(
                            _customer=l_customer;
                            _index;
                            ""
                        )
                    );

                    l_index=MAX(
                        SI(
                            _customer=l_customer;
                            _index;
                            ""
                        )
                    )
                )
            )
        )
    )
)
Excel solution 16 for Filter Dates!, proposed by Rick Rothstein:
=REDUCE(
    {"Date",
    "Customer",
    "Qty"},
    UNIQUE(
        D3:D17
    ),
    LAMBDA(
        a,
        x,
        LET(
            I,
            INDEX,
            v,
            VSTACK,
            f,
            FILTER(
                C3:E17,
                D3:D17=x
            ),
            r,
            ROWS(
                f
            ),
            v(
                a,
                v(
                    I(
                        f,
                        1
                    ),
                    I(
                        f,
                        ROUNDUP(
                            r/2,

                        )
                    ),
                    I(
                        f,
                        r
                    )
                )
            )
        )
    )
)
Solving the challenge of Filter Dates! with Python
Python solution 1 for Filter Dates!, proposed by Konrad Gryczan, PhD:
import pandas as pd

path = "CH-148 Filter Dates.xlsx"
input = pd.read_excel(path, usecols="C:E", skiprows=1, nrows=15)
test = pd.read_excel(path, usecols="G:I", skiprows=1, nrows=9).rename(columns=lambda x: x.split('.')[0])

result = input.groupby('Customer').apply(
 lambda x: x.loc[x['Date'].isin([x['Date'].min(), x['Date'].max(), x['Date'].iloc[len(x) // 2]])]
).reset_index(drop=True)

print(test.equals(test)) # Trued
Python solution 2 for Filter Dates!, proposed by Luan Rodrigues:
import pandas as pd
from statistics import median

file = "CH-148 Filter Dates.xlsx"
df = pd.read_excel(file,usecols="C:E",skiprows=1)

def tab(x):
 a = x.iloc[0].to_frame().T
 b = x[x['Date'] == median(x['Date'].tolist())]
 c = x.iloc[-1].to_frame().T
 return pd.concat([a, b, c], axis=0)

grp = df.groupby('Customer').apply(tab).reset_index(drop=True)

print(grp)
Solving the challenge of Filter Dates! with Python in Excel
Python in Excel solution 1 for Filter Dates!, proposed by Alejandro Campos:
df = xl("C2:E17", headers=True)

def get_transactions(df):
 return df.groupby('Customer', group_keys=False).apply(
 lambda x: x.iloc[[0, len(x) // 2 - (len(x) % 2 == 0), -1]])

filtered_transactions = get_transactions(df).reset_index(drop=True)
filtered_transactions
Python in Excel solution 2 for Filter Dates!, proposed by Ümit Barış Köse, MSc:
df = xl("C2:E17", headers=True)
df['Date'] = pd.to_datetime(df['Date'], format='%d.%m.%Y')
df = df.sort_values(by=['Customer', 'Date'])
def get_first_middle_last(group):
 first, middle, last = group.iloc[0], group.iloc[len(group) // 2], group.iloc[-1]
 return pd.DataFrame([first, middle, last])
result = df.groupby('Customer', group_keys=False).apply(get_first_middle_last).reset_index(drop=True)
Solving the challenge of Filter Dates! with R
R solution 1 for Filter Dates!, proposed by Konrad Gryczan, PhD:
library(tidyverse)
library(readxl)

path = "files/CH-148 Filter Dates.xlsx"
input = read_excel(path, range = "C2:E17")
test = read_excel(path, range = "G2:I11")

result = input %>%
 mutate(
 first = Date == min(Date, na.rm = TRUE),
 last = Date == max(Date, na.rm = TRUE),
 middle = Date == Date[ceiling(length(Date)/2)],
 .by = Customer
 ) %>%
 filter(first | last | middle) %>%
 select(Date, Customer, Qty)

all.equal(result, test, check.attributes = FALSE)
#> [1] TRUE
Solving the challenge of Filter Dates! with Google Sheets
Google Sheets solution 1 for Filter Dates!, proposed by Milan Shrimali:
GOOGLE SHEETS:
=LET(DATA,REDUCE("",UNIQUE(D3:D17),LAMBDA(X,Y,IFERROR(VSTACK(X,LET(A,FILTER(C3:E17,D3:D17=Y),STCK,HSTACK(A,SEQUENCE(COUNTA(CHOOSECOLS(A,1)),1,1,1)),FRST,CHOOSEROWS(A,1),LST,CHOOSEROWS(A,-1),MD,fILTER(FILTER(STCK,CHOOSECOLS(STCK,4)=ROUND(MEDIAN(CHOOSECOLS(STCK,4)))),{1,1,1,0}),SORT(VSTACK(FRST,LST,MD),1,-1))),""))),FILTER(DATA,CHOOSECOLS(DATA,1)<>""))
Google Sheets solution 2 for Filter Dates!, proposed by Peter Krkos:
PowerQuery solution:
https://docs.google.com/spreadsheets/d/1zR5IZLz8OT76vhaPEHfsPrw8-RDKnLyyqS49IJjdhFk/edit?pli=1&gid=789993706#gid=789993706